Pick and choose the data you want to see all in one place. With custom analytics, you can create a dashboard with charts and graphs from different sections to organize the data in a way that works best for you.
Included in the beginning of My Dashboards is a default summary dashboard that has two sections: "How are my users using Webex?" and "How is Webex performing." These two sections have pre-populated charts that show you a high-level view of how your Webex deployment is doing in your organization.
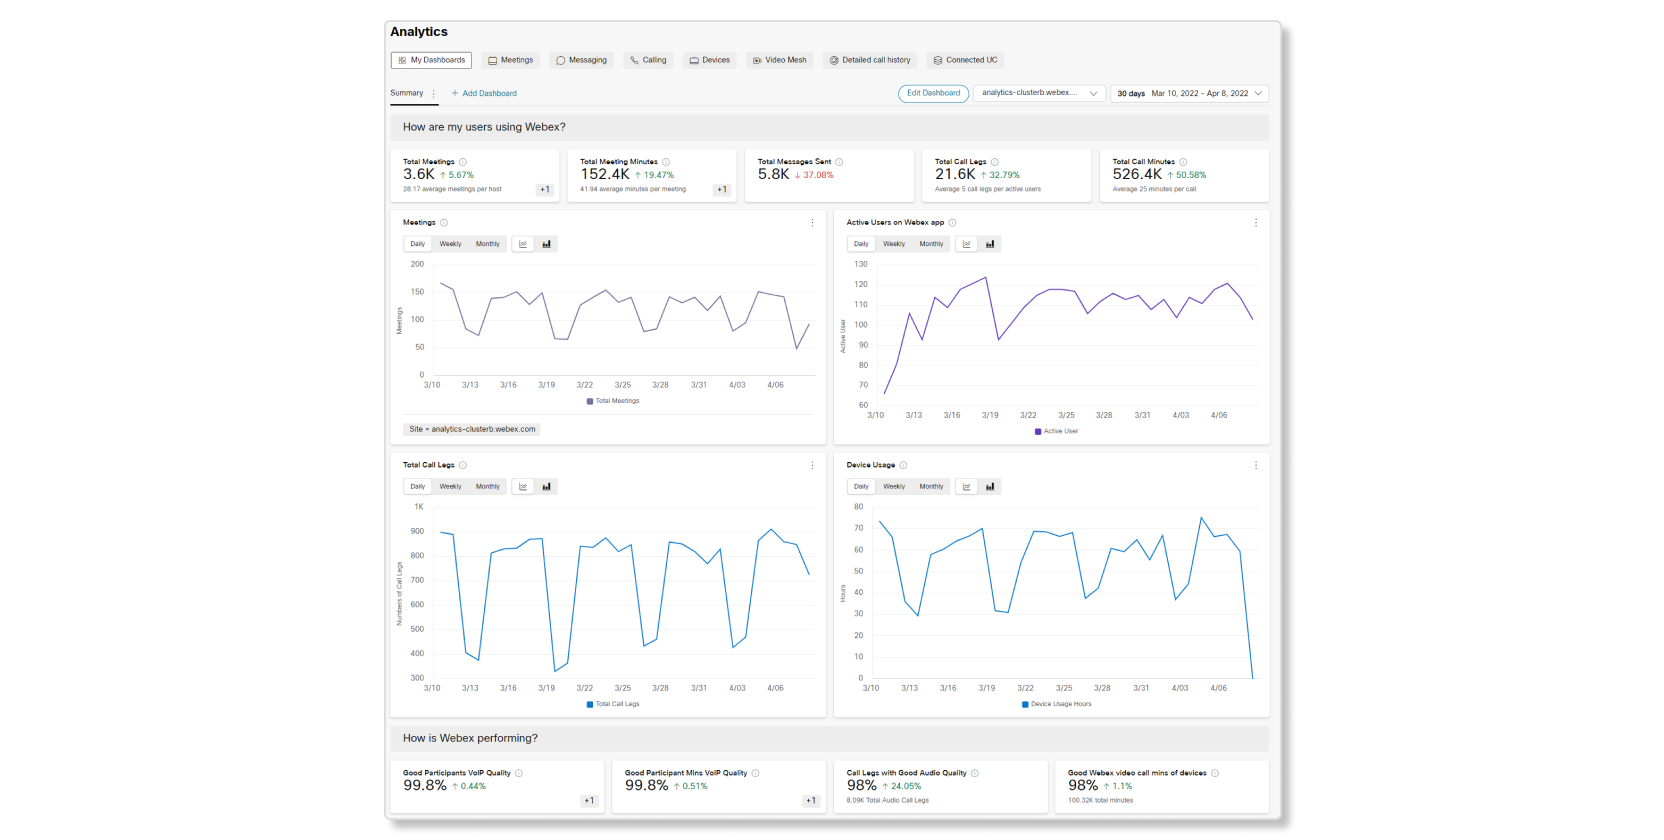
You can customize the Summary dashboard by clicking on Edit Dashboard, or you can build your own dashboards by clicking Add Dashboard.
You can only view dashboards that you created. |
How custom dashboards work
To begin building a dashboard, go to and click Add Dashboard. You can then click on Edit Dashboard to rename the dashboard and add or remove sections in the dashboard. Once you have your dashboard and sections ready to go, you can start adding charts to it, either by adding custom widgets or pinning charts to a dashboard.
Add custom widgets
While you're editing a dashboard, you can click on Add Widgets to add charts from different analytics sections.
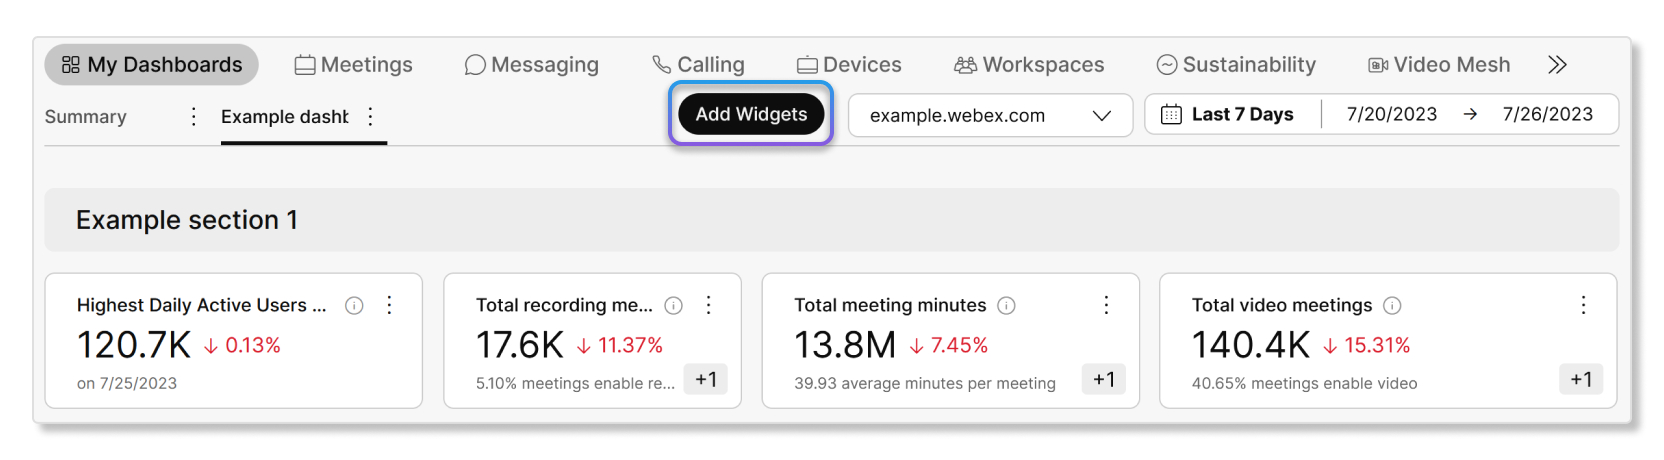
This window allows you to bulk add charts from a service to your dashboard.
Once those charts are added, you can customize filters for the charts by clicking on the three vertical dots and then Edit widget filter.

Pin to dashboard
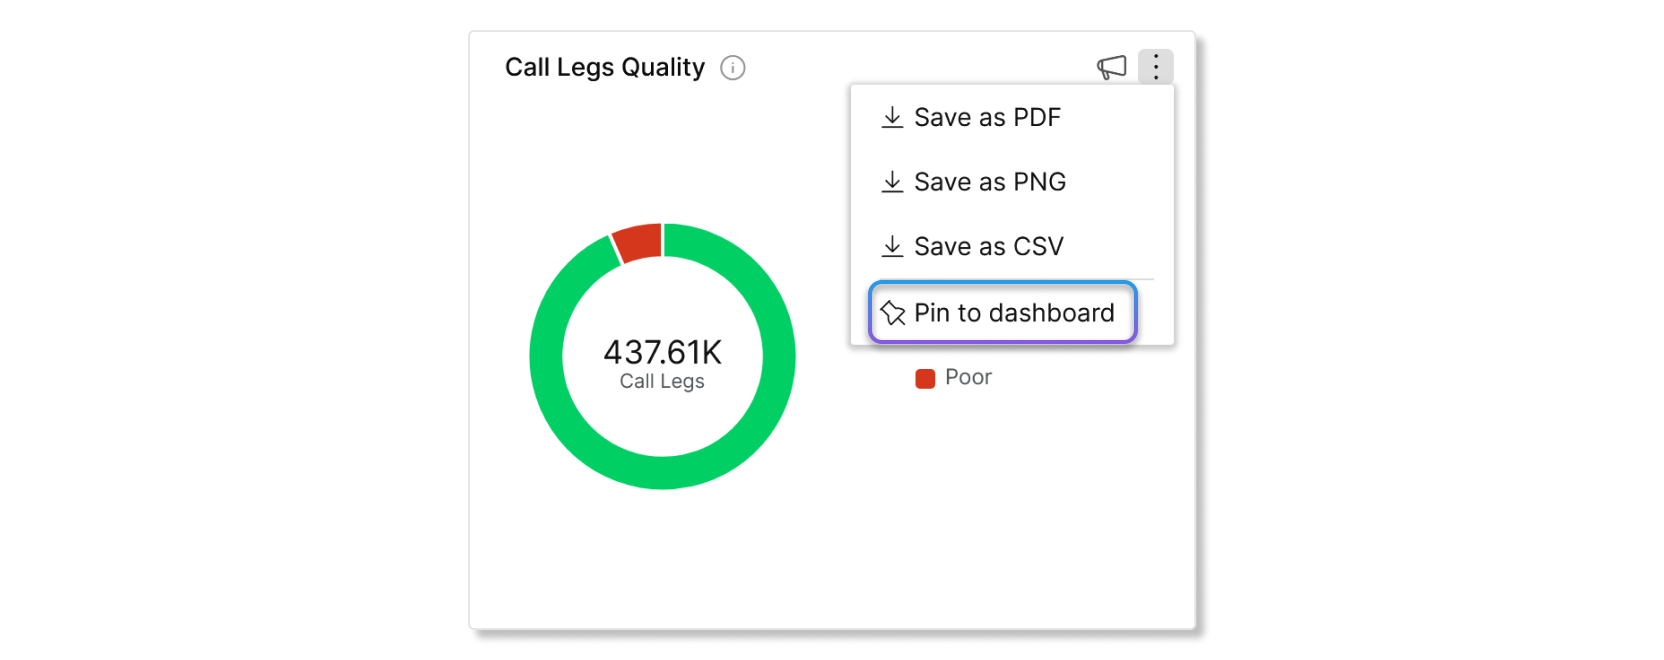
Another way to add charts to a dashboard is to go to the Meetings, Messaging, Calling, or Devices analytics sections and click Pin to dashboard on a chart. To pin charts with filters, you must first apply filters to them. Once you apply the filters, you can pin those charts to a dashboard and they'll keep that filter.
Supported charts and graphs
Custom dashboards only support charts from Meetings, Messaging, Calling, and Devices analytics. Each of those charts can be added to a custom dashboard, and you can resize or reorder them however you want. You can even add multiple copies of the same chart, but with different filters on them.
Download as a PDF
You can download dashboards as a PDF if you want to share the data with your organization or to save the data for yourself as a record. When you download a dashboard as a PDF, it takes a snapshot of the data at that time. Each section will also have its own page break.
How are custom dashboards useful?
Custom dashboards are useful because you can cater each one to fit your need. As an example, let's say you want to create a dashboard that has KPIs from all the other sections. This dashboard helps by giving you a high level view of each Webex service all in one place so you can compare them, and you save time by not having to click into each section one by one. If you notice that the data for one of the KPIs look off, then you can drill down to the relevant section and troubleshoot from there.
Each administrator can only access their own set of custom dashboards.
| 1 |
From the customer view in https://admin.webex.com, go to My Dashboards. |
| 2 |
Click Add Dashboard. A new dashboard is automatically created. You can see how you can edit the
dashboard by looking at the Edit a dashboard section, or start
adding KPIs and charts to it.
|
You can only add widgets from one service at a time. If you want to add widgets from other services, make sure you finish adding widgets from the current service first.
| 1 |
From the customer view in https://admin.webex.com, go to . | ||
| 2 |
Select a dashboard and click . | ||
| 3 |
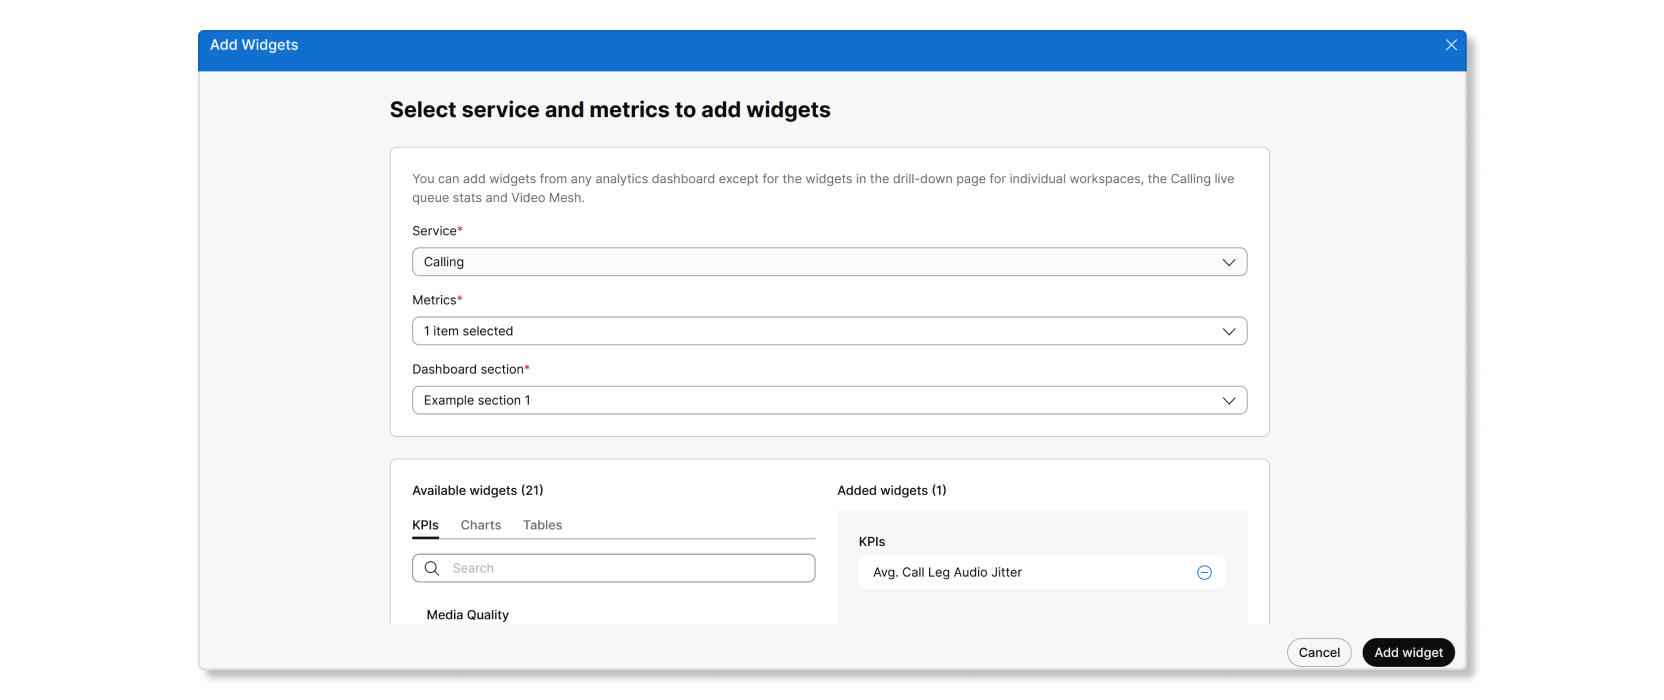
Use the drop-down lists under Service and Metrics to select the types of widgets to add, and then Dashboard section on where to add the widgets. | ||
| 4 |
Select the type of widgets under Available widgets and use the plus button to move the widgets to Added widgets.
| ||
| 5 |
Click Add widget once you're finished. The widgets you selected are now added to your dashboard. You can move, resize,
or add filters to the widgets.
|
When you edit a dashboard, you can:
- Rename the dashboard.
- Resize, reorganize, or remove KPIs, charts, and graphs.
- Rename, reorganize, add, or remove sections.
| 1 |
From the customer view in https://admin.webex.com, go to My Dashboards. |
| 2 |
Select the dashboard that you want to edit, and then click Edit Dashboard. |
| 3 |
Perform one of the following actions:
|
| 4 |
Click Exit once you're finished editing the dashboard. |
| 1 |
From the customer view in https://admin.webex.com, go to My Dashboards. |
| 2 |
Click on the three vertical dots next to a dashboard that you want to download as a PDF. |
| 3 |
Select Download as PDF. A pop-up window appears to show you the status of your download.
|
| 1 |
From the customer view in https://admin.webex.com, go to My Dashboards. |
| 2 |
Click Edit Dashboard. |
| 3 |
Click on the three vertical dots next to a dashboard. |
| 4 |
Click Remove, and then click Yes to confirm that you want to delete the dashboard. |
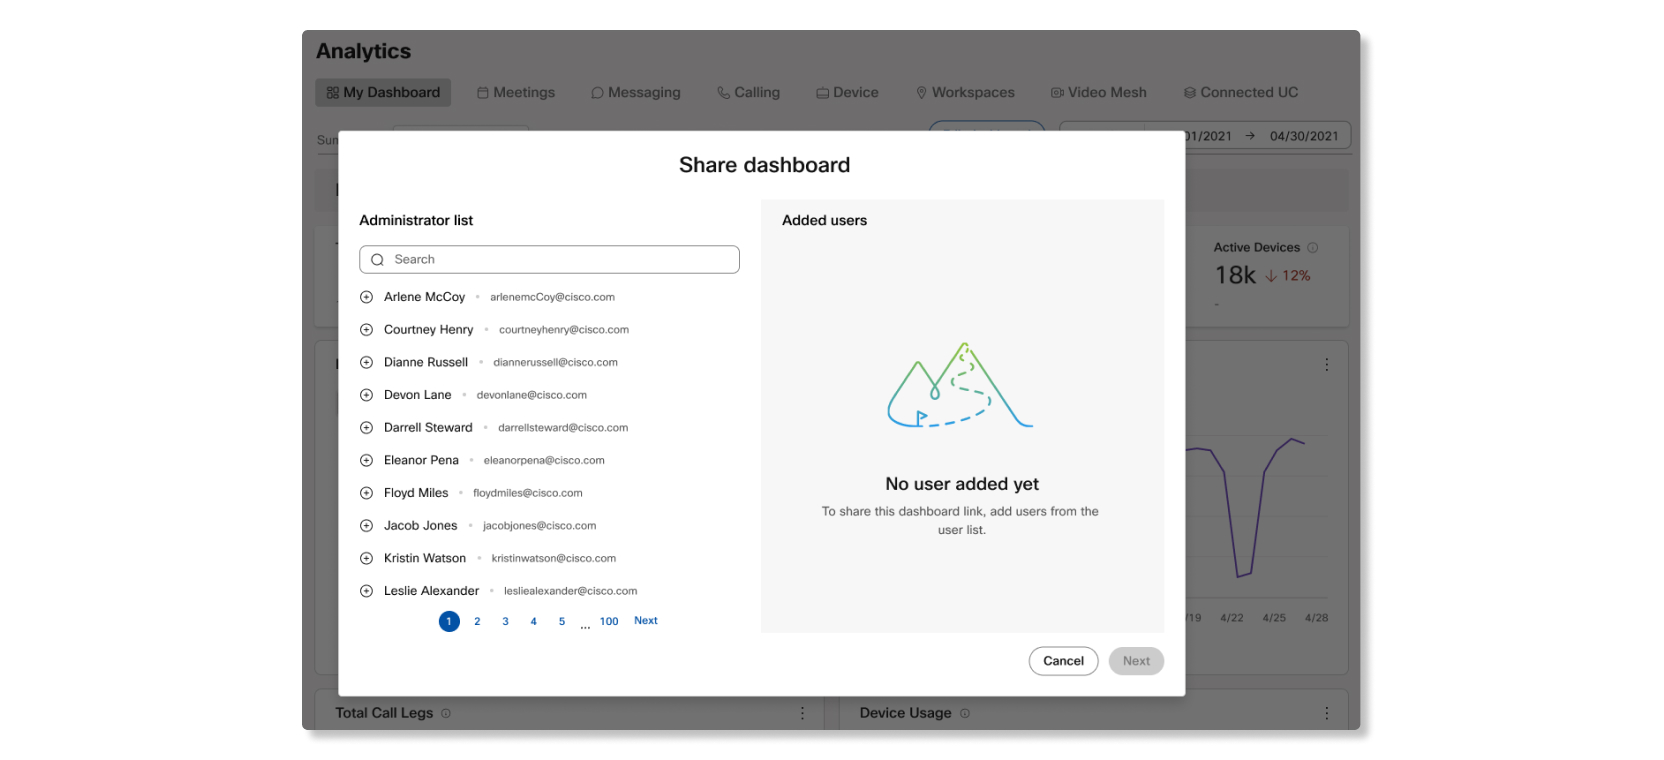
As a full administrator, you can share your dashboards with other administrators in your organization. When you share a dashboard, a snapshot of your dashboard's current layout is taken.
Admins who you shared the dashboard with will have the dashboard added to their dashboard view, and a pop-up bubble will show to let them know about the shared dashboard when they first sign in to Control Hub.
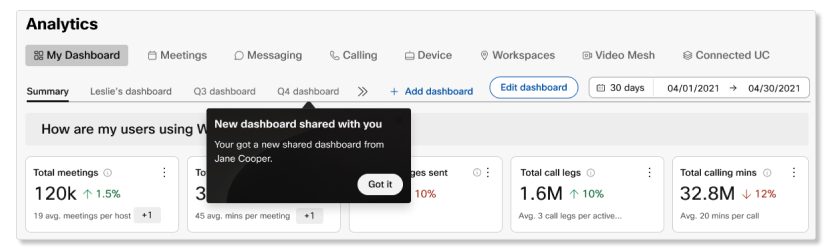
Updates that you make to a dashboard
after you've shared it won't affect the same shared dashboard of other administrators. If
you updated a shared dashboard and you want other administrators to have the updated
dashboard, you must share the dashboard again. |
| 1 |
From the customer view in https://admin.webex.com, go to My Dashboards. |
| 2 |
Click the three vertical dots next to the dashboard that you want to share. |
| 3 |
Select Share dashboard. |
| 4 |
Choose one of the following:
|
| 5 |
If you added users, click Next. |
| 6 |
(Optional) Write a message to put in the email, and then click Share dashboard. An email is sent out to all the users that you added and your shared dashboard
is added to their custom dashboard list.
|


