
Thanks for your feedback.
 Feedback?
The Calling Engagement, Calling Quality, and Messaging App Version reports will be retired on April 28, 2026.You can use the Calling Media Quality and Webex App Version reports to access similar data. Any scheduled jobs associated with the retiring reports will be automatically removed from Control Hub on April 28, 2026.
Using reports, you can see details for each meeting, how often users are messaging each other, details for Webex Calling calls and call queues, how often Cisco devices are used, onboarding information, and more.
Reports is a part of the Monitoring section available in Control Hub that you can use to help track usage or solve issues with Webex services in your organization.
You can generate a ZIP or CSV-formatted report immediately or schedule reports to run automatically in a daily, weekly, or monthly format. When you download a report, the report uses the following naming format for the file:
- CSV—
[report_name]_[start_date_YYYY-MM-DD]_[end_date_YYYY-MM-DD].zip - ZIP—
[report_name]_[site or
            org_name]_[start_date_YYYY-MM-DD]_[end_date_YYYY-MM-DD]_[timezone_offset]_[tracking_id].csv
If timezone isn't applicable for the ZIP file, then
[timezone_offset]is omitted from the naming format. Timezone selection is available only for supported report templates. Unsupported reports continue to use UTC.
To generate these reports with an API, see the Reports API or Report Templates API developer page. You must have Pro Pack in order to generate reports with an API. UI tooltips are shown for features that are only available with Pro Pack.
The following table shows types of reports available for Control Hub, the earliest date range that you can view the data for each report, and the maximum date range that you can select for each report that you run.
|
Report |
Standard License |
Pro Pack License |
Latest Data Available to Generate on Current Date |
Available Data Date Range |
Standard—Date Range Limit Per Download |
Pro Pack—Date Range Limit Per Download |
|---|---|---|---|---|---|---|
|
Onboarding User Activation and License Details Report |
✔ |
✔ | Yesterday |
13 months from current date |
31 days |
92 days |
|
Meetings Embedded Apps Report |
✔ |
✔ | Yesterday |
13 months from current date |
31 days |
31 days |
|
Meetings In-Meeting Feature Usage Report |
✔ | Yesterday |
13 months from current date |
31 days |
31 days | |
|
Meetings Usage Summary Report |
✔ |
✔ | Yesterday |
13 months from current date |
31 days |
92 days |
|
Meetings High CPU Report |
✔ |
✔ | Yesterday |
13 months from current date |
31 days |
92 days |
|
Meetings Active Hosts Report |
✔ |
✔ | Yesterday |
13 months from current date |
31 days |
92 days |
|
Meetings Inactive Users Report |
✔ |
✔ | Yesterday |
13 months from current date |
31 days |
92 days |
|
Meetings Active User Rolling Average Report** |
✔ |
✔ | Yesterday |
13 months from current date |
31 days |
92 days |
|
Enterprise Agreement Report** |
✔ |
✔ | Yesterday |
13 months from current date |
31 days |
92 days |
|
Meetings Details Report |
✔ | Yesterday |
13 months from current date |
31 days |
92 days | |
|
Meetings Attendees Report |
✔ | Yesterday |
13 months from current date |
31 days |
31 days | |
|
Meetings Audio Usage Report |
✔ | Yesterday |
13 months from current date |
31 days |
92 days | |
|
Meetings Telephony Report |
✔ | Yesterday |
13 months from current date |
31 days |
92 days | |
|
Meetings License Consumption Report** |
✔ | Yesterday |
NA |
31 days |
92 days | |
|
Webinar Report* |
✔ |
✔ | Yesterday |
13 months from current date |
31 days |
92 days |
|
Messaging External Domain Report |
✔ | Yesterday |
13 months from current date |
31 days |
92 days | |
|
Messaging Bots Activity Report |
✔ | Yesterday |
13 months from current date |
31 days |
92 days | |
|
Messaging User Activity Report |
✔ | Yesterday |
13 months from current date |
31 days |
92 days | |
|
Messaging Bots Activity Summary Report |
✔ | Yesterday |
13 months from current date |
31 days |
92 days | |
|
Messaging User Activity Summary Report |
✔ | Yesterday |
13 months from current date |
31 days |
92 days | |
|
Webex App Version Report |
✔ | Yesterday |
13 months from current date |
31 days |
92 days | |
|
Meetings Future Schedules Report |
✔ | NA (future 90 days) |
NA |
Date range is fixed |
Date range is fixed | |
|
Calling Media Quality Report |
✔ |
✔ | Yesterday |
13 months from current date |
31 days |
92 days |
|
Calling Engagement Report |
✔ |
✔ | Yesterday |
13 months from current date |
31 days |
92 days |
|
Calling Quality Report |
✔ |
✔ | Yesterday |
13 months from current date |
31 days |
92 days |
|
Calling Detailed Call History Report |
✔ |
✔ | Yesterday |
13 months from current date |
31 days |
31 days |
|
Call Queue Stats Report |
✔ |
✔ | Today |
13 months from current date |
31 days |
92 days |
|
Call Queue Agent Stats Report |
✔ |
✔ | Today |
13 months from current date |
31 days |
92 days |
|
Auto Attendant Reports - Stats Summary, Business Hours Key Details, After-Hours Key Details |
✔ |
✔ | Today |
13 months from current date |
31 days |
92 days |
|
Rooms and Desks Detail Report* |
✔ |
✔ | Yesterday |
13 months from current date |
31 days |
92 days |
|
VIMT License Report* |
✔ |
✔ | Yesterday |
13 months from current date |
31 days |
92 days |
|
VIMT Usage Report* |
✔ |
✔ | Yesterday |
13 months from current date |
31 days |
92 days |
|
Devices Power Consumption Report* |
✔ |
✔ | Yesterday |
13 months from current date |
31 days |
92 days |
* These reports aren't available in Webex for Government organizations.
** These reports are only available for subscriptions that bill based on the number of license usage.
Report list
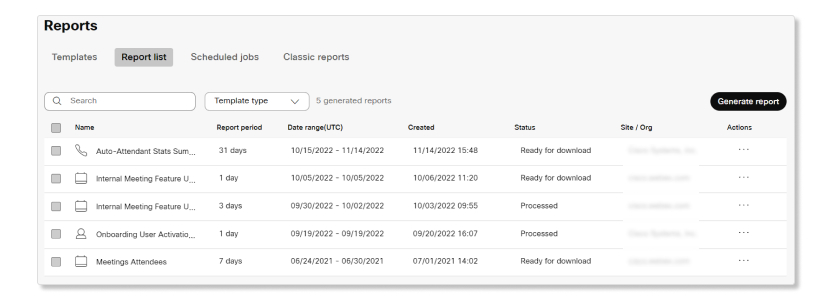
This tab shows a list of reports that are ready for you to download. You can subscribe to a report when scheduling one, you get an email notification when the report is ready to download.
Only the administrator or the user authorized to generate the reports in the Control Hub can view them in the Report List page.
When the report is generating, the status column changes to “In Progress”. When the report is ready to download, the status column changes to “Complete”. Your report may take up to 24 hours to generate, depending on the size of the report and how many reports are queued. Generated reports are available in the Report list tab.
Scheduled reports
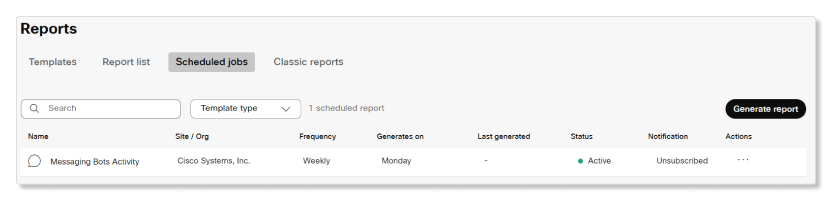
This tab shows a list of reports that are set to run recurringly. You can view the details of each report, such as report name, organization name, frequency of generating the report, day on which the report generates, last generated time, status of schedule, and notification subscription.
This tab shows a list of fixed templates that you can use to schedule reports, along with a brief description for each report.
These reports are for your general use and shouldn't be used for billing purposes.
To view more information about these reports, you can expand the following sections:
Data availability
Data capture is based on the UTC time zone. It takes approximately eight hours for the last-day data to show up for the following day, which is around 8:00 UTC. Different time zones may affect the updates of certain reports with new data.
For example, if you generate a report for the same day, the report may only include partial data. If you include the previous day and the same day in the time range, the report may include partial data, depending on your time zone.
We recommend that you generate same-day reports in the afternoon of your time zone. You can include the previous day data along with the same day data in your reports.
Meetings Embedded Apps
This report provides detail about the different types of Webex embedded apps that a participant uses in a meeting.
|
Column name |
Description |
|---|---|
|
Conference_ID |
Unique ID of the meeting. |
|
Meeting_Name |
Subject of the meeting. |
|
Meeting_Type |
Type of meeting that took place. The possible values are:
|
|
|
Email address of the participant who attended the meeting. |
|
User_Name |
Name of the participant who attended the meeting. |
|
App_Name |
Name of the embedded app used by the participant in the meeting. |
|
Date |
A date on which the embedded app is used by a participant in the meeting. |
Meetings In-Meeting Feature Usage
This report provides detail about which collaboration features are used by a user during meetings in your organization.
We recommend that you use latest Webex Meetings client (WBS 42.7 or above), or at least the latest lockdown version (WBS 42.6), to accurately capture data for this report. If you're using an older client version, some data may not get captured in the report.
Known limitations
Data isn't captured for a user if:
- The user joined with a device that doesn't support in-meeting features.
- The user didn't leave the meeting normally, such as dropping out of the meeting due to a lost network connection or their app crashed.
|
Column name |
Description |
|---|---|
|
MEETING_NUMBER |
The 9-digit meeting access code used to join the meeting. |
|
MEETING_NAME |
The subject of the meeting. |
|
CONFID |
The unique ID of the meeting. |
|
USER_NAME |
The name of the user who attended the meeting. |
|
|
The email address of the user who attended the meeting. |
|
JOIN_DATE |
The date of the meeting (GMT). |
|
START_TIME |
When the meeting started (GMT). |
|
END_TIME |
When the meeting ended (GMT). |
|
NETWORK_BASED_RECORDING |
The user recorded the meeting in the cloud. |
|
APPLICATION_SHARING |
The user shared an application while sharing their screen. |
|
DOCUMENT_SHARING |
The user shared a document while sharing their screen. |
|
CHAT |
The user opened the chat panel and sent a message. |
|
QUESTION_ANSWER |
The user accessed or utilized a question and answer session. |
|
CLOSED_CAPTION |
The user turned on automated closed captions. |
|
WHITEBOARD |
The user shared a whiteboard. |
|
DESKTOP_SHARING |
The user shared their desktop. |
|
WEB_BROWSING_SHARING |
The user shared their screen when they joined the meeting through a browser. |
|
VIDEO_SETTINGS |
The user turned on their video. |
|
APPLICATION_REMOTE_CONTROL |
The user remotely controlled another participant's shared application during the meeting. |
|
WEB_BROWSER_SHARING_REMOTE_CONTROL |
The user remotely controlled another participant's shared web browser during the meeting. |
|
ANNOTATION | |
|
FILE_TRANSFER |
The user transferred a file during the meeting. |
|
DESKTOP_REMOTE_CONTROL |
The user remotely controlled another participant's shared desktop during the meeting. |
|
APPLICATION_REMOTE_CONTROL |
The user remotely controlled another participant's shared desktop during the meeting. |
|
WEB_BROWSER_SHARING_REMOTE_CONTROL |
The user remotely controlled another participant's shared web browser during the meeting. |
|
BREAKOUT_SESSION |
The user started or joined a breakout session.
This field only applies to users who join meetings on the Webex
Suite meeting platform. The value for users who aren't on this
platform show as |
|
SIMULTANEOUS_TRANSLATIONS |
The user enabled the simultaneous translation feature. |
|
REACTIONS |
The user selected a reaction during the meeting. |
|
RAISED_HAND |
The user selected the raise hand feature during the meeting. |
|
MOVE_MEETING_TO_MOBILE |
The user moved their meeting to a mobile device during the meeting. |
|
VIRTUAL_BACKGROUND |
The user enabled a virtual background during the meeting. |
|
REAL_TIME_TRANSLATION |
The user enabled the real time translation feature during the meeting. |
|
WEBEX_ASSISTANT |
The user enabled Webex Assistant during the meeting. |
Meeting AI Usage report
This report provides detail about the use of AI features during meetings in your organization.
Report data might not be available immediately after a meeting. Meeting information can take approximately 30 minutes to become available.
Known limitations
- Delayed meeting data can update an existing meeting record.
- Repeated events don't increase the meeting-level usage count.
|
Column name |
Description |
|---|---|
|
Meeting ID |
Unique ID of the meeting. |
|
Meeting name |
Subject of the meeting. |
|
User name |
Name of the user who attended the meeting. |
|
|
Email address of the user who attended the meeting. |
|
Duration (mins) |
Duration of the meeting, in whole minutes. |
|
AI Assistant enabled |
Indicates whether AI Assistant was enabled for the meeting. |
|
AI Assistant started |
Indicates whether AI Assistant was started during the meeting. |
|
Catch me up count |
Unique count of meetings in which the Catch me up feature was used. |
|
Was my name mentioned count |
Unique count of meetings in which the Was my name mentioned feature was used. |
|
What are the action items count |
Unique count of meetings in which the What are the action items feature was used. |
|
Ask AI Assistant count |
Unique count of meetings in which Ask AI Assistant was used. |
|
Post meeting summary viewed count |
Unique count of meetings in which the Post meeting summary viewed feature was used. |
|
Be right back auto count |
Unique count of meetings in which the Be right back auto feature was used. |
|
Auto detect language count |
Unique count of meetings in which the Auto detect language feature was used. |
Meetings Details
This report provides detail about meetings that are started within the selected date range. You can see host of the meeting, start and end time of the meeting, number of attendees, if the meeting is recorded, and more.
|
Column name |
Description |
|---|---|
|
MEETING_NUMBER |
The 9-digit meeting access code used to join the meeting. |
|
MEETING_NAME |
The subject of the meeting. |
|
CONFERENCE_ID |
The unique ID of the meeting. |
|
MEETING_TYPE |
The type of meeting that took place. The possible values are:
|
|
HOST_NAME |
The name of the user who created or scheduled the meeting. |
|
HOST_USERID |
The unique ID of the host. |
|
HOSTEMAIL |
The email address of the host. |
|
START_TIME |
When the meeting started (GMT). |
|
END_TIME |
When the meeting ended (GMT). |
|
DURATION |
The length of the meeting in minutes. |
|
TOTAL_ATTENDEE |
The number of participants in the meeting. |
|
PEOPLE_MINS |
The total number in minutes that all participants have been in the meeting. For example, if a meeting had 3 participants and they each joined for 10 minutes, then the total equals to 3 participants x 10 minutes each = 30 minutes. |
|
IS_VOIP |
At least one participant called into the meeting using audio connection through a computer. |
|
IS_SHARING |
At least one participant shared their screen in the meeting. |
|
IS_RECORD |
If the meeting is recorded or not. |
|
VIDEO_USERS |
The number of participants who joined with a Webex Meetings client and turned on their video during the meeting. |
|
VIDEO_MINS |
The total number in minutes that participants are sending video. |
|
AUDIO_ONLY (PCN) |
A meeting where all participants called in using PSTN. |
|
TRACKING_CODE_1-10 |
The tracking code associated with a user. The report only shows the default tracking code names. |
|
INTEGRATION_USED |
This field shows if a meeting is scheduled through the Microsoft Teams, Microsoft Outlook, Slack, or Google Calendar integration with the Cisco Webex Meetings app. |
|
WEBEX_ASSISTANT |
This field shows if the Webex Assistant for Meetings is used in the meeting. The possible values are:
|
|
BREAKOUT_USED |
This field shows if a breakout session is started during the meeting. The possible values are:
|
|
IS_E2EE |
This field shows if the meeting is scheduled using end-to-end encryption (E2EE). The possible values are:
|
|
SI_USED |
This field shows if a meeting had simultaneous interpretation enabled by the host. The possible values are:
|
|
Local toll call-in (mins) |
Total duration of domestic toll call-in from telephony attendees. |
|
Local toll-free call-in (mins) |
Total duration of domestic toll free from telephony attendees. |
|
Local callout (mins) |
Total duration of domestic callback from telephony attendees. |
|
International toll call-in (mins) |
Total duration of international toll call-in minutes from telephony attendees. |
|
International toll-free call-in (mins) |
Total duration of international toll free from telephony attendees. |
|
International callout (mins) |
Total international callback minutes from telephony attendees. |
|
Internal callout (mins) |
The total duration of internal callback from telephony attendees. |
|
Integrated VOIP (mins) |
Total duration of VoIP minutes from all data attendees. |
|
Personal room |
This field shows if the meeting was hosted in a personal room.
|
Meetings Attendees
This report provides detail about every participant who attended a meeting within the selected date range. You can find out about a participant’s media quality data during the meeting and information about how they joined the meeting.
Media quality data and hardware information of participants are only available if the meeting's duration is more than two minutes.
|
Column name |
Description |
|---|---|
|
MEETING_NUMBER |
The 9-digit meeting access code used to join the meeting. |
|
MEETING_NAME |
The subject of the meeting. |
|
CONFERENCE_ID |
The unique ID of the meeting. |
|
USER_NAME |
The names of the participants who attended the meeting. |
|
|
The email addresses of the participants who attended the meeting. |
|
LOCATION (DEPRECATED) |
This field has been deprecated. For similar information, use the COUNTRY, STATE, and CITY fields. |
|
JOIN_DATE |
The date of the meeting (GMT). |
|
START_TIME |
The times that the participants joined the meeting (GMT). |
|
END_TIME |
The times that the participants left the meeting (GMT). |
|
DURATION |
The number of minutes the participants remained connected in a meeting. |
|
OS |
The operating systems of the devices the participants used to join the meeting. |
|
BROWSER |
The web browsers that participants used for the Webex Meetings for Web to join the meeting. |
|
LOCAL_IP |
The IP addresses of the clients used to join the meeting. These IP addresses may not be externally routable addresses if they're behind a firewall. |
|
PUBLIC_IP |
The IP addresses of the client that's externally routable. This can be the same as |
|
VOIP_RECEIVING_AVERAGE_PACKET_LOSS |
The average audio packet loss during the meeting from the Webex cloud to the client direction, in percentage. The receiving packet loss is calculated after Webex's packet loss recovery. |
|
VOIP_AVERAGE_LATENCY |
The average audio latency during the meeting, in milliseconds. |
|
JOIN_MEETING_TIME |
JMT = (the time from clicking the meeting link to loading the preview window) + (the time from clicking the Join button in the preview window to connecting into the meeting). JMT doesn’t count the time the user spends browsing menus, making selections in the preview window, or waiting in the lobby. |
|
TCP_PERCENTAGE |
The percentage of the duration participants used TCP connection for a VoIP call. |
|
UDP_PERCENTAGE |
The percentage of the duration participants used UDP connection for a VoIP call. |
|
IS_CMR |
If the attendee joined the meeting using a Webex Room or Desk Device, |
|
IS_SHARING |
Whether or not the participant shared their screen during the meeting. |
|
IS_RECORD |
Whether or not the participant clicked the Record button. |
|
VIDEO_MINUTES |
The total number of minutes that video is enabled by the participant in the meeting. |
|
CLIENT |
The type of soft client used to join the meeting. |
|
CLIENT_VERSION |
The version of the soft client used to join the meeting. |
|
MEDIA_NODE |
The data center or region of the media node that the client is connected to. For cloud-based media nodes, this field shows a general region name such as "San Jose, USA". For video mesh-based media nodes, this field have more specific name that matches the video mesh cluster name that is provisioned by the customer. |
|
CONNECTION |
The type of network connection that the client used to exchange media. Possible values could be "wifi", "ethernet", "cellular", or "unknown". This isn't tracked per media type. It's possible (and relatively common) that this changes over the course of a meeting. Only the initial connection is recorded here. |
|
HARDWARE |
The hardware make and model of the device used to join a meeting. For computers this might be "Lenovo Thinkpad p60". For phones this might be "Samsung Galaxy S7". For room devices this might be "Cisco Webex Room Kit". |
|
CAMERA |
The brand name and model information for the camera that is used during the meeting. This can change over the course of a meeting, however, only the initial camera used is reported. |
|
MICROPHONE |
The brand name and model information for the microphone that is used during the meeting. This can change over the course of a meeting, however, only the initial microphone used is reported. |
|
SPEAKER |
The brand name and model information for the speaker that is used during the meeting. This can change over the course of a meeting, however, only the initial speaker used is reported. |
|
AUDIO_AVERAGE_LATENCY |
The average audio latency during the meeting, in milliseconds. |
|
AUDIO_MAX_LATENCY |
The highest value of audio latency during the meeting, in milliseconds. |
|
AUDIO_RECEIVING_AVERAGE_PACKET_LOSS |
The average end-to-end audio packet loss during the meeting, in percentage. |
|
AUDIO_RECEIVING_MAX_PACKET_LOSS |
The highest value of end-to-end audio packet loss during the meeting, in percentage. |
|
AUDIO_SENDING_AVERAGE_PACKET_LOSS |
The average audio packet loss during the meeting, in percentage. |
|
AUDIO_SENDING_MAX_PACKET_LOSS |
The highest value of audio packet loss during the meeting, in percentage. |
|
AUDIO_RECEIVING_AVERAGE_JITTER |
The average audio jitter during the meeting, in milliseconds. |
|
AUDIO_RECEIVING_MAX_JITTER |
The highest value of audio jitter during the meeting, in milliseconds. |
|
AUDIO_SENDING_AVERAGE_JITTER |
The average audio jitter during the meeting, in milliseconds. |
|
AUDIO_SENDING_MAX_JITTER |
The highest value of audio jitter during the meeting, in milliseconds. |
|
VIDEO_AVERAGE_LATENCY |
The average video latency during the meeting, in milliseconds. |
|
VIDEO_MAX_LATENCY |
The highest value of video latency during the meeting, in milliseconds. |
|
VIDEO_RECEIVING_AVERAGE_PACKET_LOSS |
The average video packet loss during the meeting, in percentage. |
|
VIDEO_RECEIVING_MAX_PACKET_LOSS |
The highest value of video packet loss during the meeting, in percentage. |
|
VIDEO_SENDING_AVERAGE_PACKET_LOSS |
The average video packet loss during the meeting, in percentage. |
|
VIDEO_SENDING_MAX_PACKET_LOSS |
The highest value of video packet loss during the meeting, in percentage. |
|
VIDEO_RECEIVING_AVERAGE_JITTER |
The average video jitter during the meeting, in milliseconds. |
|
VIDEO_RECEIVING_MAX_JITTER |
The highest value of video jitter during the meeting, in milliseconds. |
|
VIDEO_SENDING_AVERAGE_JITTER |
The average video jitter during the call, in milliseconds. |
|
VIDEO_SENDING_MAX_JITTER |
The highest value of video jitter during the meeting, in milliseconds. |
|
CPU_APPLICATION_AVERAGE |
The average CPU usage for the Webex app during the meeting, in percentage. |
|
CPU_APPLICATION_MAX |
The highest CPU usage value for the Webex app during the meeting, in percentage. |
|
CPU_SYSTEM_AVERAGE |
The average system CPU usage during the meeting, in percentage. |
|
CPU_SYSTEM_MAX |
The highest system CPU usage value during the meeting, in percentage. |
|
VIRTUAL_BACKGROUND_USED |
This field shows if participants enabled a virtual background during the meeting. The possible values are:
|
|
HOST_INDICATOR |
This field shows if the participant is a host or attendee. The possible values are:
|
|
IS_COHOST |
This field shows if the participant is a cohost for the meeting. The possible values are:
|
|
Client_Type |
Client that the participant used to join the meeting. |
|
Sub_Client_Type |
Method that the participant used to join the meeting. |
|
Client_Browser_Details |
App or browser that the participant used to join the meeting. |
|
VIDEO_QUALITY |
This field shows the video quality of the participant during the meeting. Video quality is calculated as the participant's average value of video packet loss and latency from their total video minutes per meeting. Possible values are:
|
|
VOIP_QUALITY |
This field shows the participant's VoIP quality during the meeting. VoIP quality is calculated as the participant's average value of audio packet loss and latency from their total audio minutes per meeting. Possible values are:
|
|
COUNTRY |
The country of where the participants joined the meeting from. |
|
STATE |
The state of where the participants joined the meeting from. |
|
CITY |
The city of where the participants joined the meeting from. |
Meetings Usage Summary
This report provides detail about the total number of meetings hosted within the selected date range.
|
Column name |
Description |
|---|---|
|
Number Of Meetings |
The total number of meetings hosted over the selected time period. |
|
Total Meeting Minutes |
The total number of minutes for all meetings over the selected time period. For example, if three meetings lasted 30 minutes each, then the count is 90 meeting minutes. |
|
Number Of Participants |
The total number of participants or devices join from all Webex meetings over the selected time period. For example, if a participant or device disconnected from a meeting and then rejoined, then the count is 2. |
|
Total Participant Minutes |
The total number of minutes that all participants are in a meeting. For example, if a meeting has three participants and lasts for 10 minutes, then the count is 30 participant minutes (3 x 10 minutes). |
|
Participant Sending Video Minutes |
The total number of minutes that participants enabled video for. For example, in a meeting that lasts 30 minutes with five participants, but only two participants enabled video for the entire meeting, the count is 60 video minutes. |
|
Participant VOIP Minutes |
Total number of minutes for participants who joined meetings using VoIP. |
|
Participant Audio Minutes |
Total number of minutes for participants who called in to meetings using PSTN. |
Meetings Active Hosts
This report provides detail about how many meetings a host scheduled and started within the selected date range.
|
Column name |
Description |
|---|---|
|
UserID |
The host's email address. |
|
Count of meetings hosted |
The number of meetings scheduled and hosted by this user within the reported time period. |
|
Host |
The name of the user who hosted the meeting, or the name of the device if the meeting is hosted on a device. |
Meetings Inactive Users
This report provides detail about users who haven’t hosted or attended meetings within the selected date range.
|
Column name |
Description |
|---|---|
|
FIRST_NAME |
The first name of the user. |
|
LAST_NAME |
The last name of the user. |
|
USERNAME |
The email address of the user. |
|
USER_ID |
The unique ID of the user. |
|
|
The email address of the user. |
|
IS_HOST |
Whether or not the user has a Webex Meetings host license. |
|
IS_SITEADMIN |
Whether or not the user has an administrator role for the Webex site. |
|
DAYS_SINCE_LAST_ACTIVE |
The number of days since the user last hosted or attended a meeting through the Webex App app or Webex Meetings. |
|
LAST_ACTIVE_DATE |
The date of when the user last hosted or attended a meeting through the Webex App app or Webex Meetings. PSTN call-in users don’t count as active. |
Meetings Audio Usage
This report provides detail about the different types of audio that participants used during a meeting.
|
Column name |
Description |
|---|---|
|
CONF ID |
The unique ID of the meeting. |
|
MEETING NUMBER |
The 9-digit meeting access code used to join the meeting. |
|
AUDIO TYPE |
The audio type that participants used to join a meeting. The audio types are:
|
|
USER NAME |
The names of the participants who attended the meeting. |
|
|
The email addresses of the participants who attended the meeting. |
|
PHONE NUMBER |
The phone number for participants who joined a meeting through CCA, PSTN, VoIP, Edge Audio, or Fallback. Phone numbers for participants who join a meeting through VoIP show up as NA. |
|
MEETING ENDDATE |
The date of when the meeting ended. |
|
START TIME |
When the meeting started (GMT). |
|
END TIME |
When the meeting ended (GMT). |
|
AUDIO MINUTES |
The total number of audio minutes used by each participant. |
|
MEETING NAME |
The subject of the meeting. |
Meetings Telephony Report
This report provides detail about the different types of audio that participants used during a meeting. You can use this chart to get a sense of which calling services that participants prefer to connect to for meetings and calls.
|
Column name |
Description |
|---|---|
|
MEETING_NUMBER |
9- or 10-digit meeting access code used to join the meeting. |
|
CONFERENCE_ID |
Unique ID of the meeting. |
|
SESSION_TYPE |
Audio type (in numerical value) that participants used to join a meeting. Possible audio types are:
|
|
COUNTRY_CODE | Alphabetic or numeric geographical code that the participants used to dial in to the meeting. |
|
MEETING_NAME |
Subject of the meeting. |
|
MEETING_START_DATE_TIME |
Date and time (in GMT) of when the meeting started. |
|
MEETING_END_DATE_TIME |
Date and time (in GMT) of when the meeting ended. |
|
MEETING_DURATION |
Duration (in GMT) of how long the meeting lasted. |
|
USER_NAME |
Display names of the participants who attended the meeting. |
|
|
Email addresses of the participants who attended the meeting. |
|
CALL_SERVICE_TYPE |
Call service type that participants used to join a meeting. Possible call service types are:
|
|
DIALED_IN_PHONE_NUMBER |
Phone number that participants used to dial in to the meeting. |
|
CALLBACK_PHONE_NUMBER |
Phone number that participants requested to join a meeting through callback. |
|
ANI | Automatic number identification of the phone number that the participant used to call in to the meeting. |
|
PARTICIPANT_START_DATE_TIME |
Date and time (in GMT) of when the participant connected their audio in the meeting. |
|
PARTICIPANTS_DURATION |
Duration (in GMT) of how long the participant's audio is connected for in the meeting. |
|
TRACKING_CODE_1-10 |
The tracking code associated with a user. The report only shows the default tracking code names. |
Meetings Future Schedules
This report doesn't have a date range selection. You can see the meetings that are coming up for a Webex site within the next 90 days from the date that you run the report. You can also see meetings that are scheduled within the previous 30 days.
This report shows you the upcoming meetings for the selected Webex site. Use this report to gain insights into how many users are scheduling meetings in a Webex site and understand the volume and timing of upcoming meetings. These details can help you manage the timing of a site migration or a site upgrade that might impact users. You can also identify critical meetings or events to help plan support accordingly.
Meetings scheduled from Webex are included in this report. If hosts are scheduling meetings with a Personal Room invitation URL, then those meetings won’t be included in the report.
|
Column name |
Description |
|---|---|
|
MeetingNumber |
The 9-digit meeting access code used to join the meeting. |
|
ServiceType |
If the meeting is scheduled as a Webex Meeting, Webex Event, Webex Training session, or Webex Webinar (WB). |
|
HostName |
The name of the user who scheduled the meeting. |
|
|
The email address of the user who scheduled the meeting. |
|
MeetingName |
The subject of the meeting. |
|
StartTime |
The date and time of when the meeting will start (GMT). |
|
EndTime |
The date and time of when the meeting will end (GMT). |
|
CreatedOn |
The date and time of when the meeting is scheduled (GMT). |
|
InviteeCount |
The number of users invited to the meeting. |
|
PasswordSet |
If the meeting requires a password to join. |
|
SeriesType |
If the meeting is a one-time meeting or a recurring series. |
|
ExpirationDate |
The date and time of when the meeting series will end (GMT). |
|
LastModifiedDate |
The date and time of when the meeting invitation is last updated (GMT). |
|
ExceptionMeeting |
If one of the meetings in a series is rescheduled for a different time. |
Meetings High CPU
This report shows you which users had an average system CPU usage of 90% or higher for at least 25% of their video minutes during meetings. To optimize resources, Webex downgrades the bit rate and resolution of all videos when the user reaches an average system CPU usage of 95% for five consecutive seconds.
You can use this report to help users on how they can reduce their system CPU usage to have a better meeting experience.
|
Column name |
Description |
|---|---|
|
User Email |
The email address of the user who had high system CPU usage. |
|
Total Video Minutes |
The number of recorded video minutes for each user’s email address during the selected date range. |
|
Video Minutes with High CPU Utilization |
The number of recorded video minutes where the average system CPU usage is at 90% or higher. |
|
% Video Minutes with High CPU |
The percentage of video minutes where the average system CPU usage is at 90% or higher. |
Meetings Active User Rolling Average
This report provides detail about how many licenses are being used in a subscription, and how many users have hosted at least one Webex meeting within the reported date. This report is only available if your organization has an active true forward eligible subscription.
|
Column name |
Description |
|---|---|
|
Date |
The calendar date within the period. A period is defined as a 30-day cycle that starts on the day your subscription is activated, and corresponds with your billing cycle. For example, if your subscription started on July 5, 2020, then the next period would start 30 days later, on August 4, 2020. |
|
Subscription ID |
The unique ID of the subscription. |
|
Product |
The name of the product for the reported licenses. |
|
Provisioned License Quantity |
The total number of licenses provisioned for the subscription and product. |
|
Allocated License Quantity |
The number of licenses allocated to users at the reported date. |
|
Unique Active Hosts Per Day |
The count of unique active hosts on the calendar date. Unique active hosts are hosts who started at least one Webex meeting on the reported date. |
|
Unique Active Meeting Hosts for Past 30 days |
The cumulative number of unique active hosts for the last 30 days, including the current day. Unique active hosts are hosts who started at least one Webex meeting on the reported date. |
|
90 Day Rolling Average Unique Active Meetings Hosts |
The average number of unique active hosts for the preceding 90 days of the reported date, rounded to the nearest whole number. If you have less than 90 days in your subscription, then the average is based on the number of days the subscription has been active for. |
|
Consumption Quantity |
This number reflects the aligned value used to identity a True Forward. IT admins can track this value throughout the contract term, well before the period in which the subscription is due for a potential change. This number matches the same number as the 90 Day Rolling Average Unique Active Meetings Hosts. |
Meetings License Consumption
This report provides detail about how many licenses are being used in a subscription. This report is only available if your organization has an active utility-based billing subscription.
|
Column name |
Description |
|---|---|
|
Date |
The period that the subscription is in. A period is defined as a 30-day cycle that starts on the day your subscription is activated, and corresponds with your billing cycle. For example, if your subscription started on July 5, 2020, then the next period would start 30 days later, on August 4, 2020. |
|
Subscription ID |
The unique ID of the subscription. |
|
Product |
The name of the product for the reported licenses. |
|
Provisioned License Quantity |
The total number of licenses provisioned for the subscription and product. |
|
Allocated License Quantity |
The number of licenses allocated to users at the reported date. |
Simultaneous Guest-to-Guest Meetings
This report provides information about the number of simultaneous meetings hosted by Guest-to-Guest service app.
|
Column name |
Description |
|---|---|
|
Site |
Name of the Webex site. |
|
Host email |
Email address of the host. |
|
Date |
Calendar date for the recorded data. |
|
Daily peak of simultaneous meetings |
Highest number of simultaneous meetings on the date. |
|
Daily peak hour |
Hour of the day with the highest number of simultaneous meetings. |
Real Time Translation Active Host
This report provides information about how many meetings a host scheduled and started within the selected date range that used Real Time Translation (RTT).
|
Column name |
Description |
|---|---|
|
User ID |
Unique identification of the user. |
|
Count of meetings hosted |
Number of meetings that the user hosted. |
|
Host |
Name of the host. |
Real Time Translation Active Host Rolling Average
This report provides information about how many licenses are being used in a subscription and how many users have hosted at least one Webex meeting that used Real Time Translation (RTT) within the reported date.
This report is only available if your organization has an active true forward eligible subscription.
|
Column name |
Description |
|---|---|
|
Date |
Calendar date for the recorded data. |
|
Subscription ID |
The unique ID of the subscription. |
|
Product |
The name of the product for the reported licenses. |
|
Provisioned license quantity |
Total number of licenses provisioned for the subscription and product. |
|
Allocated license quantity |
Number of licenses allocated to users at the reported date. nique active hosts are hosts who started at least one Webex meeting on the reported date. |
|
Unique active hosts per day |
Count of unique active hosts on the calendar date. Unique active hosts are hosts who started at least one Webex meeting on the reported date. |
|
Unique active meeting hosts for past 30 days (including current day) |
Cumulative number of unique active hosts for the last 30 days, including the current day. Unique active hosts are hosts who started at least one Webex meeting on the reported date. |
|
90 day rolling average unique active meeting hosts |
Average number of unique active hosts for the preceding 90 days of the reported date, rounded to the nearest whole number. If you have less than 90 days in your subscription, then the average is based on the number of days the subscription has been active for. |
Webinar Report
This report provides information about Webex webinars that are hosted within the selected date range. You can use this report to view details such as who is the host of webinar, type of webinar, and number of attendees.
|
Column Name |
Description |
|---|---|
|
Meeting ID |
The unique ID of the webinar. |
|
Host ID |
The unique ID of the host. |
|
Webinar Topic |
The subject of the webinar. |
|
Webinar Type |
If it is scheduled as a Webinar or Webcast. |
|
Host Email |
The email address of the host. |
|
Host First Name |
The first name of the host. |
|
Host Last Name |
The last name of the host. |
|
Event Date |
The date of when the webinar started. |
|
Start Time |
The time of when the webinar started (GMT). |
|
End Time |
The time of when the webinar ended (GMT). |
|
Duration |
The number of minutes that the webinar lasted for. |
|
Total Registrants |
The total number of users that registered for the webinar before it started. |
|
Total Attendees |
The total number of users that joined the webinar. |
Webex App version
This report shows data on all platforms and versions that a user signed in to the Webex App on over the last 90 days. For example, if a user signs in to Webex App on both the Windows and Mac client, the report will display two separate entries for that user.
For tips on how to best use this report, you can take a look at the best practices for using the Webex App report article.
|
Column Name |
Description |
|---|---|
|
|
Email address of the user that signed in to the Webex App client. |
|
App Type |
Type of Webex App client installed on the user's operating system. |
|
Platform |
Details about the machine and its operating system. Apple machines may show as a different model because those machines are reported using Apple's own internal device code convention. |
|
Version |
Latest detected version of the Webex App client. |
|
Last Known Date |
Date of when the app version was last validated, when the user last signed in, or when the Webex App version was last updated. |
|
InstallationId |
Unique identifier for the Webex App client installation event. |
Messaging External Domain
This report provides information about external domains and external users collaborating in your organization. You can also see how users from your organization are collaborating with external domains in external spaces.
|
Column Name |
Description |
|---|---|
|
External Domain |
Name of the external domain. |
|
Number of External Users |
Number of users from the external domain in your organization spaces. |
|
Numbers of Spaces with External Users |
Number of spaces in your organization that has at least one user from the external domain. For example, if Bob@external.com is in three different spaces in your organization, then this column shows 3 as the value. |
|
Most Recent Read Message Date |
Last known date of when a user from the external domain read a message in a space in your organization. |
|
Most Recent Sent Message Date |
Last known date of when a user from the external domain sent a message in a space in your organization. |
|
Most Recent Shared File Date |
Last known date of when a user from the external domain shared a file in a space in your organization. |
|
Most Recent Joined Space Date |
Last known date of when a user from the external domain joined a space in your organization. |
|
Number of Users from Your Organization in External Spaces |
Total number of users from your organization that are part of external spaces. |
|
Number of External Spaces with Users from Your Organization |
Total number of external spaces that includes users from your organization. For example, if Alice@example.com is in three different external spaces of the external domain, then this column shows 3 as the value. |
Messaging Bots Activity
This report shows data for every activity of each bot per day during the date range that you select. Each date that you select has their own set of data. For example, you have run messaging bots activity report for June 1, 2020 to June 5, 2020. The report displays every activity of the bot within the selected date range.
If a bot hasn't had any activity during a certain date, then those dates don't show up in the report.
Data for this report is only for bots from your organization. If your organization uses external bots, then data doesn't show for those bots.
|
Column Name |
Description |
|---|---|
|
Bot Name |
The name of the bot. |
|
Bot ID |
The unique ID of the bot. |
|
Date |
The date for the activity of the bot. |
|
Active Spaces Count |
The number of spaces that the bot has sent a message or shared a file in. |
|
Messages Count |
The number of messages sent by the bot. |
|
Files Shared |
The number of files shared by the bot. |
|
New Spaces Joined |
The number of spaces the bot joined. |
|
Spaces Exited |
The number of spaces the bot left. |
|
Bot User Count |
The number of unique users that mentioned the bot. |
|
Bot Mentions Count |
The number of times a user mentions about the bot. |
Messaging User Activity
This report shows data for every activity of each user per day during the date range that you select. Each date that you select has their own set of data. For example, you have run messaging user activity report for June 1, 2020 to June 5, 2020. The report shows you every activity of the user within selected date range.
If a user hasn't had any activity during a certain date, then those dates don't show up in the report.
|
Column Name |
Description |
|---|---|
|
User ID |
The unique ID of the user. |
|
Name |
The first and last name of the user. |
|
|
The email address of the user. |
|
Date |
The date for the activity of the user. |
|
Messages Sent |
The number of messages sent by the user. |
|
Calls |
The number of calls made and meetings joined from the Webex App client by a user. |
|
Files Shared |
The number of files shared in all spaces by the user. |
|
Spaces Count |
The number of spaces that the user has sent a message, called, or shared a file in. |
|
New Spaces Created |
The number of spaces the user created. |
|
New Spaces Joined |
The number of spaces the user joined. |
|
Space Exited |
The number of spaces the user left. |
Messaging Bots Activity Summary
This report shows aggregated data for each activity of each bot during the date range that you select.
Data for this report is only for bots from your organization. If your organization uses bots that aren't part of your organization, then data isn’t shown for those bots.
|
Column Name |
Description |
|---|---|
|
Bot Name |
The name of the bot. |
|
Bot ID |
The unique ID of the bot. |
|
Bot Owner |
The name of the user who created the bot. |
|
Bot Owner Email |
The email address of the user who created the bot. |
|
Start Date |
The first date selected for the report date range. |
|
End Date |
The last date selected for the report date range. |
|
Average Active Spaces Count |
The average number of spaces that the bot has sent a message or shared a file in. |
|
Messages Count |
The number of messages sent by the bot. |
|
Files Shared |
The number of files shared by the bot. |
|
Spaces Joined |
The number of spaces the bot joined. |
|
Spaces Exited |
The number of spaces the bot left. |
|
Average Bot User Count |
The average number of unique users that mentioned the bot. |
|
Bot Mentions Count |
The number of times a user mentions about the bot. |
Messaging User Activity Summary
This report shows aggregated data for each activity of each user during the date range that you select.
|
Column Name |
Description |
|---|---|
|
User ID |
The unique ID of the user. |
|
Name |
The first and last name of the user. |
|
|
The email address of the user. |
|
Start Date |
The first date selected for the report date range. |
|
End Date |
The last date selected for the report date range. |
|
Messages Sent |
The number of messages sent by the user. |
|
Calls |
The number of calls made and meetings joined from the Webex App client by a user. |
|
Files Shared |
The number of files shared in all spaces by the user. |
|
New Spaces Created |
The number of spaces the user created. |
|
Spaces Joined |
The number of spaces the user joined. |
|
Space Exited |
The number of spaces the user left. |
Calling Media Quality report
This report shows details about each call leg that had an established media session using Call on Webex or Webex Calling.
A call leg must establish a media connection for at least 10 seconds to appear in this report.
Webex Calling captures and processes media quality metrics sent by the following supported third-party devices:
-
Polycom
-
Yealink
-
AudioCodes
The received metrics appear in the Media Quality dashboard within the Troubleshooting page in Control Hub.
Limitations
Media quality metrics aren’t available for the following devices:
-
Analog phones
-
IPv6 endpoints
|
Column name |
Description |
|---|---|
|
User Name |
The first and last name of the user. |
|
|
Email address of the user. |
|
Start Time |
Call start time (GMT). |
|
Endpoint |
Application used for making or receiving calls. |
|
Device Used |
Physical device used for making or receiving calls. For example, a Cisco IP Phone 8865. |
|
Call Quality |
Media quality of the call. Call legs are categorized as good if both video and audio stream had jitter below 150ms, latency below 400ms, and packet loss below 5%. |
|
Duration (s) |
The duration of call lasted in seconds. |
|
Max Audio Jitter (ms) |
The maximum value of audio jitter during the call, in milliseconds. |
|
Average Audio Jitter (ms) |
The average value of audio jitter during the call, in milliseconds. |
|
Audio Packet Loss (%) |
The maximum value of audio packet loss during the call, in percentage. |
|
Audio Latency (ms) |
The maximum value of audio latency during the call, in milliseconds. |
|
Audio Only |
This field shows if the call leg only used audio. |
|
Max Video Jitter |
The maximum value of video jitter during the call, in milliseconds. |
|
Average Video Jitter |
The average value of the video jitter during the call, in milliseconds. |
|
Video Packet Loss (%) |
The maximum value of video packet loss during the call, in percentage. |
|
Video Latency (ms) |
The maximum value of video latency during the call, in milliseconds. |
|
Call ID |
Unique ID of the call. |
|
Local Session ID |
Unique local ID of the call. |
|
Remote Session ID |
Unique remote ID of the call. |
|
Location |
The location of the user is defined in the Control Hub. |
|
Country |
The country of the user is defined in the Control Hub. |
|
Connection Used |
Type of connection used to connect to the call. |
|
Local IP Address |
Local IP address of the user. IP addresses are partially masked to show 3 octets instead of 4 to preserve the personal identity of users. |
|
Audio Codec |
Audio media encoding and decoding format used during the call. |
|
Video Codec |
Video media encoding and decoding format used during the call. |
|
Path Optimization |
Path optimization is used during the call. The available path optimization types are:
|
|
Call Type |
The type of call that the user called with. Possible values are Webex Calling or Call on Webex. |
|
Video Duration |
The amount of time in seconds that the user turned on their video. |
|
Caller |
This field shows if the user is the one who initiated the call. The possible values are:
|
|
UA Version |
The Webex Calling or Webex App desktop version of the user. |
Calling Engagement report
This report shows data for the call legs that users made or received with the Webex App using Call on Webex and the Webex Calling app.
|
Column name |
Description |
|---|---|
|
Name |
The first and last name of the user. |
|
|
The email address of the user. |
|
Start Time |
The time (GMT) of when the call is made. |
|
Duration |
The amount of time in seconds that the call lasted. |
|
Video Duration |
The amount of time in seconds that the user turned on their video. |
|
Endpoint |
The device or app that the user made or received the call with. |
|
Call ID |
The unique ID of the call. |
|
Caller |
This field shows if the user is the one who initiated the call. The possible values are:
|
Calling Quality report
This report shows data for the quality of calls made or received by users with the Webex Calling and Webex desktop apps.
The quality of calls made or received from the Webex App and cloud-registered devices aren't captured in this report.
|
Column name |
Description |
|---|---|
|
Name |
The first and last name of the user. |
|
|
The email address of the user. |
|
Start Time |
The time (GMT) of when the call is made. |
|
Duration |
The amount of time in minutes that the call lasted. |
|
Endpoint |
The device or app that the user made or received the call with. |
|
Audio Packet Loss |
The average receiving audio packet loss in percentage. |
|
Audio Latency |
The average audio round-trip delay in milliseconds. |
|
Audio Jitter |
The average jitter in milliseconds. |
|
Video Packet Loss |
The average receiving video packet loss in percentage. |
|
Video Latency |
The average video round-trip delay in milliseconds. |
|
UA Version |
The Webex Calling or Webex desktop app version of the user. |
|
Call ID |
The unique ID of the call. |
Call Queue Stats report
This report shows details of call queues that have been set up in your organization. You can use this report to see the number of incoming calls to call queues and the status of those calls.
| Column name | Description |
|---|---|
| Call Queue | Name of the call queue. |
| Location | Location assigned to the call queue. |
| Phone No. | A phone number assigned to the call queue. |
| Extension | Extension number assigned to the call queue. |
| Total Hold Time | Total time that calls are place on hold by agents. |
| Avg Hold Time | Average time that calls were placed on hold by agents. |
| Total Talk Time | Total time that agents were actively talking on calls. |
| Avg Talk Time | Average time that agents were actively talking on calls. |
| Total Handle Time | Total time an agent spends on a call from a queue, including ring time. This is recorded when the agent ends or transfers the call. |
| Avg Handle Time | Average time that agents spent handling calls. |
| Total Wait Time | Total time that callers spent waiting for the next available agent to answer the call. |
| Avg Wait Time | Average time that callers spent waiting for the next available agent to answer the call. |
| Calls Answered | Number of calls answered by agents. |
| % Answered Calls | Percentage of calls answered by agents. |
| Calls Abandoned | The number of calls where the caller hung up or left a message before an agent became available. |
| % Abandoned Calls | Percentage of calls where the caller hung up or left a message before an agent became available. |
| Avg Abandoned Time | The average time where callers hung up or left a message before an agent became available. |
| Abandoned Time | Amount of time where callers hung up or left a message before an agent became available. |
| Total Calls | Total number of incoming calls. |
| Calls Overflowed | Number of calls that overflowed because the queue limit is met. This is the
same data as Overflow - Busy. |
| Calls Timed Out | The number of calls that overflowed because the wait time exceeded the maximum
limit. This is the same data as Overflow - Timed out. |
| Calls Transferred | Number of calls that were transferred out of the queue. |
| Avg No. of Agents Assigned | Average number of agents assigned to call queues. |
| Avg No. of Agents Handling Calls | Average number of agents that actively handled calls. |
Call Queue agent stats report
This report shows details of all the agents who are assigned to call queues in your organization. You can use this report to see which agent gets the most calls and information about their Calling stats.
| Column name | Description |
|---|---|
| Agent/Workspace Name/Virtual Line | Name of the agent, workspace, or virtual line. |
| Call Queue | Name of the call queue. |
| Location | Location assigned to the call queue. |
| Total Answered Calls | Number of calls that were presented to the agent and answered by them. |
| Bounced Calls | A number of calls that were presented to the agent but went unanswered. |
| Total Presented Calls | The number of inbound calls to the agent that were distributed by the call queue. |
| Total Talk Time | Total time that the agent spent actively talking on calls. |
| Avg Talk Time | Average time that the agent spent actively talking on calls. |
| Total Hold Time | Total time that the agent put calls on hold. |
| Avg Hold Time | Average time that the agent put calls on hold. |
| Total Handle Time | Total time an agent spends on a call from a queue, including ring time. This is recorded when the agent ends or transfers the call. |
| Avg Handle Time | Average time that agents spent handling calls. |
Auto-attendant stats summary
Provides details about calls routed to auto-attendants in your organization.
| Column name | Description |
|---|---|
| Auto-attendant | Name of the auto-attendant, as provisioned. |
| Ph. No. / Extn. | Extension assigned to the auto-attendant. |
| Location | Location of the auto-attendant, as provisioned. |
| Total calls | Total number of incoming calls routed to the auto-attendant. This includes all calls that successfully reach the auto-attendant and forced forward calls. |
| Answered | Number of calls answered by agents, users through call forwarding, or voicemails. Calls transferred to call services are counted as answered calls. |
| Unanswered | A number of calls that were routed to agents or users through call forwarding but weren’t answered. |
| Busy | A number of calls where callers reached a busy tone. |
| Others | The number of calls that had a status other than answered, unanswered, or busy.
For example:
|
| % answered | Percentage of calls answered by agents. |
| Total duration | Total time that callers were on the line with the auto-attendant when first answered until the call is routed or terminated. |
Auto-attendant business hours key details
Provides details about calls routed to auto-attendants during your business regular hours.
| Column name | Description |
|---|---|
| Auto-attendant | Name of the auto-attendant, as provisioned. |
| Key pressed | The key option pressed by callers on the keypad |
| Ph. No. / Extn. | Extension assigned to the auto-attendant. |
| Location | Location of the auto-attendant, as provisioned. |
| Total calls | Total number of incoming calls routed to the auto-attendant. This includes all calls that successfully reach the auto-attendant and forced forward calls. |
| Answered | Number of calls answered by agents, users through call forwarding, or voicemails. Calls transferred to call services are counted as answered calls. |
| Unanswered | A number of calls that were routed to agents or users through call forwarding but weren’t answered. |
| Busy | A number of calls where callers reached a busy tone. |
| Others | The number of calls that had a status other than answered, unanswered, or busy.
For example:
|
| % answered | Percentage of calls answered by agents. |
| Duration | Length of time that callers were on the line with the auto-attendant. |
| Destination | The phone number of the terminating call detail record. |
| Key menu | The key menu option assigned to the key pressed on the keypad. |
| Key description | The description for the key option pressed by callers on the keypad. |
Auto-attendant after hours key details
Provides details about calls routed to auto-attendants after your business regular hours.
| Column Name | Description |
|---|---|
| Auto-attendant | Name of the auto-attendant, as provisioned. |
| Key pressed | The key option pressed by callers on the keypad |
| Ph. No. / Extn. | Extension assigned to the auto-attendant. |
| Location | Location of the auto-attendant, as provisioned. |
| Total calls | Total number of incoming calls routed to the auto-attendant. This includes all calls that successfully reach the auto-attendant and forced forward calls. |
| Answered | Number of calls answered by agents, users through call forwarding, or voicemails. Calls transferred to call services are counted as answered calls. |
| Unanswered | A number of calls that were routed to agents or users through call forwarding but weren’t answered. |
| Busy | A number of calls where callers reached a busy tone. |
| Others | The number of calls that had a status other than answered, unanswered, or busy.
For example:
|
| % answered | Percentage of calls answered by agents. |
| Duration | Length of time that callers were on the line with the auto-attendant. |
| Destination | The phone number of the terminating call detail record. |
| Key menu | The key menu option is assigned to the key pressed on the keypad. |
| Key description | The description for the key option pressed by callers on the keypad. |
Hunt Group Stats
Provides details about call activities for a hunt group.
| Column name | Description |
|---|---|
| Hunt Group | Name of the hunt group. |
| Location | Location assigned to the hunt group. |
| Phone No | Phone number assigned to the hunt group. |
| Extension | Extension number assigned to the hunt group. |
| Total Talk Mins | Total number of minutes that hunt group members were actively talking on calls. |
| Avg Talk Mins | Average number of minutes that hunt group members were actively talking on calls. |
| Total Handle Mins | Total number of minutes that hunt group members spent handling calls. Handle minutes are calculated as Total Talk Mins + Total Hold Mins = Total Handle Mins. |
| Avg Handle Mins | Average number of minutes that hunt group members spent handling calls. |
| Total Wait Mins | Total number of minutes that callers spent waiting for the next available hunt group member to answer the call. |
| Avg Wait Mins | Average number of minutes that callers spent waiting for the next available hunt group member to answer the call. |
| Total Abandoned Mins | Number of calls answered by agents. |
| Avg Abandoned Mins | The total number of minutes where callers hung up or left a message before a hunt group member became available. |
| Calls Answered | The average number of minutes where callers hung up or left a message before a hunt group member became available. |
| % Calls Answered | Percentage of calls answered by hunt group members. |
| Calls Abandoned | The number of calls where the caller hung up or left a message before a hunt group member became available. |
| % Calls Abandoned | Percentage of calls where the caller hung up or left a message before an agent became available. |
| Avg No. of Agents Handling Calls | Average number of agents that actively handled calls. |
Hunt Group Agent Stats
Provides details of all the agents who are assigned to hunt groups in your organization. You can use this report to see which agents get the most calls and information about their Calling stats.
| Column name | Description |
|---|---|
| Agent/Workspace/Virtual Line Name | Name of the agent, workspace, or virtual line. |
| Hunt Group | Name of the hunt group. |
| Location | Location assigned to the hunt group. |
| Total Answered Calls | Total number of calls that were presented to hunt group members and answered by them. |
| Total Presented Calls | Total number of calls that were presented to hunt group members. |
| Total Talk Mins | Total number of minutes that hunt group members spent actively talking on calls. |
| Avg Talk Mins | Average number of minutes that hunt group members spent actively talking on calls. |
| Total Handle Mins | Total number of minutes that hunt group members spent handling calls. Handle minutes are calculated as Total Talk Mins + Total Hold Mins = Total Handle Mins. |
| Avg Handle Mins | Average number of minutes that hunt group members spent handling calls. |
Calling Connectivity report
The Webex Calling Connectivity Report allows the administrators to determine the Calling connectivity status of users and endpoints within their organization. Webex Calling Connectivity can be understood as the ability of make or receive calls for a Webex Calling user across the various Webex managed endpoints.
This report shows the Webex Calling connectivity status for the users in their organizations across various endpoints, such as Webex App, Desk Phones, RoomOS across Primary/shared lines and hot-desking.
The organization administrators can verify the report to understand how many users are connected to Webex Calling using SIP and Push Notification Status events over a period of time. This helps to track and measure the adoption and success of new deployments, especially for soft-client-only locations without needing to contact Cisco Technical Assistance Center (TAC).
| Column name | Description |
|---|---|
|
Account name |
Display the name of the user or account. |
|
Account type |
The type of the account, such as user, workspace, or virtual. |
|
|
Email address of the user or account. |
|
Account ID |
The Account ID comprises a Universally Unique Identifier (UUID) for each user participating in a call. |
|
Location |
Webex Calling location of the user or account provisioned in Control Hub. |
|
Country |
Country where the user's location is provisioned. |
|
Connected endpoint |
Endpoint through which the account is connected to Webex Calling. |
|
Last calling registration | Date and time of the last calling connectivity. |
|
Device ID |
Indicates the MAC address of the hard device, such as desk phones and RoomOS devices. |
|
Event type |
Type of the event, such as SIP registration or push notification status events. |
|
Primary connectivity |
This indicates if the Calling connectivity was through a primary line on an endpoint. |
|
Shared connectivity |
This indicates if the Calling connectivity was through a shared line on an endpoint. |
|
Hot desking connectivity |
This indicates if the calling connectivity was through a Hot-desking device. |
-
This report isn’t for real-time data and the report reflects data with a delay of up to 24 hours.
-
If a user has multiple endpoints, each one is listed as a separate entry.
- Only the most recent connectivity update per device is stored.
- For Webex Apps on mobile or tablet (android/iOS), connectivity is determined using either the push notification status events or SIP registration status events. Frequency of push notification status events may vary from once a day to a few days or more based on multiple factors including the notification configuration of the mobile OS. So, it may happen that the mobile Webex Apps might still be Calling connected even though the push notification status event update happened a few days ago. SIP-registration events only happen at the time of making or receiving a call.
- The latest event from either the push notification status and SIP registration will be updated in the report for the mobile and tablet-based Webex Clients.
- SIP Registration events for the rest of the device families (Desk Phones, RoomOS, Desktop based Webex Clients happen more frequently and without them having to make or receive a call).
Limitations
-
Users connected on the Webex Go (eSim) and DX80 devices aren’t SIP registered. Therefore, the system doesn’t count those users as Calling Connected.
-
This is a status report and provides the latest Calling connectivity status for Webex users across endpoints. Hence displaying the connectivity status on a custom range of time-period isn’t supported.
-
When users move across locations, the report shows their location based on where they are at the time the report is created. The data can’t be segregated per location specific.
-
For Webex App soft clients, user–endpoint records may be aggregated at the level of endpoint family, such as Webex App Desktop (Windows/MacOS), Webex App Mobile (Android/iOS), and Webex App Tablet (Android/iOS).
For example, if a user has two mobile endpoints (Android and iOS) with the Webex App and Calling connectivity on both, these endpoints are combined into a single record. The report then includes only the endpoint with the latest Calling connectivity at the time of report generation.
Telephone Number report
This report allows you to download a consolidated view of the entire current inventory of Webex Calling telephone numbers and extensions for your organization. As this is a point in time inventory report, time ranges can't be specified.
Changes made to phone numbers or extensions may take up to 24 hours to be reflected in the report.
| Column name | Description |
|---|---|
| Location | The name of the location in the customer organization that the phone number belongs to. |
| Country | Country of the location in the customer organization that the phone number belongs to. |
| Phone Number | Phone Number (this field is empty for extensions). |
| Extension | Extension (this field is empty for phone numbers). |
| Active | Status of the phone number. Possible values are:
|
| User Type | The type of user that the phone number is assigned to. For example, "People," "Auto Attendant," "Virtual Line," and so on. This field is empty for unassigned phone numbers. |
| Number Type |
This field is “Primary” or “Secondary” depending on whether the phone number is the primary or secondary number for the user. This field is empty for extensions or unassigned phone numbers. |
| The email address of the user that the phone number is assigned to. | |
| User UUID |
This field contains the UUID of the user that the phone number or extension is assigned to. For phone numbers with the user type of “People,” this field contains the UUID of the user. For phone numbers with the user type of “Auto Attendant,” this field contains the UUID of the auto attendant, and so on. This field is empty for unassigned phone numbers. |
AI Receptionist report
This report is intended to help you understand AI Receptionist usage. It isn't intended for billing or billing reconciliation.
The AI Receptionist report helps administrators understand how AI Receptionist is handling calls across the organization. Use the report to see whether callers are reaching AI Receptionist, whether calls are being answered, how often calls are transferred, and whether transfers succeed.
The report is useful when you want to evaluate front desk automation, compare performance across receptionists or locations, and identify configuration improvements. For example, a low intent-transfer rate may indicate that intents need clearer descriptions, while a low transfer success rate may indicate that transfer destinations, operating hours, or routing configuration need review.
Administrators can generate the Calling AI Receptionist Stats report on demand or schedule it from Control Hub.
Total AI Receptionist Calls is the number of calls received by AI
Receptionist. If the same call is routed back to AI Receptionist, it’s counted as another
call. This count also includes calls made to AI Receptionist when AI Receptionist was
unavailable or when the call was blocked.
Across [n] AI Receptionists is the number of unique AI Receptionists
that received calls during the selected date range.
What you can infer from this report:
- A higher percentage of calls directly handled by AI Receptionist compared to the total calls presented indicates that AI Receptionist is effectively managing a larger portion of the incoming calls, demonstrating its efficiency in handling customer interactions.
- High default transfers can indicate that caller requests are not covered by the knowledge base or by configured intents.
- Low intent-transfer usage can indicate that intent names or descriptions need to be clearer or that callers are asking for services that are not configured as intents.
- Low transfer success rate can indicate a problem with transfer destinations, operating hours, external number permissions, or downstream routing.
- Increasing total talk time or average talk time can indicate higher caller demand, unclear knowledge base content, or callers needing more assistance before transfer.
| KPI | Description | Format | Minimum/maximum value | Example |
|---|---|---|---|---|
| AI Receptionist | Name of the AI Receptionist. Use this to identify which receptionist handled the calls. | Text | Not applicable; based on configured name. | Shine Healthcare Clinic |
| Phone Number | Primary phone number assigned to the AI Receptionist. | Phone number, usually E.164 format | Not applicable; based on assigned number. | +14085550100 |
| Extension | Extension assigned to the AI Receptionist, if configured. | Number string | Not applicable; based on assigned extension. | 3991 |
| Location | Location associated with the AI Receptionist. Use this to compare activity by site. | Text | Not applicable; based on configured location. | San Jose |
| Total Presented Calls | Total number of presented calls that AI Receptionist answered. | Whole number | Minimum 0; maximum can't exceed Calls Presented for the selected report scope. | 1250 |
|
Total directly handled calls |
The total number of calls presented that were directly handled by the AI Receptionist. This means that the calls terminated at AI Receptionist without any transfers and is a key indicator of efficiency. | Whole number | Minimum 0; no fixed maximum. | 1195 |
| Total Transfers Attempted | Total answered calls where AI Receptionist attempted a transfer. This includes intent transfers and default transfers. | Whole number | Minimum 0; maximum can't exceed Calls Answered for the selected report scope. | 640 |
| Total Successful Transfers | Total calls that were successfully transferred. This includes successful intent transfers and successful default transfers. | Whole number | Minimum 0; maximum can't exceed Transfers Attempted. | 602 |
| Percentage Transfer Attempt | Percentage of answered calls where AI Receptionist attempted a transfer. Use this to understand how often callers need a live destination. | Percentage | 0% to 100% | 53.6% |
| Percentage Transfer Success | Percentage of attempted transfers that completed successfully. Use this to check whether transfer destinations and routing are working as expected. | Percentage | 0% to 100% | 94.1% |
| Attempted Intent Transfers | Total calls where AI Receptionist attempted a transfer based on a matched intent. Use this to measure intent usage. | Whole number | Minimum 0; maximum can't exceed Transfers Attempted. | 420 |
| Successful Intent Transfers | Total calls successfully transferred based on a matched intent. Use this to understand whether intent routing is successful. | Whole number | Minimum 0; maximum can't exceed Intent Transfers Attempted. | 398 |
| Attempted Default Transfers | Total calls where AI Receptionist attempted a transfer by using the default action. Use this to understand fallback transfer usage. | Whole number | Minimum 0; maximum can't exceed Transfers Attempted. | 220 |
| Successful Default Transfers | Total calls successfully transferred by using the default action. Use this to validate fallback routing. | Whole number | Minimum 0; maximum can't exceed Default Transfers Attempted. | 204 |
| Total Talk Time | Total time AI Receptionist spent talking to callers. Use this to understand total handled conversation time. | The time format is in HH:MM:SS. | Minimum 0; no fixed maximum. | 14:35:30 |
| Average Talk Time | Average time AI Receptionist spent talking to callers per answered call. Use this to understand whether calls are brief, lengthy, or changing over time. | The time format is in HH:MM:SS. | Minimum 0; no fixed maximum. | 00:01:48 |
Business Texting Usage Details report
This report provides detailed records of inbound and outbound business texts within the organization. Each row represents one text message. Report data is shown from the perspective of the Webex Calling user or supported account associated with the business texting number.
Data for this report is only available for the previous day, or 24 hours later.
| Column name | Description |
|---|---|
| Org ID | Unique identifier of the organization. |
| Originating number | Phone number where the text message originated. |
| Terminating number | Phone number where the text message terminated. |
| Direction | Direction of the message from the perspective of the Webex Calling user. Values are inbound or outbound. |
| Timestamp |
Date and time when the message was sent or received, displayed in the data time zone selected while generating the report. For the originating number, this represents the sent time. For the terminating number, this represents the received time. |
| User UUID |
Unique identifier of the user or account associated with the message. For inbound messages, the data is mapped based on For outbound messages, the data is mapped as User or location values may be blank if the corresponding user or location has been deleted. |
| User name | Display name of the user or account associated with the message. User or location values may be blank if the corresponding user or location has been deleted. |
| User type | Type of user or account. Possible values are:
User or location values may be blank if the corresponding user or location has been deleted. |
| Location ID |
Unique identifier of the provisioned location for the calling number. For inbound messages, this is the location of the terminating number. For outbound messages, this is the location of the originating number. User or location values may be blank if the corresponding user or location has been deleted. |
| Location | Name of the provisioned location for the calling number. User or location values may be blank if the corresponding user or location has been deleted. |
| Message type | Type of message. Initially, this is SMS. |
| Message ID | Unique identifier for the individual message. |
| Conversation ID | Identifier for the conversation or space associated with the message. This can be used to group messages that belong to the same conversation. |
Voicemail Usage Stats report
The Voicemail Usage Stats report provides the latest Webex Calling voicemail status and usage stats for all voicemails within your organization.
You can use this report to:
-
Identify mailboxes with unread or saved messages.
-
Review mailbox storage consumption and mailbox storage type.
-
Find mailboxes that are locked because of multiple incorrect PIN attempts.
-
Check whether voicemail PINs are still using the default configuration or were updated.
-
Confirm whether recorded names and custom greetings are configured.
-
Check whether extended away greetings are active.
-
Review voicemail usage by mailbox entity, mailbox type, location, and country.
Some things to note when viewing this report:
-
Data for this report is only available for the previous day, or 24 hours later.
-
This is a status report that provides the latest stats for voicemail boxes across the customer organization.
-
The report is intended for operational monitoring and troubleshooting, not billing.
-
Some fields apply only to internal mailboxes or only to shared mailboxes.
-
Email address, mailbox name, mailbox number, and mailbox owner fields may contain customer-identifiable information.
| Column name | Description |
|---|---|
| Org ID |
Unique identifier of the organization. |
| Last known date |
Date and time when the report data for the record was last processed. |
| Mailbox name |
Name of the mailbox. The mailbox can belong to a user, professional workspace, virtual line, call queue, hunt group, auto attendant, or voicemail group. |
| Mailbox owner UUID |
Unique identifier of the mailbox owner or mailbox entity. |
| Mailbox number |
Phone number, direct inward dialing (DID), or extension assigned to the mailbox. |
| Mailbox location |
Location where the mailbox entity is configured. |
| Mailbox country |
Country of the location where the mailbox entity is configured. |
| Location ID |
Unique identifier of the location. |
| Mailbox entity |
Type of entity that owns the mailbox, such as a user, professional workspace, virtual line, call queue, hunt group, auto attendant, or voicemail group. |
| Mailbox type |
Type of mailbox, such as personal or shared. |
| Shared mailbox members |
Number of members or subscribers for shared mailbox entities. This field applies to shared mailboxes only. |
| Mailbox storage type |
Storage type configured for the mailbox, such as internal or external. |
| Mailbox storage email |
Email address configured for external mailbox storage. This field is populated when external storage is configured and the value is available. |
| Mailbox copy email |
When configured and available, email address where a mailbox copy is sent. |
| Mailbox lock status |
Indicates whether the mailbox is locked or unlocked. A mailbox can be locked because of multiple incorrect PIN attempts. |
| Mailbox storage capacity (mins) |
Mailbox storage capacity in minutes. |
| % Mailbox storage consumption |
Percentage of mailbox storage currently consumed. |
| Total messages |
Total number of voice messages in the mailbox. For internal mailboxes, this count includes fax messages. |
| Total new messages |
Total number of new messages in the mailbox. This field applies to internal mailboxes only. |
| Total saved messages |
Total number of saved messages in the mailbox. This field applies to internal mailboxes only. |
| Total fax messages |
Total number of fax messages in the mailbox. This count is included in the total message count and may also be included in new or saved message counts. |
| Oldest message date |
Date and time of the oldest message in the mailbox. |
| Most recent message date |
Date and time of the most recent message in the mailbox. |
| Last action performed |
Last voicemail action performed, such as read, saved, forwarded, deleted, or call back. |
| Last action date |
Date and time of when the last voicemail action was performed. |
| Configured PIN type |
Type of PIN configured for the mailbox, such as default or custom. |
| PIN last updated date |
Date and time of when the mailbox PIN was last updated. This includes first-time custom PIN setup and PIN reset. |
| Recorded name |
Indicates whether the recorded name for the voicemail entity is default or custom. |
| Extended away greeting status |
Indicates whether the extended away greeting is default or custom. |
| Configured busy greeting type |
Type of busy greeting configured for the mailbox, such as default or custom. |
| Configured no answer greeting type |
Type of no answer greeting configured for the mailbox, such as default or custom. |
This report shows detailed call history data. Use this information to view trends at a high level or drill down to specific call types, for understanding the calling behavior.
Emergency calls can be routed through a backup or Webex Calling emergency provider. For these calls, the routing and PSTN provider fields show the final route used for the call. Those fields might not show the PSTN provider that owns the originating number.
Pro pack users have access to 400 days of past data for this report. Standard users have access to 89 days of past data. The maximum date range that you can select each time you generate this report is 31 days.
The following table shows the detailed call records for all calls made using Webex Calling.
|
Column name |
Description |
|---|---|
|
Start time |
This is the start time of the call, in UTC. The answer time may be slightly after this value. |
|
Answer time |
Displays the time when the call is answered in UTC. |
|
Duration |
The length of the call, in seconds. |
|
Calling number |
For incoming calls, it's the telephone number of the calling party. For outgoing calls, it's the telephone number of the user. |
|
Called number |
For incoming calls, it's the telephone number of the user. For outgoing calls, it's the telephone number of the called party. |
|
User |
Represents the display name for the type of user who made or received the call. Example: Display name for real or virtual user types like (User, Workspace, Virtual line, Auto attendant, Call queue, and so on). |
|
Calling line ID |
For incoming calls, it's the calling line ID of the calling party. For outgoing calls, it's the calling line ID of the user. |
|
Called line ID |
For incoming calls, it's the calling line ID of the user. For outgoing calls, it's the calling line ID of the called party. |
|
Correlation ID |
Correlation ID to tie together multiple call legs of the same call session. |
|
Location |
The Webex Calling location of the user for this record. |
|
Inbound trunk |
Inbound trunk may be present in the Originating and Terminating records.
|
|
Outbound trunk |
Outbound trunk may be presented in Originating and Terminating records. For emergency calls, identifies the outbound trunk used for the final route. This trunk might belong to the Webex Calling emergency provider rather than the provider that owns the originating number.
|
|
Route group |
If present, this field's only reported in Originating records. Route group identifies the route group used for outbound calls routed through a route group to premises-based PSTN or an on-prem deployment integrated with Webex Calling (dial plan or unknown extension). For emergency calls, this field reflects the route group used for the final route, when applicable. |
|
Route list calls overage |
This field is reported whenever an off-net route list call is made or received that exceeds the Route List Calls license volume for the organization. The value indicates the number of bursting calls (calls over the licensed volume) at the time the call was made or received. For example: 2 |
|
Direction |
Whether the call is inbound or outbound. The possible values are:
|
|
Call type |
Type of call. Examples:
Whenever the PSTN calls are routed using a dial plan pattern, this causes a miscategorization of the call type. In such cases, it’s not considered as a PSTN call. Example: Using TEHO to route the call to the right country and then using the PSTN connection for the local cluster in that country. |
|
Client type |
The type of client that the user (creating this record) is using to make or receive the call. Examples:
|
|
Client Version |
The version of the client that the user (of this CDR) is using to make or receive the call. |
|
Sub client type |
If the call is TO or FROM a mobile phone using Webex Go, the |
|
OS type |
The operating system that the app is running on, if available. |
|
Device Mac |
The MAC address of the device, if known. |
|
Model |
The device model type the user is using to make or receive the call. Examples:
|
|
Answered |
Indicates whether the particular call leg is answered or not. Examples:
|
|
International country |
The country of the dialed number. This field is only displayed for international calls. |
|
Original reason |
Call redirection reason for the original called number. Examples:
|
|
Related reason |
Indicates a trigger that led to a change in the call presence. The trigger could be for this particular call or redirected through a different call. Examples:
|
|
Redirect reason |
Call Redirection Reason for the redirecting number. Examples:
|
|
Site main number |
The main number for the user's site where the call is made or received. |
|
Site timezone |
Default setting—Displays the Site/Location's time zone offset value between a particular time zone and UTC in minutes. If the calling timezone is modified from Control Hub, then it displays the particular User/Service calling timezone-offset value. |
|
User type |
The type of user (user or workspace) that made or received the call. Examples:
|
|
Call ID |
SIP Call ID used to identify the call. You can share the Call ID with Cisco TAC to help them pinpoint a call if necessary. |
|
Local SessionID |
Each call consists of four UUIDs known as Local Session ID, Remote Session ID, Final Local Session ID, and Final Remote Session ID. The Remote SessionID is generated from the Terminating user agent. The existing Local and Remote Session ID fields provide the initial session ID values of the call. These session IDs act as a global call identifier and helps with tracking even when midcall transfer or other feature interaction occurs that involves Webex Calling and Remote call control, such as Unified CM using a Local Gateway. |
|
Remote SessionID | |
|
User UUID |
A unique identifier for the user associated with the call. This is a unique identifier across Cisco products. |
|
Org UUID |
A unique identifier for the organization that called. This is a unique identifier across Cisco. |
|
Report ID |
A unique ID for this particular record. This can be used when processing records to aid in deduplication. |
|
Department ID |
A unique identifier for the user's department name. |
|
Site UUID |
A unique identifier for the site associated with the call. It's unique across Cisco products. |
|
Releasing party |
Indicates which party released the call first. The possible values are:
|
|
Redirecting number |
When the call is redirected one or more times, this field reports the last redirecting number. It helps to identify who last redirected the call. It only applies to call scenarios such as transfer, call forwarded calls, simultaneous rings and so on. |
|
Transfer related call ID |
Transfer-related call ID is used as a call identifier of the other call leg that's involved in the transfer. You can share this ID with Cisco TAC to help them pinpoint parties who are involved during a call transfer. |
|
Dialed digits |
The keypad digits as dialed by the user, before pretranslations. As a result, this field reports multiple call dial possibilities, such as:
When pretranslations have no effect, the dialed digits field contains the same data as the called number field. This field is only used for originating (outgoing) Calls and isn’t available for terminating (incoming) Calls. |
|
Authorization code |
The administrator creates the authorization code for a location or site for users to use. It's collected by the Account/Authorization Codes or Enhanced Outgoing Calling Plan services. |
|
Call transfer time |
Indicates the time at which the call transfer service is invoked during the call. The invocation time is shown using the UTC/GMT time zone. |
|
User number |
Represents the E.164 number of the user generating a CDR. If there’s no number assigned to the user, their extension number displays. |
|
Local call ID |
A unique identifier that’s used to correlate CDRs and call legs with each other. This ID is used with:
|
|
Remote call ID |
A unique identifier that’s used to correlate CDRs and call legs with each other.
This ID is used with |
|
Network call ID |
A unique identifier that shows if other CDRs are in the same call leg. Two CDRs
belong in the same call leg if they have the same |
|
Related call ID |
Call identifier of a different call that is created by this call because of a
service activation. The value is the same as the |
|
Call outcome |
Identifies whether the call is set up or disconnected normally. Possible values are:
You can find more information in the Call outcome reason field. |
|
Call outcome reason |
Additional information about the Call outcome is returned. Possible reasons are:
|
| Final Local Session ID |
Each call consists of four UUIDs known as Local Session ID, Remote Session ID, Final Local Session ID, and Final Remote Session ID.
The existing Local and Remote Session ID fields provide the initial session ID values, whereas the Final Local and Remote Session IDs bring a more complete picture of the call. These session IDs act as a global call identifier and helps with tracking even when midcall transfer or other feature interaction occurs that involves Webex Calling and Remote call control, such as Unified CM using a Local Gateway. |
| Final Remote Session ID | |
|
Answer indicator |
When a call is answered, this indicator identifies if the call is answered at a post-redirected location (such as voicemail or a call forward destination) rather than at the called service or user's phone number. Possible values are:
|
|
Ring duration |
The length of ringing before the call is answered or timed out, in seconds. |
|
Release time |
Indicates the time when the call is released by the system in UTC time. This time doesn’t always mean the call is released as sometimes refers to the time when either one caller hangs up (for example, Emergency/911 calls) Omit this field for long duration calls and use the Report time. |
|
Report time |
It’s same as the Release time usually and is generated only when the call ends. In error conditions, you observe the following changes:
|
|
PSTN Legal Entity |
Displays the regulated business entity registered for providing PSTN service in that particular country. The field is exclusively for Cisco Calling Plans. The regulated entity name in region and across regions can be different. |
|
PSTN Vendor Org ID |
Displays the Cisco Calling plan's org UUID. It’s unique across different regions For emergency calls, this can identify the Webex Calling emergency provider used for the final route. |
|
PSTN vendor name |
Displays the vendor’s name from whom the PSTN service is purchased for the respective country. For emergency calls, this can be the Webex Calling emergency provider rather than the provider that owns the originating number. |
|
PSTN Provider ID |
Represents an immutable Cisco-defined UUID attribute for a PSTN provider, which uniquely identifies the entity that has provided PSTN in that country. For emergency calls, this identifies the provider used for the final route. |
|
Caller ID number |
Displays the calling party's presentation number. It follows the applicable E.164 normalization and can appear in either E.164 or non-E.164 format. The number can be a direct line/extension, location number, or custom option from an organization.
|
|
External caller ID number |
It's only set when the Control Hub External caller ID phone number setting is either a location number or any other number from an organization. Also, it isn’t set when the Direct line/Ext option has been selected.
|
|
External customer ID |
This field is applicable only to Webex Wholesale Route-to-Market (RTM) customers. This feature allows tracking and correlating customer calls between Webex Calling and the Partner's system. This UUID is an identifier provided by the partner when provisioning a specific customer. |
|
Device owner UUID |
When calls are made using multiline or shared line options, it represents the unique identifier of the device owner (that is, accountable for). This field holds the value of the UUID contained in the Cisco Common Identity associated with a user. Example: If Alice has a device assigned, where multiline is configured or Bob and makes/receives a call from Bob's line, then Bob's CDR for the call will have Alice UUID as the device owner. Only set when the device owner is different than the owner of the device who made/received the call. |
|
Call Recording Platform Name |
Call recording platform name and the recording platform can be "DubberRecorder", "Webex", or "Unknown" if the call recording Platform Name couldn’t be fetched. Other supported vendors include Eleveo, ASCTech, MiaRec, and Imagicle. |
|
Call Recording Result |
The possible recorded media statuses are:
|
|
Call Recording Trigger |
This field indicates the user's recording mode for this call. The values for this field are:
|
|
Redirecting party UUID |
Whenever a call is redirected one or more times, this field indicates the unique identifier of the last redirecting party user or service (that is, accountable for) this CDR. This field holds the value of the UUID contained in the Cisco Common Identity associated with a user or service. |
|
Public Calling IP Address |
Indicates the public IP address of the device or application making a call in India locations. This field values are captured for all number types for India locations. |
|
Public Called IP Address |
Indicates the public IP address of the terminating device or application in India locations. This field values are captured for all number types for India locations. |
|
Original Called Party UUID |
When the call is redirected one or more times, this field represents the unique identifier of the first redirecting party. This might be a user, service, workspace, or virtual line that’s accountable for the CDRs. The field holds the value of the UUID contained in the Cisco Common Identity associated with a user, service, workspace, or virtual line. |
|
Recall Type |
This field indicates that the call is a call park recall. A call park recall occurs when a parked call isn’t retrieved within the provisioned recall time. In such cases, the system attempts to return the parked call to the user who originally parked it or to an alternate recall destination, which can only be a hunt group. The recall attempt may either succeed or fail, and if it fails, the parked call remains unretrieved. |
|
Hold Duration |
Indicates the total duration of call hold time in seconds. This is the floor value of the calculated hold duration. |
|
Auto Attendant Key Pressed |
Indicates the last key pressed value by the caller. |
|
Queue Type |
The field represents the type of call queue service. Example:
|
|
Answered Elsewhere |
This field is present in the terminating CDR when an incoming call is answered by a different user, workspace, virtual line, or service. Example: Set to Answered Elsewhere = Yes, for a Hunt Group agent's call when simultaneous routing is in use and another agent answers the call. |
|
Caller Reputation Score |
This field contains the score received from the caller reputation provider. The score ranges from 0.0 to 5.0. If the provider doesn’t send a score, the system omits this field. |
|
Caller Reputation Service Result |
This field records the outcome of the Caller Reputation Service and appears only in terminating CDRs. The field can contain the following values:
|
|
Caller Reputation Score Reason |
|
|
Interaction ID |
An Interaction ID is a unique identifier that associates CDRs that are part of the same service interaction, such as consultative calls and transfers. It is a service-interaction correlation mechanism, not a universal call-chain identifier. In complex or service-integrated call flows, related CDRs may have different Interaction IDs, depending on when the interaction is established or updated.
|
|
WxCC consult merge status |
This field specifies whether Webex Contact Center (WxCC) has performed a transfer or conference operation on a consultative call, indicating that the consulted party was connected to the customer call.
|
|
ELIN |
The Emergency Location Identification Number (ELIN) is used for the emergency call or an inbound callback. This number can be either an ELIN from the location's pool (numbers the customer configured as ELINs), or the workspace's own number which was used as ECBN for the emergency call and treated as an ELIN. |
|
Emergency number source |
Indicates the source of the number used for an emergency call or emergency callback. The field can contain the following values:
|
|
AI Agent ID |
Unique identification of the AI agent. |
|
Transfer type context |
This field provides additional context for the transfer type. For example,
|
|
Answer reason |
Specifies how the call was answered. This field displays |
Administrators can view custom templates with predefined filters on the Detailed Call History page. These customizable columns and filters help tailor reports to your specific needs and quickly find relevant data.
Previously, administrators had to download the entire report and manually filter it to find specific data. Custom templates now reduce processing time, simplify data analysis, and improve efficiency for both administrators and the reporting framework.
The following columns and options are available in Customize Template:
| Mandatory columns | Start time, Calling number, Called number, User, Location, Correlation ID, Direction, Call type, International country, Site timezone, Call outcome, Report time, User type, Report ID |
| Filter options | Location, Call type, International country, Answered indicator, User type, Client type |
For more information about a customize template, see custom template.
Final local and remote session ID example:
Call transfer with consultation:
- Alice calls Bob.
- Bob answers the call.
- Bob then does a consult transfer to Carol.
- Alice and Carol talk.
The following table shows how the local and final session IDs for Alice, Bob, and Carol differ (in bold) when a call transfer happens.
| Detailed call history record (CDR) | Local SessionID | Remote SessionID | Final localsessionID | Final remote sessionID |
|---|---|---|---|---|
| Alice Originating | X | Y | X | W |
| Bob Terminating | Y | X | W | X |
| Bob Originating | Z | W | X | W |
| Carol Terminating | W | Z | W | X |
Answer indicator with multiple redirections example:
- Alice calls Bob.
- Bob enabled a Call Forward Always option to Carol’s number.
- Carol enabled a Call Forward Busy option to Dave’s number.
- Dave finally attends the call.
- Alice and Dave talk.
The following table shows what the record looks like for the given example:
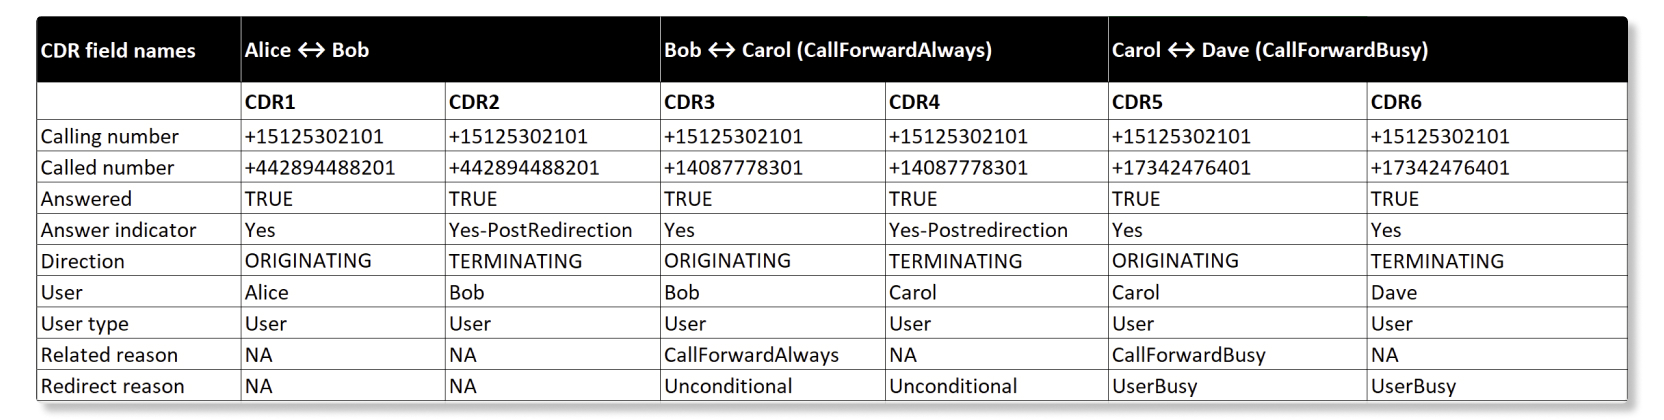
The original called party here’s Bob. But, as the call is answered elsewhere as both Bob
and Carol had redirections, their Terminating detailed call history records have Answer
Indicator = Yes-Postredirection.
Point-to-Point call:
-
Alice calls Bob.
-
Bob answers the call.
-
Either party ends the call.
Webex Calling generates two CDR data. The following table explains the CDR field names and data representations (CDR1, CDR2)
| CDR field names | Alice ↔ Bob call leg | |
|---|---|---|
| CDR1 | CDR2 | |
| Direction |
ORIGINATING
|
TERMINATING
|
| Answered |
TRUE
|
TRUE
|
| Calling number | +12814659802 | +442030577002 |
| Called number | +12814659802 | +442030577002 |
| Dialed digits | 77002 | NA |
| User | Alice | Bob |
| Calling line ID | NA | Alice |
| Called line ID | Bob | NA |
| Called ID | SSE064225663310323-826219063@10.71.100.219 | BW064226180310323-1351546003@10.21.1.45 |
| User type | User | User |
| Correlation ID | 9d52512d-0e59-4cb6-9de6-bda7d5b1185e | 9d52512d-0e59-4cb6-9de6-bda7d5b1185e |
| Local SessionID | b6230eee00105000a000e069ba481bcd | d0bcbad800105000a000e069ba481ba6 |
| Remote SessionID | d0bcbad800105000a000e069ba481ba6 | b6230eee00105000a000e069ba481bcd |
-
Alice’s Originating record (CDR1) would be User = Alice, Called line ID = Bob.
-
Bob’s Terminating record (CDR2) would be User = Bob, Calling line ID = Alice.
-
Correlation ID remains the same for both Alice and Bob.
-
Alice’s Local Session ID = Bob’s Remote Session ID AND
-
Bob’s Local Session ID = Alice’s Remote Session ID.
Webex Calling generates Originating CDR with Alice's UUID in the Local Session ID field and Bob's UUID in the Remote Session ID field. Webex Calling generates Terminating CDR with Bob's UUID in the Local Session ID field and Alice's UUID in the Remote Session ID field.
PSTN call to a Webex Calling user:
-
Alice calls Bob. (Alice is the PSTN caller and Bob is a Webex Calling user).
-
Bob answers the call.
-
Either party ends the call.
Webex Calling generates only one CDR record for Bob (CDR1=Terminating).
Alice = PSTN Caller (Originating) don’t have any CDR entries.
| CDR field names | No CDRs created for Alice PSTN caller | CDR 1 for Bob Webex Calling registered user |
|---|---|---|
| Direction | - |
TERMINATING
|
| Answered | - |
TRUE
|
| Calling number | - | +91638076xxxx |
| Called number | - | +1346298xxxx |
| Dialed digits | - | NA |
| User | - | NA |
| Calling line ID | - | NA |
| Called line ID | - | NA |
| Called ID | - | BW101135692160523343591672@10.155.7.148 |
| User type | - | User |
| Related reason | - | NA |
| Redirect reason | - | NA |
| Redirecting number | - | NA |
| Correlation ID | - | e156cd56-f3c9-4455-bea6-174ac975cfec |
| Local SessionID | - | 0816529e00105000a0000242be17dcaa |
| Remote SessionID | - | NA |
Blind Transfer Call:
Blind or unattended transfer allows you to transfer calls to an alternate extension or phone number without waiting for an answer or confirming the availability of the receiving party.
-
Alice calls Bob.
-
Bob blind transfers the call to Carol. Alice goes on hold.
-
Carol answers the call.
-
Bob clears down.
-
Alice and Carol talk and either party ends the call.
Webex Calling generates four CDR records. The following table explains the CDR field names and data representations (CDR1 to CDR4)
| CDR field names | Alice ↔ Bob call leg | Alice ↔ Carol call leg (post blind transfer) | ||
|---|---|---|---|---|
| CDR1 | CDR2 | CDR3 | CDR4 | |
| Direction |
ORIGINATING
|
TERMINATING
|
ORIGINATING
|
TERMINATING
|
| Answered |
TRUE
|
TRUE
|
TRUE
|
TRUE
|
| Calling number | +12814659802 | +12814659802 | +12814659802 | +12814659802 |
| Called number | +442030577002 | +442030577002 | +35391111632 | +35391111632 |
| Dialed digits | 77002 | NA | 11632 | NA |
| User | Alice | Bob | Bob | Carol |
| Calling line ID | NA | Alice | NA | Alice |
| Called line ID | Bob | NA | Carol | NA |
| Call ID | SSE06265895710052371 1826737@10.21.0.147 | BW062659522100523 2103886723@10.21.1.45 | BW06265952210052 32103886723@10.21.1.45 | BW062855359100523- 1346020832@10.21.1.45 |
| User type | User | User | User | User |
| Related reason | NA | Deflection | Deflection | NA |
| Redirect reason | NA | NA | Deflection | Deflection |
| Redirecting number | NA | NA | +442030577002 | +442030577002 |
| Transfer related call ID | NA | 417887153:0A | 417887153:0 | NA |
| Correlation ID | 3631b2a8-a7ba- 414b-8737-46dd30289cd6 | 3631b2a8-a7ba-414b- 8737-46dd30289cd6 | 3631b2a8-a7ba-414b- 8737-46dd30289cd6 | 3631b2a8-a7ba-414b -8737-46dd30289cd6 |
| Local SessionID | fb8ed91e00105000a 000e069ba481bcd | 2247175900105000a 000e069ba481ba6 | fb8ed91e00105000a 000e069ba481bcd | e54d9c6300105000a 000c4c603f1c9e8 |
| Remote SessionID | 2247175900105000a0 00e069ba481ba6 | fb8ed91e00105000a 000e069ba481bcd | e54d9c6300105000a 000c4c603f1c9e8 | fb8ed91e00105000a 000e069ba481bcd |
- Redirecting number = Bob’s number who did the blind transfer (CDR3, CDR4).
- Related reason = Deflection on CDR2. CDR3 indicates that it’s a blind transfer.
- The transfer related
Call IDprovides the call identifier of the other call involved in the transfer, populated only on CDR2 and CDR3. -
Correlation IDremains the same for all four CDR call legs (CDR1 through CDR4). -
Call IDfor CDR2 and CDR3 is unique. - For Alice ↔ Bob call leg, Alice’s
Local Session ID= Bob’sRemote Session ID. Bob’sLocal Session ID= Alice’sRemote Session ID. - Post blind transfer, Alice’s
Local Session IDis retained and propagates to Alice ↔ Carol’s call leg. Alice’sLocal Session ID= Carol’sRemote Session ID.
Call Park and Retrieval:
-
Alice called Bob and talked.
-
Bob parks the call to Carol’s extension and hangs up.
-
Carol Unparks the call using the Unpark option or by dialing the FAC *88 <extension where the call got parked> and retrieves the call.
-
Alice and Carol talk and either party ends the call.
Webex Calling generates four CDR records. The following table explains the CDR field names and data representations (CDR1 to CDR4)
| CDR field names | Alice ↔ Bob call leg | Bob parking the call | Carol unpark / retrieving parked call | |
|---|---|---|---|---|
| CDR1 | CDR2 | CDR3 | CDR4 | |
| Direction |
ORIGINATING
|
TERMINATING
|
ORIGINATING
|
ORIGINATING
|
| Answered |
TRUE
|
TRUE
|
FALSE
|
TRUE
|
| Calling number | +12814659802 | +12814659802 | +442030577002 | +35391111632 |
| Called number | +442030577002 | +442030577002 | *6811632 | *8811632 |
| Dialed number | 7702 | NA | *6811632 | *8811632 |
| User | Alice | Bob | Bob | Carol |
| Calling line ID | NA | Alice | NA | NA |
| Called line ID | Bob | NA | NA | NA |
| Call ID | SSE114440280110523-750048880@10.21.0.147 | BW114441007110523-418027819@10.21.1.45 | SSE114910189110523-234181851@10.23.0.4 | SSE114942533110523-1051117950@10.23.0.4 |
| User type | User | User | User | User |
| Related reason | NA | NA |
CallPark
|
CallParkRetrieve
|
| Redirect reason | NA | NA | NA | NA |
| Redirecting number | NA | NA | NA | NA |
| Transfer related call ID | NA | NA | NA | NA |
| Correlation ID | 6a7156c8-fe9a-41bf- 8790-73cdf58c5f95 | 6a7156c8-fe9a-41bf- 8790-73cdf58c5f95 | a6ccd315-99ad-42f7- 88d7-01a7f4a40699 | 1a4be593-5329-47ce- 9972-367a7c5452fd |
| Local Session ID | 6313d03900105000a 000e069ba481bcd | b7f18c4a00105000 a000e069ba481ba6 | b7f18c4a00105000 a000e069ba481ba6 | 323ebde800105000 a000c4c603f1c9e8 |
| Remote Session ID | b7f18c4a00105000a 000e069ba481ba6 | 6313d03900105000a 000e069ba481bcd | NA | 6313d03900105000a 000e069ba481bcd |
- Related reason =
CallParkon CDR3 indicates that Bob did aCallPark. - Related reason =
CallParkRetrieveon CDR4 indicates that Carol did theUnparkorCallParkretrieval. - Answered indicator =
FALSEfor CDR3 parked leg. Answered indicator =TRUEfor rest of the call legs. - The correlation ID remains the same for Alice ↔ Bob. Bob parking the call and Carol unparking would have a different correlation ID.
- For Alice ↔ Bob. Alice’s Local Session ID = Bob’s Remote Session ID. Bob’s Local Session ID = Alice’s Remote Session ID.
- When Bob parks the call to Carol’s extension, only an
ORIGINATINGCDR3 is created that retains Bob’s Local Session ID, Remote Session ID = NA. - By the time Carol Unparks the call, Alice’s Local Session ID is retained and propagates to Alice ↔ Carol's call leg. Alice’s Local Session ID = Carol’s Remote Session ID.
Call with multiple redirection flows:
-
Alice calls Bob. Bob has Call forward Busy enabled to Carol.
-
Carol has Call forward always enabled to Dave.
-
Dave picked up the call, Alice, and Dave talked and either party ends the call.
Webex Calling generates six CDR records. The following table explains the CDR field names and data representations (CDR1 to CDR6).
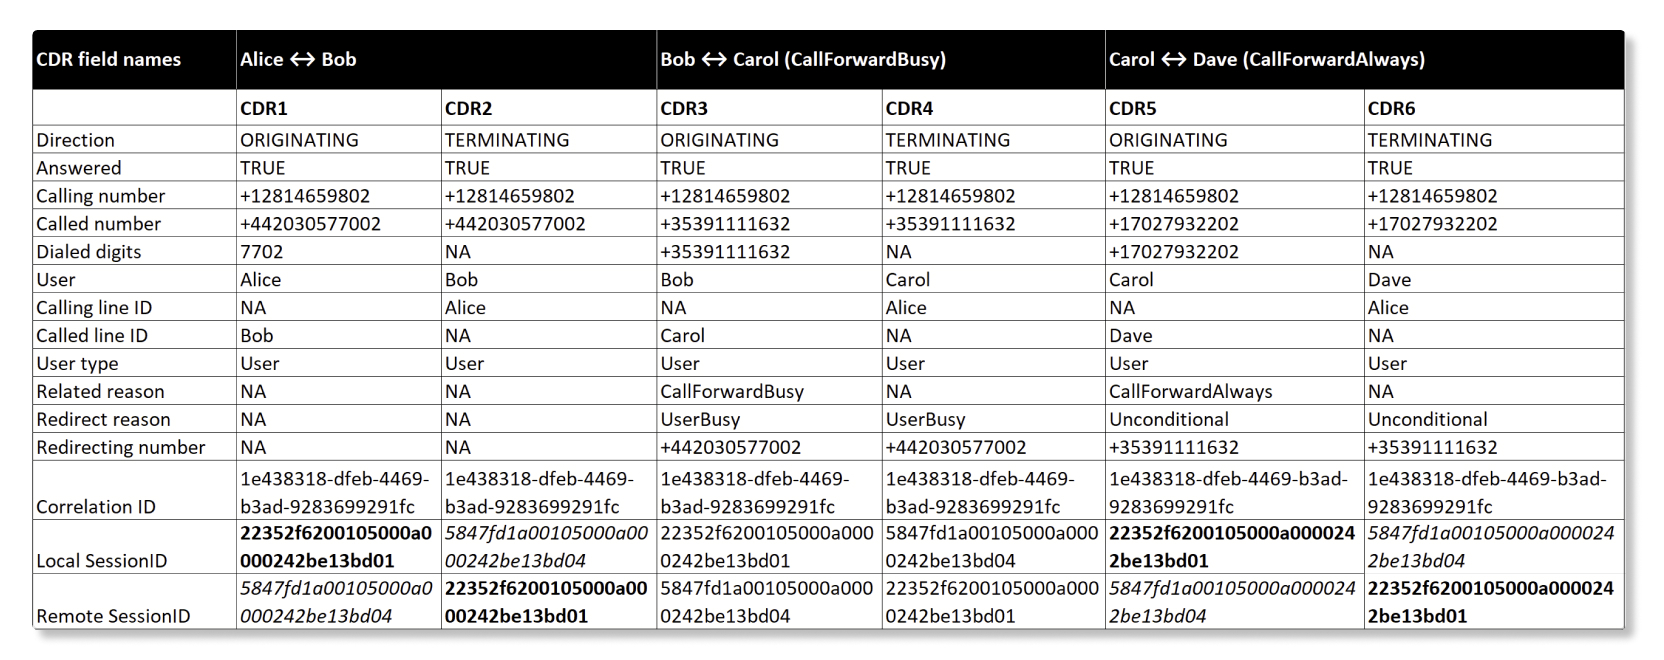
- The calling number always conveys the actual calling party, and it’s not modified by any redirections.
- CDR3, CDR4 (
CallForwardBusy), Redirecting number = Bob’s number. Related reason=CallForwardBusyand Redirect reason=UserBusy. - CDR5, CDR6 (
CallForwardAlways), Redirecting number = Carol’s number. Related reason=CallForwardAlwaysand Redirect reason=Unconditional. - For Alice ↔ Bob call leg, Alice’s Local Session ID = Bob’s Remote Session ID. Bob’s Local Session ID = Alice’s Remote Session ID.
- For Bob ↔ Carol’s (
CallForwardBusy) and Carol ↔ Dave’s (CallForwardAlways), Local Session ID and Remote Session ID from Alice’s call leg are retained and propagated. - For the final call leg from Alice ↔ Dave, Alice’s Local Session ID = Daves’s Remote Session ID. Dave’s Local Session ID = Alice’s Remote Session ID.
Call Timeline
- Alice takes about 20 seconds to call Bob.
- Bob places Alice on Hold and blind transfers the call to Charlie which takes about three seconds before Charlie answers the transferred call.
- Bob clears down and Alice ends the call with Charlie which takes about 23 seconds.
Based on the preceding case, the overall call length is about 46 seconds.
For reference, the spreadsheet captures the Blind Transfer Call Details:

Some records report special functionality. For example, records tagged with
relatedReason=PushNotificationRetrieval indicates that a push
notification is sent to wake up the client and get ready to receive a call.
All Customer Assist reports support Custom Templates, where admins can customize fields and apply certain filters, such as Location.
Queue Call Details
This report provides details of call queues within your organization. You can use this report to see how calls were handled in call queues.
| Column name | Description |
|---|---|
| Call queue | Name of the call queue. |
| Location | Location assigned to the call queue. |
| Call direction for queue | Indicates the direction of the call relative to the queue. All calls entering
the queue are Inbound. Agents can initiate
Outbound calls using the queue's identity. |
| Phone number | Indicates phone number of the remote party. i.e.
|
| Connected number | The number of the remote party that ultimately connected to the call. Relevant only in case of outbound ACD calls (agent dialing an outbound call on behalf of a queue) where the call is redirected from the originally dialed number. |
| Call forwarding applied |
Indicates the type of call forwarding applied to the call if the call was forwarded and not queued (such as before an inbound call getting queued). Column is blank if call forwarding was not applied or in the case of outbound calls. Possible values are:
|
| Policy applied to call |
Type of policy applied to an inbound call queue call before it was queued. Possible values are:
Column is blank if no pre-queue policy was applied or in the case of outbound calls. |
| Call handle type |
This indicates how the call was handled, such as the reason an incoming call was removed from the queue. Possible values are:
In case a queue policy was applied, it would show In case call forwarding was applied, it would show Column is blank if a pre-queue policy was applied or in case of outbound calls. |
| Call outcome |
The final state of the call indicates how it was handled at the end of tracking. Possible values are:
Column is blank for calls that didn't reach agents (such as forwarded, pre-queue policy applied, overflow, etc. and for outbound calls). |
| Queue phone number | Phone number assigned to the call queue. |
| Queue extension | Extension number assigned to the call queue. |
| Primary DNIS used | Indicates whether if primary DNIS was used with the call. |
| DNIS | The specific DNIS number or extension used (Primary or Secondary, based on the one which was used for the call). |
| Transferred from number |
Number from where the call was transferred to the queue. Column is blank for direct inbound calls to the queue or outbound ACD calls (calls initiated by agents on behalf of the queue). |
| Transferred from user type | Type of user that transferred the call to a call queue (such as
HuntGroup, User,
AutoAttendant). |
| Transferred from party | Name of the party that transferred the call to a call queue (e.g. Bakery_AA1). |
| Agent name |
Name of the agent that handled the call (for inbound calls) or initiated the call (outbound ACD calls). Column is blank if the call was not answered by an agent. |
| Transferred to number |
Number that the call was transferred to from the queue due to call forwarding or because of a queue policy. Column is blank if a call is not transferred or outbound ACD calls. |
| Transferred to party | Name of the party that the call was transferred to. |
| Transferred to user type | Type of user that the call was transferred to. |
| Call back number |
Call back number that the call has added if they chose to receive a call back. Column is blank if no callback was selected. |
| Voicemail number/group | Voicemail number where the call ended up. |
| Call queue start time |
For inbound calls, time that the call was added, forwarded, or deflected from the call queue. For outbound calls, time that the call was initiated by an agent. |
| Call queue end time |
Time that the call was removed from the call queue. Column is blank for deflected, forwarded, and outbound calls. |
| Correlation ID | Indicates the Correlation ID of the call to enable tracking specific CDR legs as part of the call that share the same Correlation ID. |
| Bounce count |
Number of times that a call bounced before being answered. Blank for outbound ACD calls and “0” if the call didn't bounce. |
| Call routing option | Call routing option applied to the call that landed in a call queue before
being picked up by an agent. Possible values are:
|
| Agent selection policy | Agent selection policy applied to the call queue call. Possible values are:
|
| Previous wait time (sec) | Amount of time that a call has previously waited in a queue before being bounced to the current call queue. |
| Wait time (sec) |
Amount of time that callers spent waiting in the call queue. This time includes announcement time and ring time. The time is calculated from the queue start time to the queue end time. Column is blank for deflected and outbound ACD calls. |
| Talk time (sec) | Amount of time that the caller spent talking to agents within this interaction. |
| Hold time (sec) | Amount of time that the caller was placed on hold by agents. |
| Handle time (sec) | Total time an agent spent on the call from the queue. This is recorded when the agent ends or transfers the call. Handle time includes talk time, hold time, and ring time. |
| Wrap up time (sec) | Amount of time that an agent spent in the wrap-up state after an inbound call queue call. |
| Conference time (sec) | Amount of time that an agent spent in a conference call with a call and another agent. |
| Agent redirected address |
Address of the redirected call from an agent. This column is blank if the call ends with the agent. |
| Agent call end time | Time that the call was released or redirected from the queue by an agent. |
| Wrap up reason | Wrap-up reason that the agent selected for the call. |
| Call releasing party |
Party who disconnected the call at the end. Column is blank if the call isn't answered. |
| Auto answered | Indicates if an agent auto answered a distributed call. Possible values are:
Column is blank for outbound ACD calls. |
| Skill level | Skill level of the agent that handled the call. |
Queue stats
This report includes one record for each call queue and phone number pairing. If a call queue has only a primary number configured, the report includes one record for that queue. If a call queue has both a primary number and a DNIS number configured, the report includes separate records for each queue and phone number pairing. Use the Phone number and Extension columns to distinguish between records for the same call queue.
| Column name | Description |
|---|---|
| Call queue | Name of the call queue. |
| Location | Location assigned to the call queue. |
| Phone number | Phone number assigned to the call queue. This can be the primary number or DNIS number associated with the queue record. |
| Extension | Extension assigned to the call queue, when configured. |
| Total hold time | Total time that inbound call queue calls were placed on hold by agents. Time
values are shown in hh:mm:ss format. |
| Avg hold time | Average time that inbound call queue calls were placed on hold by agents. |
| Total talk time | Total time that agents were actively talking on inbound call queue calls. |
| Avg talk time | Average time that agents were actively talking on inbound call queue calls. |
| Total handle time | Total time agents spent handling inbound call queue calls, including ring time, talk time, and hold time. This is recorded when the agent ends or transfers the call. |
| Avg handle time | Average time agents spent handling inbound call queue calls. |
| Total wait time | Total time that callers spent waiting for the next available agent to answer inbound call queue calls. |
| Avg wait time | Average time that callers spent waiting for the next available agent to answer inbound call queue calls. |
| Answered calls | Number of inbound call queue calls answered by agents. |
| % Answered calls | Percentage of inbound call queue calls answered by agents. |
| Abandoned calls | Number of inbound call queue calls where the caller hung up or left a message before an agent became available. |
| % Abandoned calls | Percentage of inbound call queue calls where the caller hung up or left a message before an agent became available. |
| Avg abandoned time | Average time before callers hung up or left a message on inbound call queue calls before an agent became available. |
| Total abandoned time | Total time before callers hung up or left a message on inbound call queue calls before an agent became available. |
| Total calls | Total number of incoming calls to the call queue. |
| Calls overflowed | Number of inbound call queue calls that overflowed because the queue limit is met. |
| Calls timed out | Number of inbound call queue calls that timed out because the wait time exceeded the maximum limit. |
| Calls transferred | Number of inbound call queue calls that were transferred out of the queue. |
| Avg no. of agents assigned | Average number of agents assigned to call queues. |
| Avg no. of agents handling calls | Average number of agents that actively handled calls. |
| Total outbound calls | Total number of outbound calls placed by agents on behalf of or through the call queue. This does not include direct outbound calls initiated outside the queue context. |
| Total answered outbound calls | Total number of outbound calls placed through the call queue that were answered by the called party. |
| Total outbound talk time | Total time that agents spent actively talking on outbound calls placed through
the call queue. Time values are shown in hh:mm:ss format. |
| Total outbound hold time | Total time that outbound calls placed through the call queue were on hold. |
| Total outbound wrap up time | Total time that agents spent in the wrap-up state after outbound calls placed through the call queue. |
| Total outbound handle time | Total time that agents spent handling outbound calls placed through the call queue. Handle time includes ring time, talk time, and hold time. |
| Total requested call back calls | Total number of inbound call queue calls where callers requested a callback. |
| Total answered call back calls | Total number of callback calls that were answered by the customer. |
| Total auto answered calls | Total number of inbound queue calls that were automatically answered by the agent. |
Queue agent stats
This report includes agent statistics for each call queue and phone number pairing. If a call queue has only a primary number configured, the report includes one record for that queue. If a call queue has both a primary number and a DNIS number configured, the report includes separate records for each queue and phone number pairing. Use the Phone number and Extension columns to distinguish between records for the same call queue.
| Column name | Description |
|---|---|
| Agent name/workspace name | Name of the agent or workspace. |
| Call queue | Name of the call queue. |
| Location | Location assigned to the call queue. |
| Phone number | Phone number assigned to the call queue for the agent statistics record. This can be the primary number or DNIS number associated with the queue. |
| Extension | Extension assigned to the call queue, when configured. |
| Total answered calls | Number of inbound call queue calls that were presented to the agent and answered by them. |
| Bounced calls | Number of inbound call queue calls that were presented to the agent but went unanswered. |
| Abandoned calls | Number of inbound call queue calls where the caller hung up or left a message before an agent became available. |
| Other unanswered calls | Number of inbound call queue calls that had an unanswered status other than bounced or abandoned. |
| Total presented calls | Number of inbound calls to the agent that were distributed by the call queue. |
| Total auto answered calls | Total number of inbound queue calls that were automatically answered by the agent. |
| Total talk time | Total time that the agent spent actively talking on inbound call queue calls.
Time values are shown in hh:mm:ss format. |
| Avg talk time | Average time that the agent spent actively talking on inbound call queue calls. |
| Total hold time | Total time that the agent put inbound call queue calls on hold. |
| Avg hold time | Average time that the agent put inbound call queue calls on hold. |
| Total handle time | Total time the agent spent handling inbound call queue calls, including ring time, talk time, and hold time. This is recorded when the agent ends or transfers the call. |
| Avg handle time | Average time that the agent spent handling inbound call queue calls. |
|
Total outbound calls | Total number of outbound calls placed by the agent on behalf of or through a call queue. This does not include direct outbound calls initiated outside the queue context. |
|
Total answered outbound calls | Total number of outbound calls placed by the agent through a call queue that were answered by the called party. |
|
Total outbound talk time | Total time that the agent spent actively talking on outbound calls placed
through a call queue. Time values are shown in hh:mm:ss format.
|
|
Total outbound hold time | Total time that outbound calls placed by the agent through a call queue were on hold. |
|
Total outbound wrap up time | Total time that the agent spent in the wrap-up state after outbound calls placed through a call queue. |
|
Total outbound handle time | Total time that the agent spent handling outbound calls placed through a call queue. Handle time includes ring time, talk time, and hold time. |
Wrap-up Reason
This report provides details on how agents are wrapping up calls in your organization. You can use this report to take any actions based on those details, such as refining wrap-up reasons or assessing whether agents deliver quality customer assistance.
| Column name | Description |
|---|---|
| Date | Date of the call. |
| Agent Name | Name of the agent. |
| Location | Physical location assigned to the agent. |
| Contact Start Timestamp | Timestamp of when the agent started talking to the customer on the call. |
| Contact End Timestamp | Timestamp of when the agent ended talking to the customer on the call. |
| Contact Duration | Number of inbound calls to the agent that are distributed by the call queue. |
| Wrap-Up Reason | Name of the wrap-up reason that the agent selects for the wrap-up state. |
| Wrap-Up Duration | Amount of time that the agent was engaged in the wrap-up activity state. |
| Wrap-Up Activity Start Timestamp | Timestamp of when the wrap-up activity started. |
| Wrap-Up Activity End Timestamp | Timestamp of when the wrap-up activity ended. |
Queue Agent Activity Details
This report provides comprehensive insights into agent availability, performance, and operational efficiency for Customer Assist Call Queue calls. The data in this report is aggregated on a per-shift basis.
Agent activity is defined in shifts. A shift is the time between when an agent signs in to call queues and then signs out of call queues after their shift is over. The details in the report are recorded per shift for the agent’s working hours classifying the necessary metrics to measure productivity.
-
Data won't be reflected correctly if an agent doesn't press the Sign In and Sign Out button during their shift.
-
Data for this report is only available for the previous day, or 24 hours later.
-
Data will be available from October 20th, 2025.
Considerations for using the Queue Agent Activity Details report:
-
Records in each row in this report correspond to the time at which an agent signs in and signs out from Webex App. Accuracy of sign-in and sign-out times captured in this report would therefore depend on agents signing in and signing out at the start and end of their shifts versus anytime during their shifts.
-
If an agent signs in but doesn't sign out, the records will continue to be aggregated in the same shift up to the time the report is generated. For example, if an agent doesn't sign out, the session is considered open until the report is run. In such cases, the sign-out time in the report would be blank.
-
In case customers wish to post-process this report to get aggregated values for agents via a pivot, change the cell format to
Custom (hh:mm:ss)format to get the right aggregation.
Examples on how data is captured in the report:
Agent signs out at the end of their shift:
-
Agent Bob signs in at 9:00 AM and signs out at 5:00 PM.
-
The report aggregates all activities performed by Bob between 9:00 AM and 5:00 PM as one shift session.
Agent doesn't sign out at the end of their shift:
-
Agent Alice signs in at 8:00 AM but forgets to sign out at the end of her shift.
-
The report is generated at 6:00 PM.
-
All activities performed by Alice from 8:00 AM to 6:00 PM are aggregated into one shift session.
-
To expand on this, if Alice signs out at 5:00 PM on the next day, the agent activities between 8:00 AM from the first sign in and 5:00 PM on the next day's sign out would be aggregated into one shift session.
Agent has multiple shifts in a day:
-
Agent Joe signs in at 7:00 AM, signs out at 11:00 AM, then signs back in at 1:00 PM and then signs out at 4:00 PM on the same day.
-
The report will capture these agent activities under two separate shift sessions for Joe. One from 7:00 AM to 11:00 AM and the other from 1:00 PM to 4:00 PM.
Known issues
In some cases, calls that were declined by agents using Webex Mobile and Desktop clients
may be counted as Bounced Calls Unreachable.
| Column name | Description |
|---|---|
| Agent Name | Name of the agent or workspace. |
| Agent Location | Location of the agent. |
| Sign In Time | Time and date of when the agent signed in to the queue, in UTC. |
| Sign Out Time |
Time and date of when the agent signed out of the queue, in UTC. This field is blank if the agent didn't sign out. |
| Sign In Duration |
Total amount of time that the agent was signed in during a shift. Time is
captured in the This field is blank if |
| Total Presented Calls |
Total number of inbound call queue calls that were presented to the agent.
|
| Total Answered Calls | Total number of inbound call queue calls that were answered by the agent. |
|
Total Auto Answered Calls | Total number of inbound Customer Assist queue calls that were automatically answered by the agent. |
| Bounced Calls Declined by Agent | Total number of call queue calls presented to the agent, but bounced because the calls were declined (rejected) by the agent. |
| Bounced Calls No Answer | Total number of call queue calls presented to the agent, but bounced because the agent didn't answer within the defined ring time. |
| Bounced Calls Unreachable | Total number of call queue calls presented to the agent, but bounced due to the agent being unreachable (unregistered endpoint). |
| Abandoned Calls | Total number of call queue calls presented to the agent, but the callers hung up before the agent could answer. |
| Other Unanswered Calls | Total number of call queue calls presented to the agent,but the calls were
answered by another agent. This is applicable in a simultaneous ring scenario where
a call was presented to multiple agents, and when one agent answers, the call is
counted as Other Unanswered Calls for the rest of the agents it was
presented to. |
| Total Outbound Calls | Total number of outbound calls placed by the agent on behalf of (through) a call queue. This doesn't include any direct outbound calls initiated by the agent. |
| Available Idle Time | Total duration that the agent spent in an idle state in a shift. For example,
the total time when the agent was available (signed in) but didn't handle calls.
Time is captured in the Hours:Minutes:Seconds format. |
| Available Busy Time | Total duration that the agent spent in a busy state shift. For example,
handling call queue calls. This includes Talk, Hold and Ring times for the Call
Queue calls (both inbound and outbound) that the agent handled in that session. Time
is captured in the Hours:Minutes:Seconds format. |
| Unavailable Time | Total duration that the agent was in an unavailable state in a shift. Time is
captured in the Hours:Minutes:Seconds format. |
| Inbound Talk Time | Total duration that the agent spent talking with callers on inbound call queue
calls. Time is captured in the Hours:Minutes:Seconds
format. |
| Outbound Talk Time |
Total duration that the agent spent talking with callers on outbound call queue
calls. Outbound calls are calls made by the agent on behalf of a call queue. Time
is captured in the This doesn't include any direct outbound calls initiated by the agent. |
| Average Inbound Talk Time | Average of call queue inbound calls talk time. Time is captured in the
Hours:Minutes:Seconds format. |
| Average Outbound Talk Time | Average of call queue outbound calls talk time. Time is captured in the
Hours:Minutes:Seconds format. Outbound calls are calls made by
the agent on behalf of a call queue. |
| Inbound Hold Time | Total duration of call queue inbound calls hold time. Time is captured in the
Hours:Minutes:Seconds format. |
| Outbound Hold Time | Total duration of call queue outbound calls hold time. Time is captured in the
Hours:Minutes:Seconds format. Outbound calls are calls made by
the agent on behalf of a call queue. |
| Average Inbound Hold Time | Average of call queue inbound calls hold time. Time is captured in the
Hours:Minutes:Seconds format. |
| Average Outbound Hold Time | Average of call queue outbound calls hold time. Time is captured in the
Hours:Minutes:Seconds format. Outbound calls are calls made by
the agent on behalf of a call queue. |
| Inbound Wrap Up Time | Total amount of time that the agent spent in the wrap-up state after an inbound
call queue call. Time is captured in the Hours:Minutes:Seconds
format. |
| Outbound Wrap Up Time | Total amount of time the agent spent in the wrap-up state after an outbound
call. Time is captured in the Hours:Minutes:Seconds format.
Outbound calls are calls made by the agent on behalf of a call queue. |
| Average Inbound Wrap Up Time | Average inbound wrap-up time taken by the agent. Time is captured in the
Hours:Minutes:Seconds format. |
| Average Outbound Wrap Up Time | Average outbound wrap-up time taken by the agent. Time is captured in the
Hours:Minutes:Seconds format. |
| Inbound Handle Time | Total duration to handle inbound call queue calls by the agent. Time is
captured in the Hours:Minutes:Seconds format. Handle minutes
includes ring time, talk time and hold times for the inbound call queue calls.
|
| Outbound Handle Time | Total duration to handle outbound calls where calls are made by an agent on
behalf of the call queue. Time is captured in the
Hours:Minutes:Seconds format. Handle minutes includes ring time,
talk time, and hold time. |
| Average Inbound Handle Time | Average duration to handle an inbound call queue call. Time is captured in the
Hours:Minutes:Seconds format. |
| Average Outbound Handle Time | Average duration to handle an outbound call queue call. Time is captured in the
Hours:Minutes:Seconds format. |
| Consultative Transfer Count | Total number of times an agent transferred a call to another party after consult. |
| Blind Transfer Count | Total number of times an agent transferred a call to another party without consult. |
Customer Assist Queue Text Stats
The Customer Assist Queue Text Stats report provides usage statistics for inbound and outbound text interactions handled through Customer Assist queues within your organization.
Administrators can use this report to understand queue-level interaction volume, message volume, claimed and closed interactions, response time, handle time, and agent participation.
Use this report to:
-
Review inbound and outbound text interaction volume by Customer Assist queue.
-
Understand how many interactions were claimed and closed by agents.
-
Compare inbound and outbound message volume across queues and locations.
-
Monitor average response and handle times for queue-level text interactions.
-
Identify how many unique agents worked on text interactions for a queue.
| Column name | Description |
|---|---|
| Call queue | Name of the Customer Assist queue that handled the text interactions. |
| Location | Location where the Customer Assist queue is configured. |
| Phone number | Phone number associated with the queue for the reported text interactions. For inbound interactions, this is the number that the customer texted. For outbound interactions, this is the number used by the queue. |
| Extension | Extension associated with the Customer Assist queue, when configured. |
| Total inbound interactions | Total number of inbound text interactions for the queue during the selected report period. |
| Total outbound interactions | Total number of outbound text interactions for the queue during the selected report period. |
| Total inbound messages | Total number of inbound text messages received in the reported interactions. |
| Total outbound messages | Total number of outbound text messages sent in the reported interactions. |
| Total claimed interactions | Total number of interactions that were claimed by an agent. |
| % Claimed interactions | Percentage of reported interactions that were claimed by an agent. |
| Total closed interactions | Total number of interactions that were closed during the selected report period. |
| % Closed interactions | Percentage of reported interactions that were closed. |
| Unattended interactions | Number of interactions where an agent wasn't present. |
| Avg inbound interactions length | Average number of messages in inbound interactions. |
| Avg outbound interactions length | Average number of messages in outbound interactions. |
| Avg inbound response time | Average time, in seconds, for an inbound interactions to be claimed after it started. |
| Avg inbound handle time | Average time, in seconds, spent handling claimed inbound interactions that were closed. |
| Avg outbound handle time | Average time, in seconds, spent handling outbound interactions that were closed. |
| Total agents claimed | Number of unique agents who claimed interactions for the queue during the selected report period. |
Rooms and Desks Detail
Use this report to see details of every device in your organization and its uses. The
Total Hours Used column, shows the total usage of the device over the
selected date range. Such information helps you to find under-utilized devices. You can also
find out which devices have been offline by checking the Last Seen Date
column.
The information in this report is the same as what you can find in the Analytics dashboard.
|
Column Name |
Description |
|---|---|
|
Device ID |
Unique identifier internal for administrators. |
|
Device Type |
Device model. |
|
Assigned To |
A name of the place or user this device is assigned to. If this field is blank, then the device is deleted from your organization. |
|
Tags |
Shows tags assigned to the device on the Control Hub Devices page. |
|
IP Address |
Last known IP address of when the device is online. |
|
Mac Address |
Media Access Control address of the device. |
|
Latest Known Status |
Device online status from the last 24 hours. |
|
Total Hours Used |
Total usage over the selected date range |
|
Calls |
The number of hours the device is used for a call over the selected date range. |
|
Local Display Wired |
The number of hours the device is used for a wired local display over the selected date range. |
|
Local Display Wireless |
The number of hours the device is used for a wireless local display over the selected date range. |
|
Whiteboarding |
The number of hours the device is used for whiteboarding over the selected date range. |
|
Digital Signage |
The number of hours the device is used for digital signage over the selected date range. |
|
USB Passthrough |
The number of hours the device is used for USB passthrough over the selected date range. |
|
First Seen |
Shows when the device is added to the Control Hub for the first time. |
|
Last Seen |
Shows when the device is last online. |
|
Delete Date |
Shows when the device is deleted from Webex. |
VIMT License Report
This report shows you the license usage for unique active Cisco devices and third-party SIP devices that use the Video Integration for Microsoft Teams (VIMT) in your organization. Each date that you select has their own set of data. For example, if you run a report for June 1, 2020 to June 5, 2020, then the report shows you the data for each date of the report.
|
Column Name |
Description |
|---|---|
|
Webex Org ID |
The unique ID of the Control Hub organization that the report belongs to. |
|
Date |
The calendar date for the recorded data. There’s one record per day. |
|
Device 24 hours |
The count of unique devices that used VIMT in the last 24 hours of the date. |
|
Device last 30 days |
The rolling count of unique devices that used VIMT in the last 30 days of the date. |
|
Unique Devices Rolling 90 day average |
The rolling average count of unique devices that used VIMT in the last 90 days of the date. |
VIMT Usage Report
This report provides details about calls where Cisco devices and third-party SIP devices used Video Integration for Microsoft Teams (VIMT) to join Microsoft Teams meetings.
|
Column Name |
Description |
|---|---|
|
Teams Conference ID |
The unique ID of the Microsoft Teams meeting. |
|
Device Name |
The name of the device used to join the Microsoft Teams meeting. |
|
Device URL |
The URL associated with the device. |
|
Device Join Time |
The time (in UTC+0) when the device joined the Microsoft Teams meeting using VIMT. |
|
Device Disconnect Time |
The time when the device disconnected from the Microsoft Teams meeting. |
|
Device SIP URI |
The Session Initiation Protocol (SIP) address associated with the device. |
|
Teams Tenant ID |
The unique ID of the user in the Microsoft Teams client. |
|
Date device joined call |
The date that the device is used to join the Microsoft Teams meeting using VIMT. |
Device power consumption report
This report provides details of the energy consumption of Cisco devices and phones. You can use this report to see which devices are using up a lot of energy, and with that information, change modes accordingly to save on energy costs.
This report includes data for the following measurable devices and phones:
- Desk Portfolio (excluding DX 70)
- Board Portfolio (excluding Spark Board 55 and 70)
- Room Kit and Room Kit Mini
- Room Bar and Room Bar Pro
- Quad Cam
- Codec Plus, Codec Pro, Codec EQ
- Room55S
- Desk Phone 9800
| Column name | Description |
|---|---|
| Device name | Name of the device. |
| Device type | Device model. |
| Location | Location assigned to the device. |
| Hours in Call mode | Number of hours (in two decimal points) the device spent in Call mode. |
| Power consumption in Call mode | How much energy the device consumed in watts while in Call mode. |
| Hours in Idle mode | Number of hours (in two decimal points) the device spent in Idle mode. |
| Power consumption in Idle mode | How much energy the device consumed in watts while in Idle mode. |
| Hours in Halfwake mode | Number of hours (in two decimal points) the device spent in Halfwake mode. This data doesn't apply to Desk phones. |
| Power consumption in Halfwake mode | How much energy the device consumed in watts while in Halfwake mode This data doesn't apply to Desk phones. |
| Hours in Display Off mode | Number of hours (in two decimal points) the device spent in Display Off mode. |
| Power consumption in Display Off mode | How much energy the device consumed in watts while in Display Off mode. |
| Hours in Networked Standby mode | Number of hours (in two decimal points) the device spent in Networked Standby
mode. This data doesn't apply to Desk phones. |
| Power consumption in Networked Standby mode | How much energy the device consumed in watts while in Networked Standby
mode. This data doesn't apply to Desk phones. |
| Total power consumption | How much energy the device consumed in kilowatts while in all of the modes combined. |
| Hours in Deep Sleep mode | Number of hours (in two decimal points) the phone spent in Deep Sleep
mode. This data only applies to Desk phones. |
| Power consumption in Deep Sleep mode | How much energy the phone consumed in watts while in Deep Sleep mode. This data only applies to Desk phones. |
Desk phones detail
This report provides details of Cisco Phones used in your organization. You can use this report to view usage data and adoption rates of desk phones.
This report only provides details for the Cisco Desk Phone 8875 and 9800 series.
| Column name | Description |
|---|---|
| Device ID | Unique identifier of the desk phone. |
| Device Type | Device model. |
| Assigned To | Name of the user or workspace that this desk phone is assigned to. |
| Tags | Shows tags assigned to the desk phone on the Control Hub Devices page. |
| IP Address | Last known IP address of the desk phone. |
| Mac Address | Media Access Control address of the desk phone. |
| Serial Number | Serial number of the desk phone. |
| Software version | Last known software version of the desk phone. |
| Latest Known Status | Last known status of the desk phone. |
| First Seen | Shows when the desk phone was added to Control Hub for the first time. |
| Last Seen | Shows when the desk phone was last online. |
| Delete Date | Shows when the desk phone was deleted from Control Hub. |
| Calls | Number of calls made on the desk phone over the selected date range. |
| Meetings | Number of meetings joined on the desk phone over the selected date range. |
| Calls minutes | Number of minutes that the desk phone was used for calls over the selected date range. |
| Meetings minutes | Number of minutes that the desk phone was used for meetings over the selected date range. |
| Action button | Number of times that the action button was used on the desk phone over the
selected date range. This data only applies to Cisco Desk Phone 9800 Series. |
| Hot desking | Number of times that the desk phone was used for hot desking over the selected date range. |
| Favorite button | Number of times that the favorite button was used on the desk phone over the
selected date range. This data only applies to Cisco Desk Phone 9800 Series. |
| Contacts | Number of times that the user accessed contacts on the desk phone over the selected date range. |
| Call logs | Number of times that the user accessed call logs on the desk phone over the selected date range. |
Devices Inventory report
This report allows you to download a consolidated view of the entire current inventory of devices in your organization. As this is a point in time inventory report, time ranges cannot be specified.
Changes made to devices may take up to 24 hours to be reflected in the report.
| Column name | Description |
|---|---|
| Location | Name of the location in the customer organization that the device belongs to. |
| Product | Product type of the device. |
| MAC address | Media Access Control address of the device. |
| Firmware | Software version of the device. |
| Phone Number | Primary phone number associated with the device. |
| Extension | Primary extension associated with the device. |
| Email address of the user that the device is assigned to. | |
| User UUID | UUID of the user that the device is currently assigned to. |
Device Detail
This report provides detailed device information for each meeting and call with usage data and quality monitoring.
| Column name | Description |
|---|---|
| Interaction type | If the device was used for a meeting or call. |
| Service | Type of service used to hold the meeting or call. |
| Connect protocol | Type of protocol used to connect to the meeting or call. |
| Call or meeting ID | Unique identifier of the meeting or call. |
| Meeting name | Subject of the meeting. |
| Audio quality | If the meeting or call had good or poor audio quality overall. |
| Video quality | If the meeting or call had good or poor video quality overall. |
| Device ID | Unique identifier for the device. |
| Device Model | Model name of the device. |
| Belongs to | Name of the place or user this device is assigned to. If this field is blank, then the device was deleted from your organization. |
| Location | Location that the device is assigned to. |
| Device platform | Type of platform that the device is configured to use. |
| IP address | Last known IP address of the device. |
| Mac address | Media Access Control address of the device. |
| Tags | Shows tags assigned to the desk phone on the Control Hub Devices page. |
| Latest known status | Device online status from the last 24 hours. |
| Date | Date of the meeting or call (GMT). |
| Start time | The time that the device joined the meeting or call. |
| End time | The time that the device left the meeting or call. |
| Duration | Total duration of the call or meeting in minutes. |
| Total good audio quality minutes | Total amount of minutes that were of good audio quality during the meeting or call. |
| Total good video quality minutes | Total amount of minutes that were of good video quality during the meeting or call. |
| Total poor audio quality minutes | Total amount of minutes that were of poor audio quality during the meeting or call. |
| Total poor video quality minutes | Total amount of minutes that were of good video quality during the meeting or call. |
| Teams tenant ID | If applicable, the unique ID of the user in the Microsoft Teams client. |
| Connection | Initial connection used to join the meeting or call. |
| Local IP | The IP address of the device used to join the meeting or call. |
| Public IP | The IP address of the device that's externally routable. This can be the same
as Local IP if the device is connected directly to the internet
without using a VPN. |
| Media node | The data center or region of the media node that the device connected to. For cloud-based media nodes, this is a general region name such as "San Jose, USA". For video mesh based media nodes, this will have a more specific name that matches the video mesh cluster name that was provisioned by the customer. |
Workspace usage
This report provides details on how workspaces are used in your organization. You can use this report to see which workspaces are popular with your users.
|
Column name |
Description |
|---|---|
|
Workspace Id |
Unique identifier of the workspace. |
|
Workspace Name |
Name of the workspace. |
|
Location |
Location assigned to the workspace. |
|
Type |
Type assigned to the workspace. |
|
Capacity |
Maximum number of people the workspace is for. |
|
Contains |
Devices assigned to the workspace. |
|
Scheduling Service |
Scheduling service assigned to the workspace. Possible values are:
|
|
Email Address |
Email address assigned to the workspace. |
|
Calling Service |
Calling service assigned to the workspace. Possible values are:
|
|
Device Hosted Meetings |
If the devices assigned to the workspace was used to host meetings within the selected date range. |
|
HotDesking |
If the workspace was used as a hot desk within the selected date range. |
|
Check-in Enabled |
Indicates if check-in is enabled for the workspace. |
|
Occupancy Hours |
Number of hours the workspace was used by people. |
|
Number of Ghosted Meetings |
Number of meetings where the workspace was scheduled for a meeting, but wasn't occupied. |
|
Total Booked Meetings |
Number of meetings that the workspace have been scheduled for use. |
|
% of Ghosted Hours |
Percentage of booked hours with no check-in. |
|
Total Booked Hours |
Total hours the workspace was booked, regardless of occupancy. |
Onboarding User Activation and License Details
This report provides details about method of onboarding users in your organization and how licenses are assigned to them.
|
Column Name |
Description |
|---|---|
|
Name |
The first and last name of the added user. |
|
|
The email address of the user. |
|
Administrator Name |
The first and last name of the administrator who added the user, if applicable. |
|
Administrator Email |
The email address of the administrator who added the user, if applicable. |
|
Invite Sent (GMT) |
The date and time that an invitation is sent to the user, if applicable. |
|
Onboard Method |
The method used to add the user to the Control Hub. Possible values are:
|
|
License Assign Method |
The method used to assign the user the license. The methods are:
|
|
Licenses |
The names of licenses assigned to the user. |
|
License Assign Status |
If the licenses are assigned to the user successfully or unsuccessfully. |
|
Activation Status |
The user’s activation status is shown as Activated if the user signs in to the Webex App for the first time. Users that haven't signed in to the Webex App show as Pending. |
|
Activation Date |
The date of when the user’s status changed to Active. |
|
User ID |
The unique ID of the user. |
|
Administrator ID |
The unique ID of the administrator who added the user. |
Enterprise Agreement Report
This report provides details about how many licenses are being used in a subscription. This report is only available if your organization has an active true forward eligible subscription.
|
Column Name |
Description |
|---|---|
|
Period |
The period that the subscription is in. A period is defined as a 30-day cycle that starts on the day your subscription is activated, and corresponds with your billing cycle. For example, if your subscription started on July 5, 2020, then the next period would start 30 days later, on August 4, 2020. |
|
Date |
The calendar date within the period. |
|
Subscription ID |
The unique ID of the subscription. |
|
Product |
The name of the product for the reported licenses. |
|
Provisioned License Quantity |
The total number of licenses provisioned for the subscription and product. |
|
Allocated License Quantity |
The number of licenses allocated to users at the reported date. |
|
Consumption Quantity |
This number reflects the aligned value used to identity a True Forward. IT admins can track this value throughout the contract term, well before the period in which the subscription is due for a potential change. |
Customize existing templates by reordering or removing columns to view the data that you want to focus on. For example, you can create customized Meetings Attendees reports that focus on participants in specific locations or specific operating systems, or customized Calling Quality reports that focus on audio or video media quality instead of both. Custom templates appear in their own section, and are tagged so that you can easily identify them.
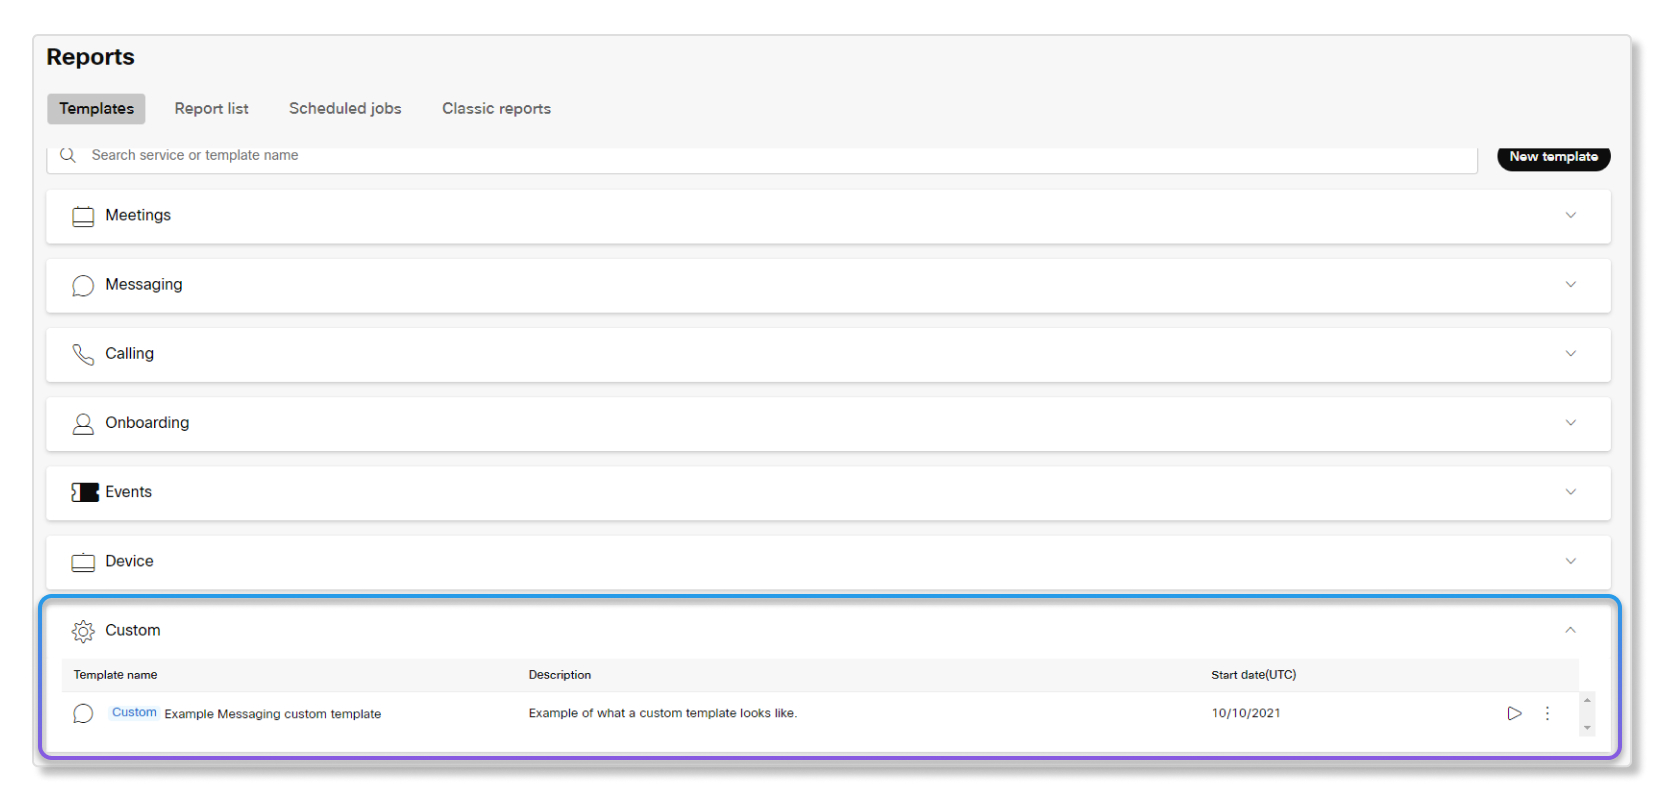
Some templates can't be customized, and some columns are required for certain templates. You can choose which columns are required while customizing a template. The following image shows an example.
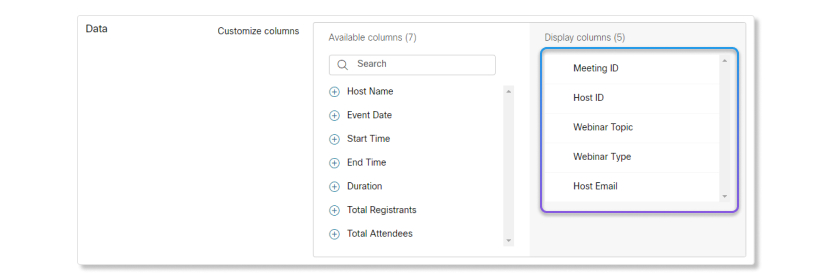
Each administrator can create up to 50 custom templates, and view only the custom templates that they created.
An external administrator, such as a partner administrator who manages a customer's organization in the Control Hub, cannot create new custom templates.
You can create up to 50 custom templates and view only your custom templates. Other administrators can create their own set of up to 50 custom templates.
Custom templates aren't editable after they're created.
| 1 |
Sign in to Control Hub and go to . |
| 2 |
Click New custom template. A full-screen window appears. To exit this window, you can click
Cancel or finish creating the custom template.
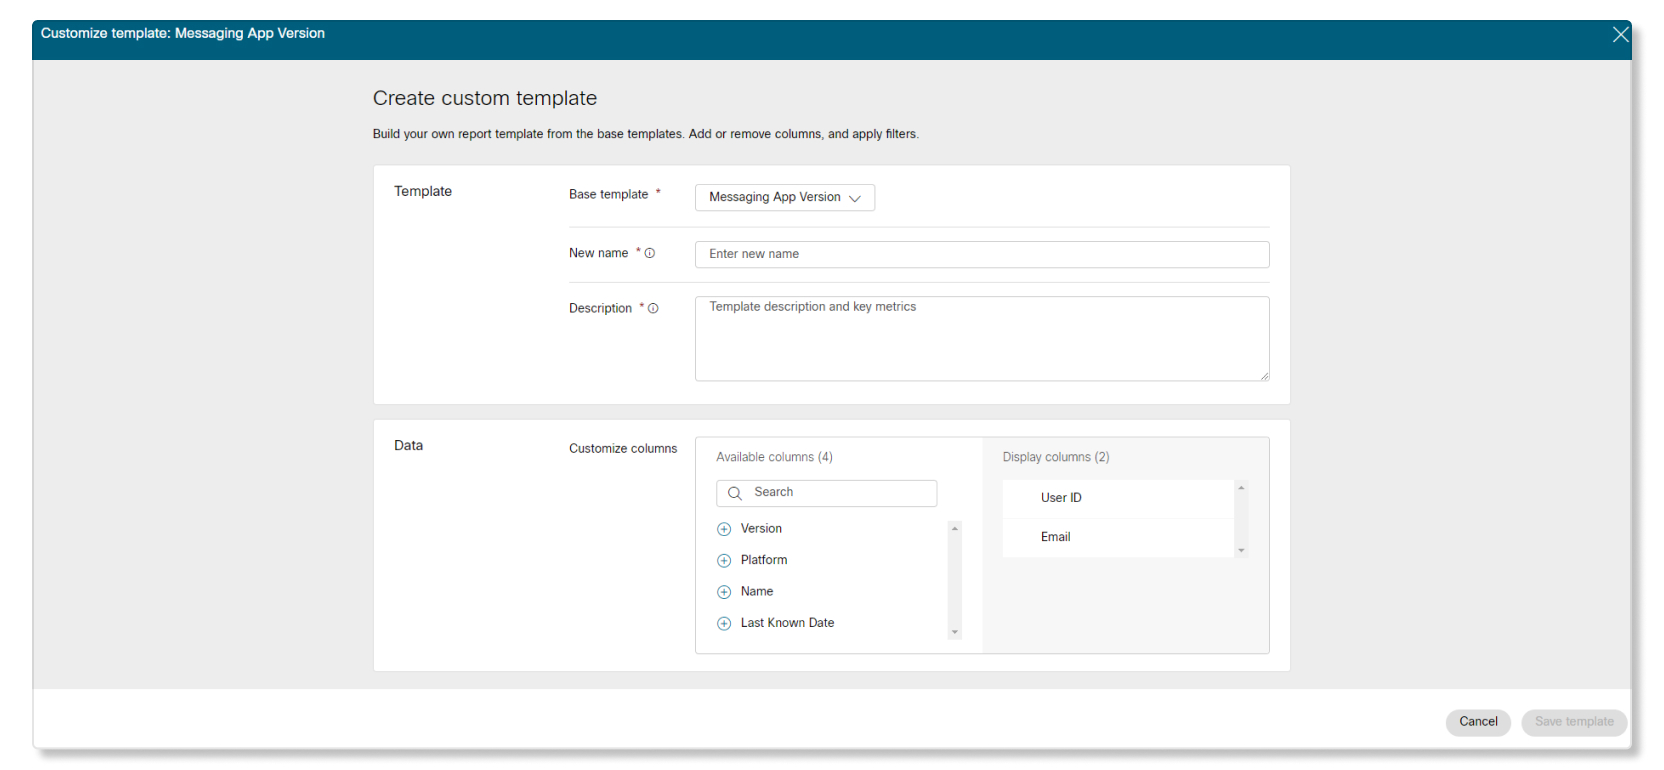 |
| 3 |
In the Template section, select which template you want to customize, enter the name for the custom template, and add a description. |
| 4 |
In the Data section, select options:
|
| 5 |
Click Save template. |
When you delete a custom template, any automatic schedules for that template are also deleted. Previously generated report from that custom template is kept.
| 1 |
Sign in to Control Hub and go to . |
| 2 |
Click the More button next to the custom template that you want to delete. |
| 3 |
Select Delete and then confirm your choice. |
| 1 |
Sign in to Control Hub and go to . |
| 2 |
Click on a report template that you want to generate. |
| 3 |
Click Generate report. |
| 4 |
Choose to generate the report:
|
| 5 |
If you choose to schedule a report, you can select from the following on when to end the scheduled report:
|
| 6 |
If applicable, select the timezone for the report. For one-time reports, you choose the timezone each time. For scheduled reports, the selected timezone applies to future generated reports. |
| 7 |
Check the Share with org users check box to schedule reports for other users in your organization. Those users will receive an email with a direct download link for the report. You can share scheduled reports with users whose email domain is verified in Control Hub, or with external administrators whose full email address is listed in Control Hub. |
| 8 |
Depending on the schedule for the report, select Generate Report or Schedule Report. |
Reports that you generate show up in the Report list tab. You can see when a report is ready to download under the Status column. Report statuses available are:
- Processing—The report is generating the data for you to download.
- Processed—The report has generated the data. You can start to prepare the report for download.
- Preparing for download—You've selected to prepare the report so you can download it.
- Ready for download—The report is ready for you to download at any time.
- Incomplete—The report isn't processed correctly. Generate the report again to fix this status.
| 1 |
Sign in to Control Hub and go to . |
| 2 |
Under Actions, click More The status of report changes to Preparing for
download.
|
| 3 |
Once the status of report changes to Ready for download, click
More |
| 4 |
Select Compressed file. The report starts to download.
|
 next to the report you want to download, and then select
 You can disable a report if you want to pause the report from running automatically.
| 1 |
Sign in to Control Hub and go to . |
| 2 |
Under Actions, click More |
| 1 |
Sign in to Control Hub and go to . |
| 2 |
Under Actions, click More |
| 3 |
Select Delete. |
You can use classic reports to view comprehensive statistics for Webex Meetings, Webex Events (Classic), Webex Training, and Webex Support services in your organization. Monitor usage across services, attendance for events and sessions, and support activities so that you can determine how you can build a more efficient organization.
Learn more about these reports at this article.
You have access to 3 months of data for classic reports with both Standard and Pro Pack licenses.


