
Thanks for your feedback.
 Feedback?
On the utilization and environmental metrics page for a workspace in Control Hub, you’re able to see trends for the last 24 hours, 7 days, and 30 days. You can also see raw data for the last 2 hours. This information can be used to:
-
Address sound and noise issues to improve the audio experience for users.
-
Make cost saving adjustments and improve the use of real estate.
-
Determine if some workspaces are used more often than others.
-
Determine the real usage of workspaces both in time and by how many.
Supported products
|
|
Room Series |
Board Series |
Board Pro Series |
Desk, Desk Mini, Desk Pro, Desk Pro G2 |
|---|---|---|---|---|
|
Temperature |
Available with Room Navigator |
Available with Room Navigator |
Available |
Available |
|
Relative humidity |
Available with Room Navigator |
Available with Room Navigator |
Available |
Available |
|
Sound and ambient noise levels |
Available |
Available |
Available |
Available |
|
Presence |
Available |
Available |
Available |
Available |
|
Occupancy |
Available in a call Room Kit Plus and Room Kit Pro with Quad Camera or SpeakerTrack 60 Room Kit EQ with Quad camera Available outside of a call A Quad Camera is required |
Available |
Available |
Available |
|
Air quality |
Available with Room Navigator |
Available with Room Navigator |
Available with Room Navigator |
- |
|
Reverberation |
Available |
Available |
Available |
Available |
|
Lighting |
Devices running RoomOS 26: Available with integrated camera or with Quad Camera |
- |
Available |
Available |
-
If a supported device has sensors but is assigned to a user, not a workspace, no data is collected.
-
Lighting is supported on devices running RoomOS April (26.5)
Lighting values are currently not available on the utilization and environmental metrics page. Those are reported on the workspace details page under Comfort.
Available sensors and how to enable them
You can enable sensors using the settings listed here.
You can either:
-
Set the configuration on one device.
-
Set the configuration on multiple devices.
-
Use configuration templates.
-
Use default configurations for your organization or location.
For more details on the different ways to set configurations, see the Device configurations for Board, Desk, and Room Series devices article.
Occupied: RoomAnalytics > PeoplePresenceDetector: On
-
The device uses ultrasound and/or head detection to detect people in the workspace. One or both of these options needs to be set to On for the PeoplePresenceDetector setting to work. Ultrasound and head detection can be turned on and off using these settings:
-
RoomAnalytics > PeoplePresence > Input > HeadDetector: On/Off (default On)
-
RoomAnalytics > PeoplePresence > Input > Ultrasound: On/Off (default Off)
-
Occupants: RoomAnalytics > PeopleCountOutOfCall: On
-
The device calculates occupancy by detecting the number of people in the workspace. The camera can track the number of people present outside of calls as well if configured. In order for this to work outside of a call, you need a Quad Camera with the Codec EQ, Codec Plus, and Codec Pro.
Sound level: RoomAnalytics > AmbientNoiseEstimation > Mode: On
-
Sound level shows the current sound level in the workspace.
Note that sound level is only reported when the ambient noise estimation sensor is turned on.
Ambient noise: RoomAnalytics > AmbientNoiseEstimation > Mode: On
-
Ambient noise level is based on the noise estimation in the stationary noise reduction algorithm that is a part of the device acoustic echo canceller.
Temperature: Always enabled
-
The temperature sensor has an operating range 0–35 degrees Celsius (32–95 Fahrenheit). Placement of the device in the workspace might give variations in reported temperature.
Relative humidity: Always enabled
-
The humidity sensor reports relative humidity with an operating range between 20% and 90%. The sensor accuracy is +/- 10%.
Air quality: Always enabled
-
The Volatile Organic Compound sensor (TVOC) measures indoor air quality. It measures the presence and quantity of gases emitted, for example, by solvents, smoke, and human breath. TVOC value renders a general index based on the total sum of those gases as defined by the Umweltbundesamt agency (UBA). The air quality information can be used, for example, to determine whether the workspace needs better ventilation.
-
A period of 72 hours is recommended for the sensor to stabilize in a new location. The sensor also needs to stabilize when the device has been turned off for a longer period of time.
Reverberation: Always enabled
-
Reverberation time is a measure of sound decay in a space and can help you understand the acoustic quality of your workspace. You can run a manual test that will play sound on the device speakers to estimate the reverberation time.
-
To run a manual reverberation test, either select Run test or click on the More menu and select Run test. Then select Run test in the pop-up window.
The manual reverberation time measurement plays sound on the device loudspeakers to estimate the reverberation time in the workspace. The results allow you to compare with Cisco's recommended values.
-
Make sure the workspace is not in use prior to running the test.
-
Doors and windows should be closed to reduce noise and approximate meeting conditions.
-
The test can take up to 20 seconds to run, depending on the number of loudspeakers in the device.
-
Lighting: Always enabled
Reports the current lighting conditions in the room as:
- Good: Conditions are normal and camera is able to detect presence and objects in the room.
- Backlit: Conditions for automatic exposure are difficult and may result in suboptimal video quality.
- Dark: Camera detects darkness and is using high sensor gain, resulting in increased noise.
- Camera inactive: Camera has gone into standby after a period of inactivity.
Access utilization and environmental metrics for workspaces
From the customer view on https://admin.webex.com , go to Workspaces and select a workspace.
Go to Insights and select either Utilization or Environmental.
On this page, you can toggle between the utilization and the environmental metrics. From the drop-down menu in the upper right corner, you can select between trends from last 24 hours, 7 days, or 30 days. You can also select raw data for last 2 hours. For temperature data, you can change between Fahrenheit and Celsius.
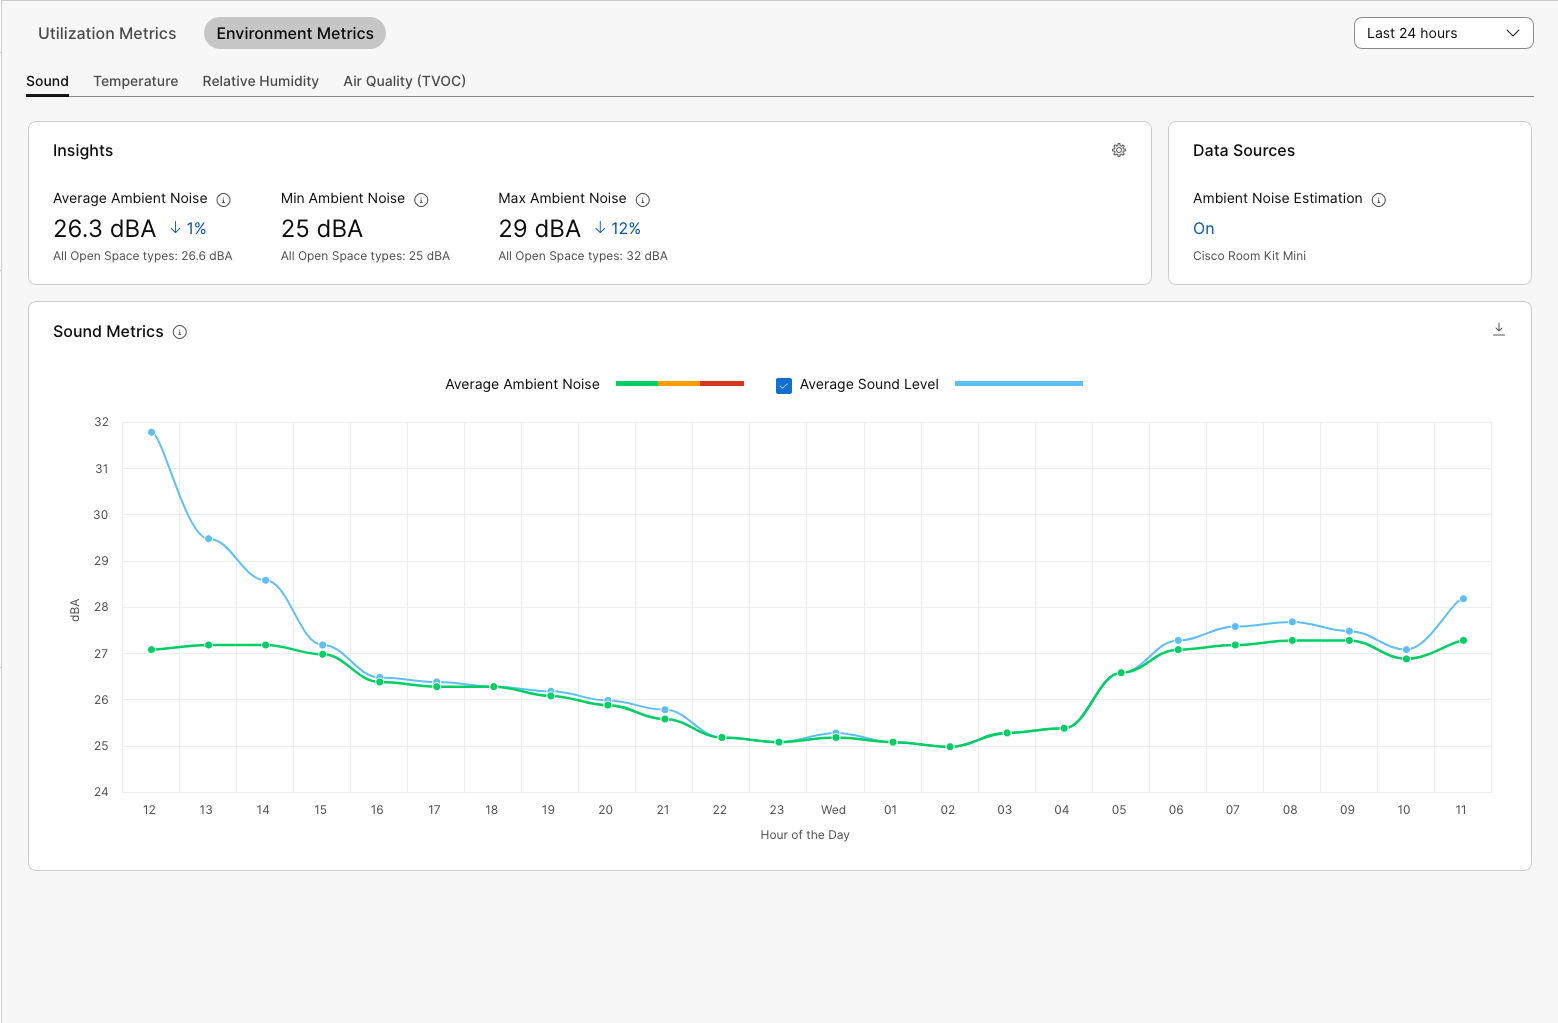
In the Insights section, you can find the average, minimum, and maximum readings for the selected time period. The percentage change shows the comparison to the previous selected time period. You can also see the average, minimum, and maximum for all workspaces with the same room type to see how this workspace compares to those.
If you hover over the graph, you can see detailed information from that specific point in time.
You can export the information from the graph as a CSV file by clicking the download icon in the right corner.
Thresholds for environmental metrics
For all three environmental metrics, there are color coded thresholds to make it easier to see at a glance where the readings land.
The thresholds for temperature, relative humidity, and sound level are based on extensive worldwide research and collaboration with building technology companies.
The thresholds cannot be adjusted and are subject to change.
Threshold color codes:
-
Green: Excellent or Good
-
Yellow: Acceptable
-
Red: Poor
Levels deemed as Excellent:
-
Temperature: 21-25 degrees Celsius / 68-77 degrees Fahrenheit
-
Relative humidity: 30-60 %
-
Ambient noise: 0-40 dBA
-
Air quality: TVOC index < 2.99
-
Reverberation: 0.3-0.4 s
The changes to these values are reported every 5 minutes.


