
Thanks for your feedback.
 Feedback?
| 1 |
When you're in a meeting, hover over the icon at the top right of your screen to see your network connection and CPU usage. See the table below for what each color means. |
| 2 |
To open the Health Checker and see more diagnostics, click |
| 3 |
Click Statistics to see information about audio, video, and content sharing. |
| 4 |
Click Performance to see information about CPU, memory, and energy usage. |
 at the bottom of the screen, then select
 When you have a poor network connection that limits your meeting experience, a notification automatically appears.
|
Color |
Health Status |
Description |
|---|---|---|
|
Green |
Good |
You're able to have the full meeting experience. |
|
Yellow |
Poor |
Issues may create some limitations for your meeting experience. |
|
Red |
Bad |
Issues are definitely limiting your meeting experience. |
Once a problem is identified, the Health Checker summarizes the problem and provides you with a list of actions you can follow to solve the problem in Health Status.
Click Export all data to send the problem report directly from the Health Checker page.
| 1 |
Go to . 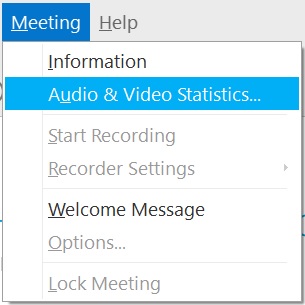 |
| 2 |
To see the CPU and memory usage when content is being shared, select Sharing Content. 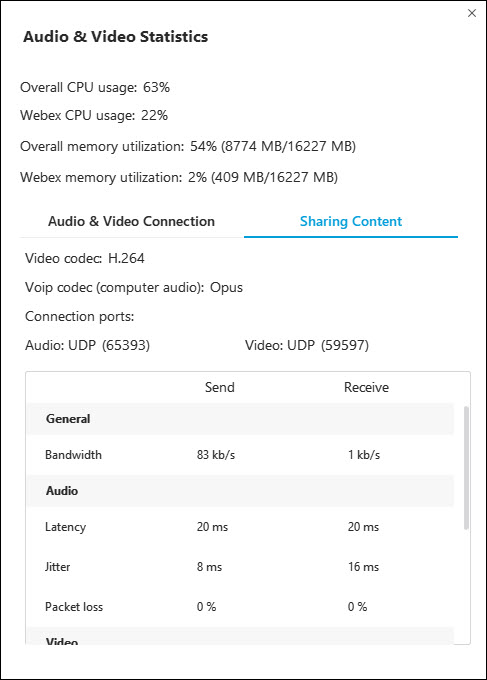
|


