- Start
- /
- Artikel

Hartelijk dank voor uw feedback

AI Assistant rapporten in Analyzer
 In dit artikel
 Feedback?
Met het AI Assistant Dashboard kunt u de AI Assistant functies in uw organisatie bewaken en beoordelen door middel van gedetailleerde gegevens en analysegegevens en analyses zodat u het gebruik van het bedrijf kunt begrijpen en de impact op uw activiteiten.
Het AI Assistant-dashboard en -rapporten openen
U hebt Supervisor- of Beheerdersrechten nodig om toegang te krijgen tot Analyzer.
| 1 |
Meld u aan bij Analyzer met de URL die u van uw beheerder hebt verstrekt. |
| 2 |
Als u AI Assistant-rapporten wilt weergeven, gaat u op een van de volgende manieren te werk:
Momenteel zijn AI Assistant dashboard en rapporten niet beschikbaar in de Analyzer-bèta. |
 (boom) pictogram.
  (puntjes) en klik op
 Dashboard AI Assistant
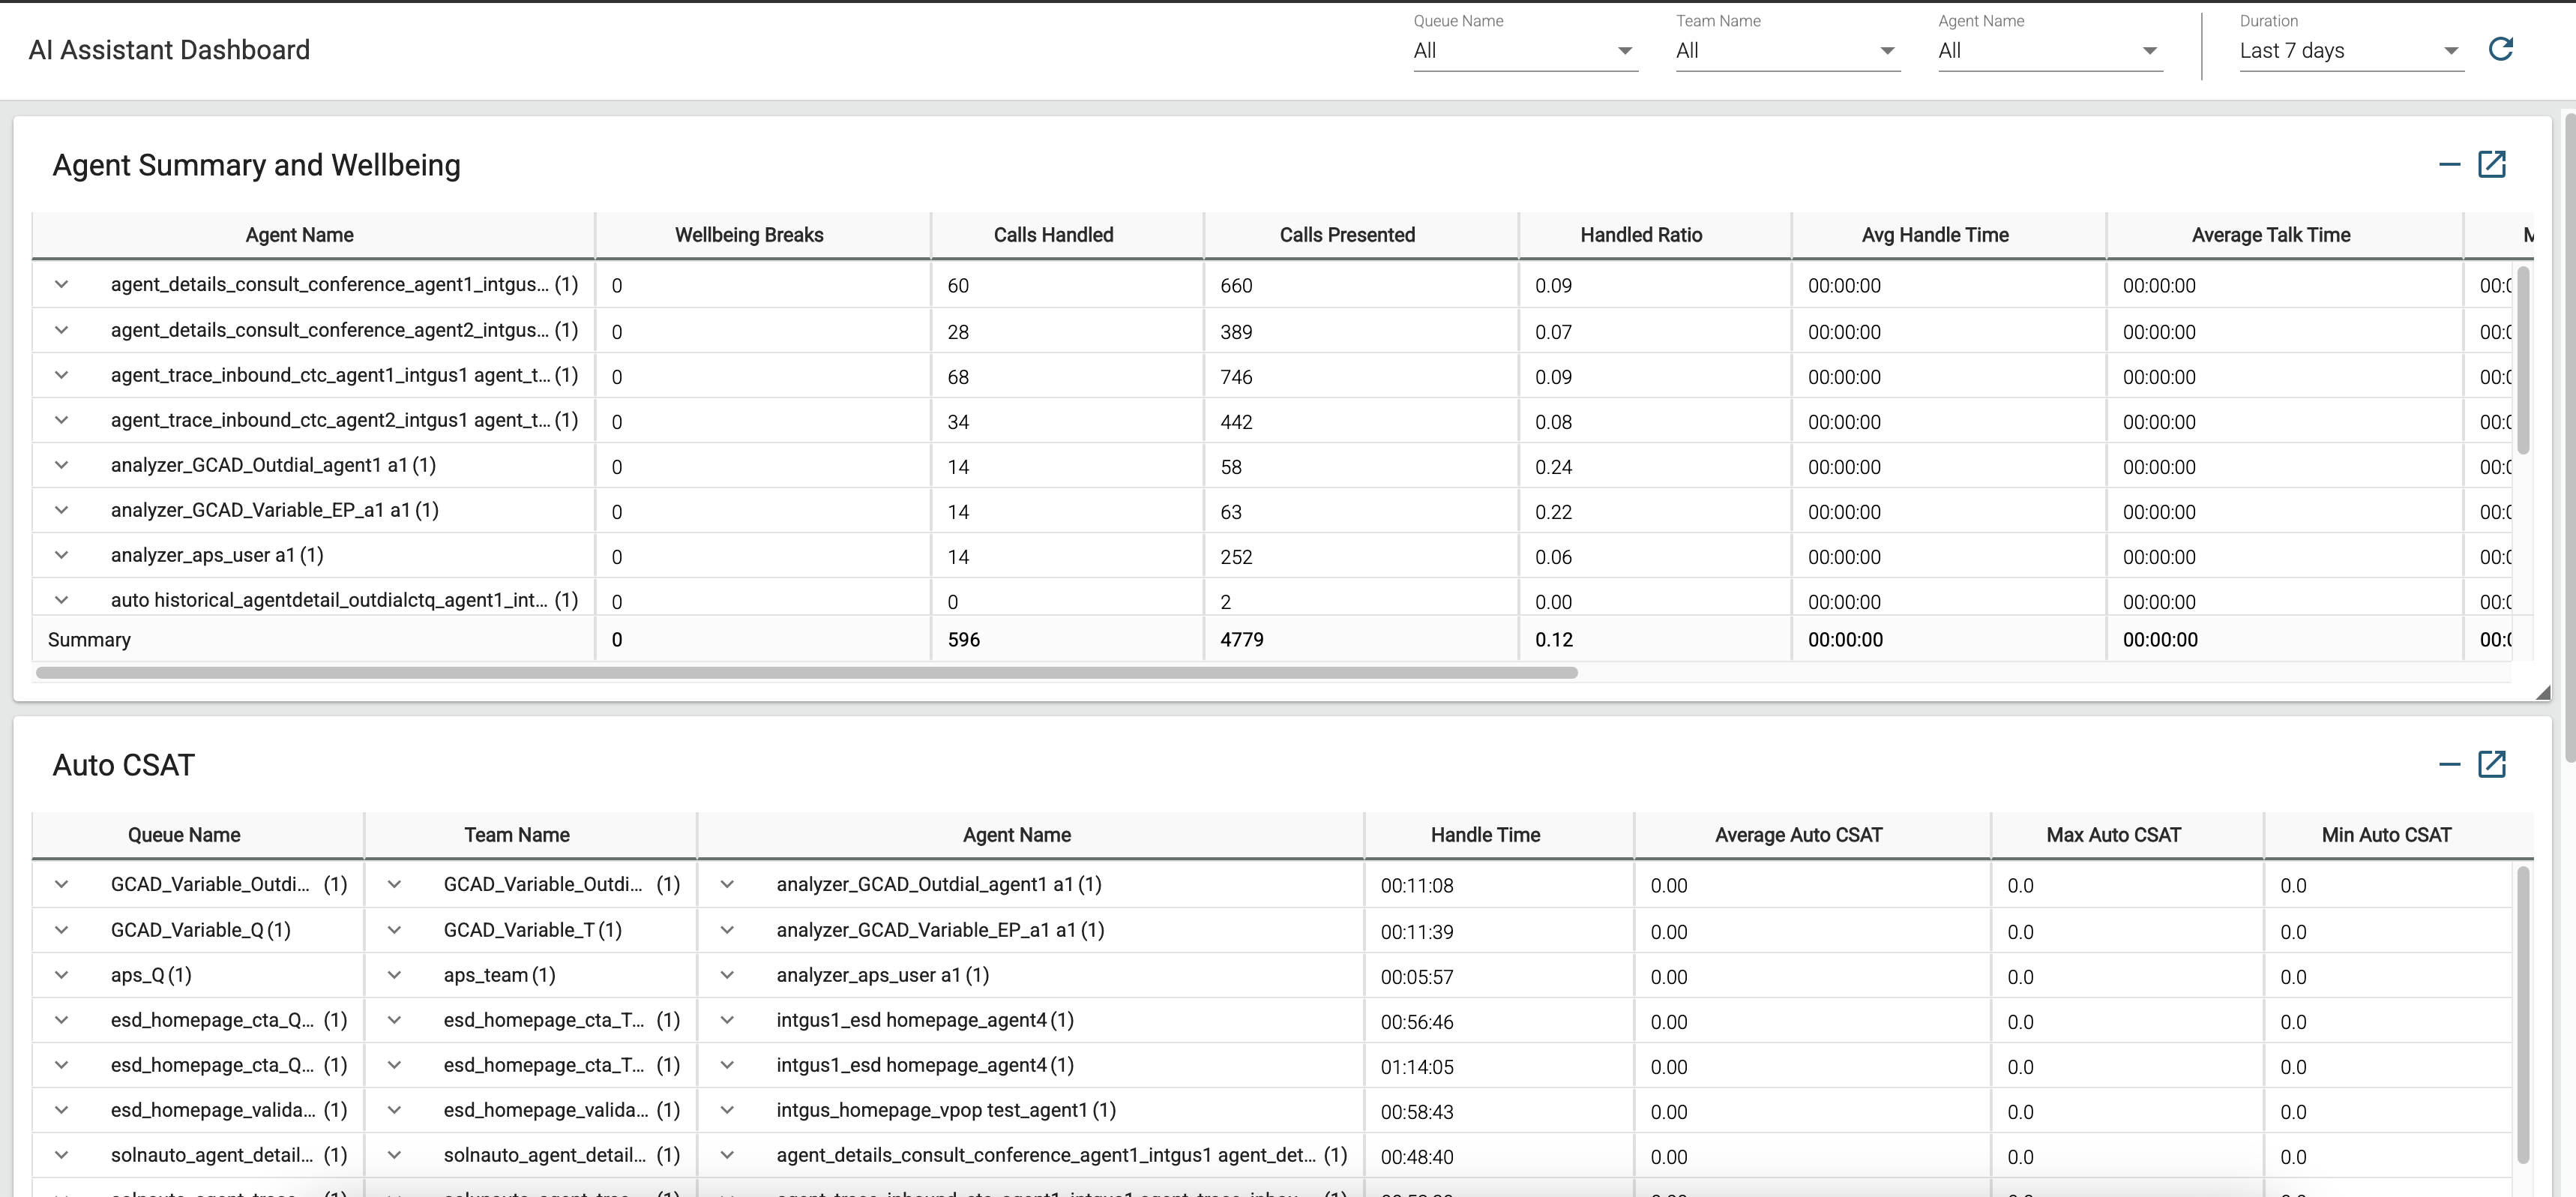
Met het AI Assistant-dashboard kunt u de verschillende functies van de AI Assistant die binnen uw organisatie zijn geïmplementeerd, controleren en evalueren. Dit dashboard biedt gedetailleerde gegevens en analysegegevens, waardoor u beter kunt begrijpen in hoeverre de AI Assistant werkt en wat de impact is op uw activiteiten.
Het bevat de volgende rapporten:
- Het rapport Agent Wellness Breaks biedt inzicht in de wellness-pauzes die aan agenten worden aangeboden.
- Het auto-AAN-DE-24-rapport geeft inzicht in de trends in de entrends.
- Het rapport Overzichten verbroken gesprekken biedt inzage in de verbroken oproepen.
- Het overzichtsrapport agent biedt inzicht in de werklast en prestaties van de agent.
- Het rapport Real-time omzettingen biedt inzicht in het gebruik van de real-time omzettingen door agenten van contactcenters.
- Trending Topic Analytics - Onderwerpen en Overzichtsrapport onderwerp bieden inzicht in de beste contactstuurprogramma's voor het contactcenter.
- Het rapport REAL-Time assist-KPI's geeft inzicht in hoe agenten van contactcentra de real-time assistentie in het contactcentrum gebruiken.
Pad naar rapport: Dashboard > Standaardrapporten > Historische rapporten > Agentrapporten
Type uitvoer: tabel
AI Assistant dashboard en rapporten worden alleen weergegeven als uw organisatie is voorzien van AI Assistant add-on.
Agent Wellness Pauzes
Dit rapport biedt uitgebreide informatie over het aantal wellness-pauzes dat aan agenten is geboden. Het helpt u de effectiviteit van de wellnessfunctie binnen uw organisatie te evalueren.
Gebruik dit rapport om effectief de toepassing van de agent en klanttevredenheid te volgen, te analyseren en te optimaliseren.
Hieronder volgen de belangrijkste inzichten binnen het rapport Agent Wellness Breaks:
- Wellness Breaks—Hoeveel wellness-pauzes heeft een agent ontvangen in een bepaalde periode?
- Klantentevredenheid—Wat is de invloed van de wellness-functie op de klanttevredenheid en hoe zijn de SCORES van DE ENE OP DE andere tijd veranderd?
- Vergelijkende analyse— Hoe worden de gegevens van het overzicht van agenten vergeleken met die van agenten waarvoor deze functie niet is ingeschakeld?
Zie voor meer informatie het gedeelte 'Veelgestelde vragen (VEELgestelde vragen)' van het artikel "De werking van de agent verbeteren met burn-outdetectie en wellness-pauzes ".
Pad naar rapport: Standaardrapporten > Transitierapporten
Het rapport Overzicht agent en Een dekbaarheid bevat één rij voor elke agent. Elke rij bevat een overzicht van de activiteiten van een agent.
Type uitvoer: tabel
Parameters die beschikbaar zijn in de tabel:
|
Parameter |
Beschrijving | Formule |
|---|---|---|
|
Agentnaam |
De naam van de agent. Gebruikt als: rijsegment |
|
| Wellness Vakanties |
Het aantal geautomatiseerde vakantiepauzes die worden aangeboden aan agenten op basis van inzichten van berekeningen van de burn-outdetectie van agenten. |
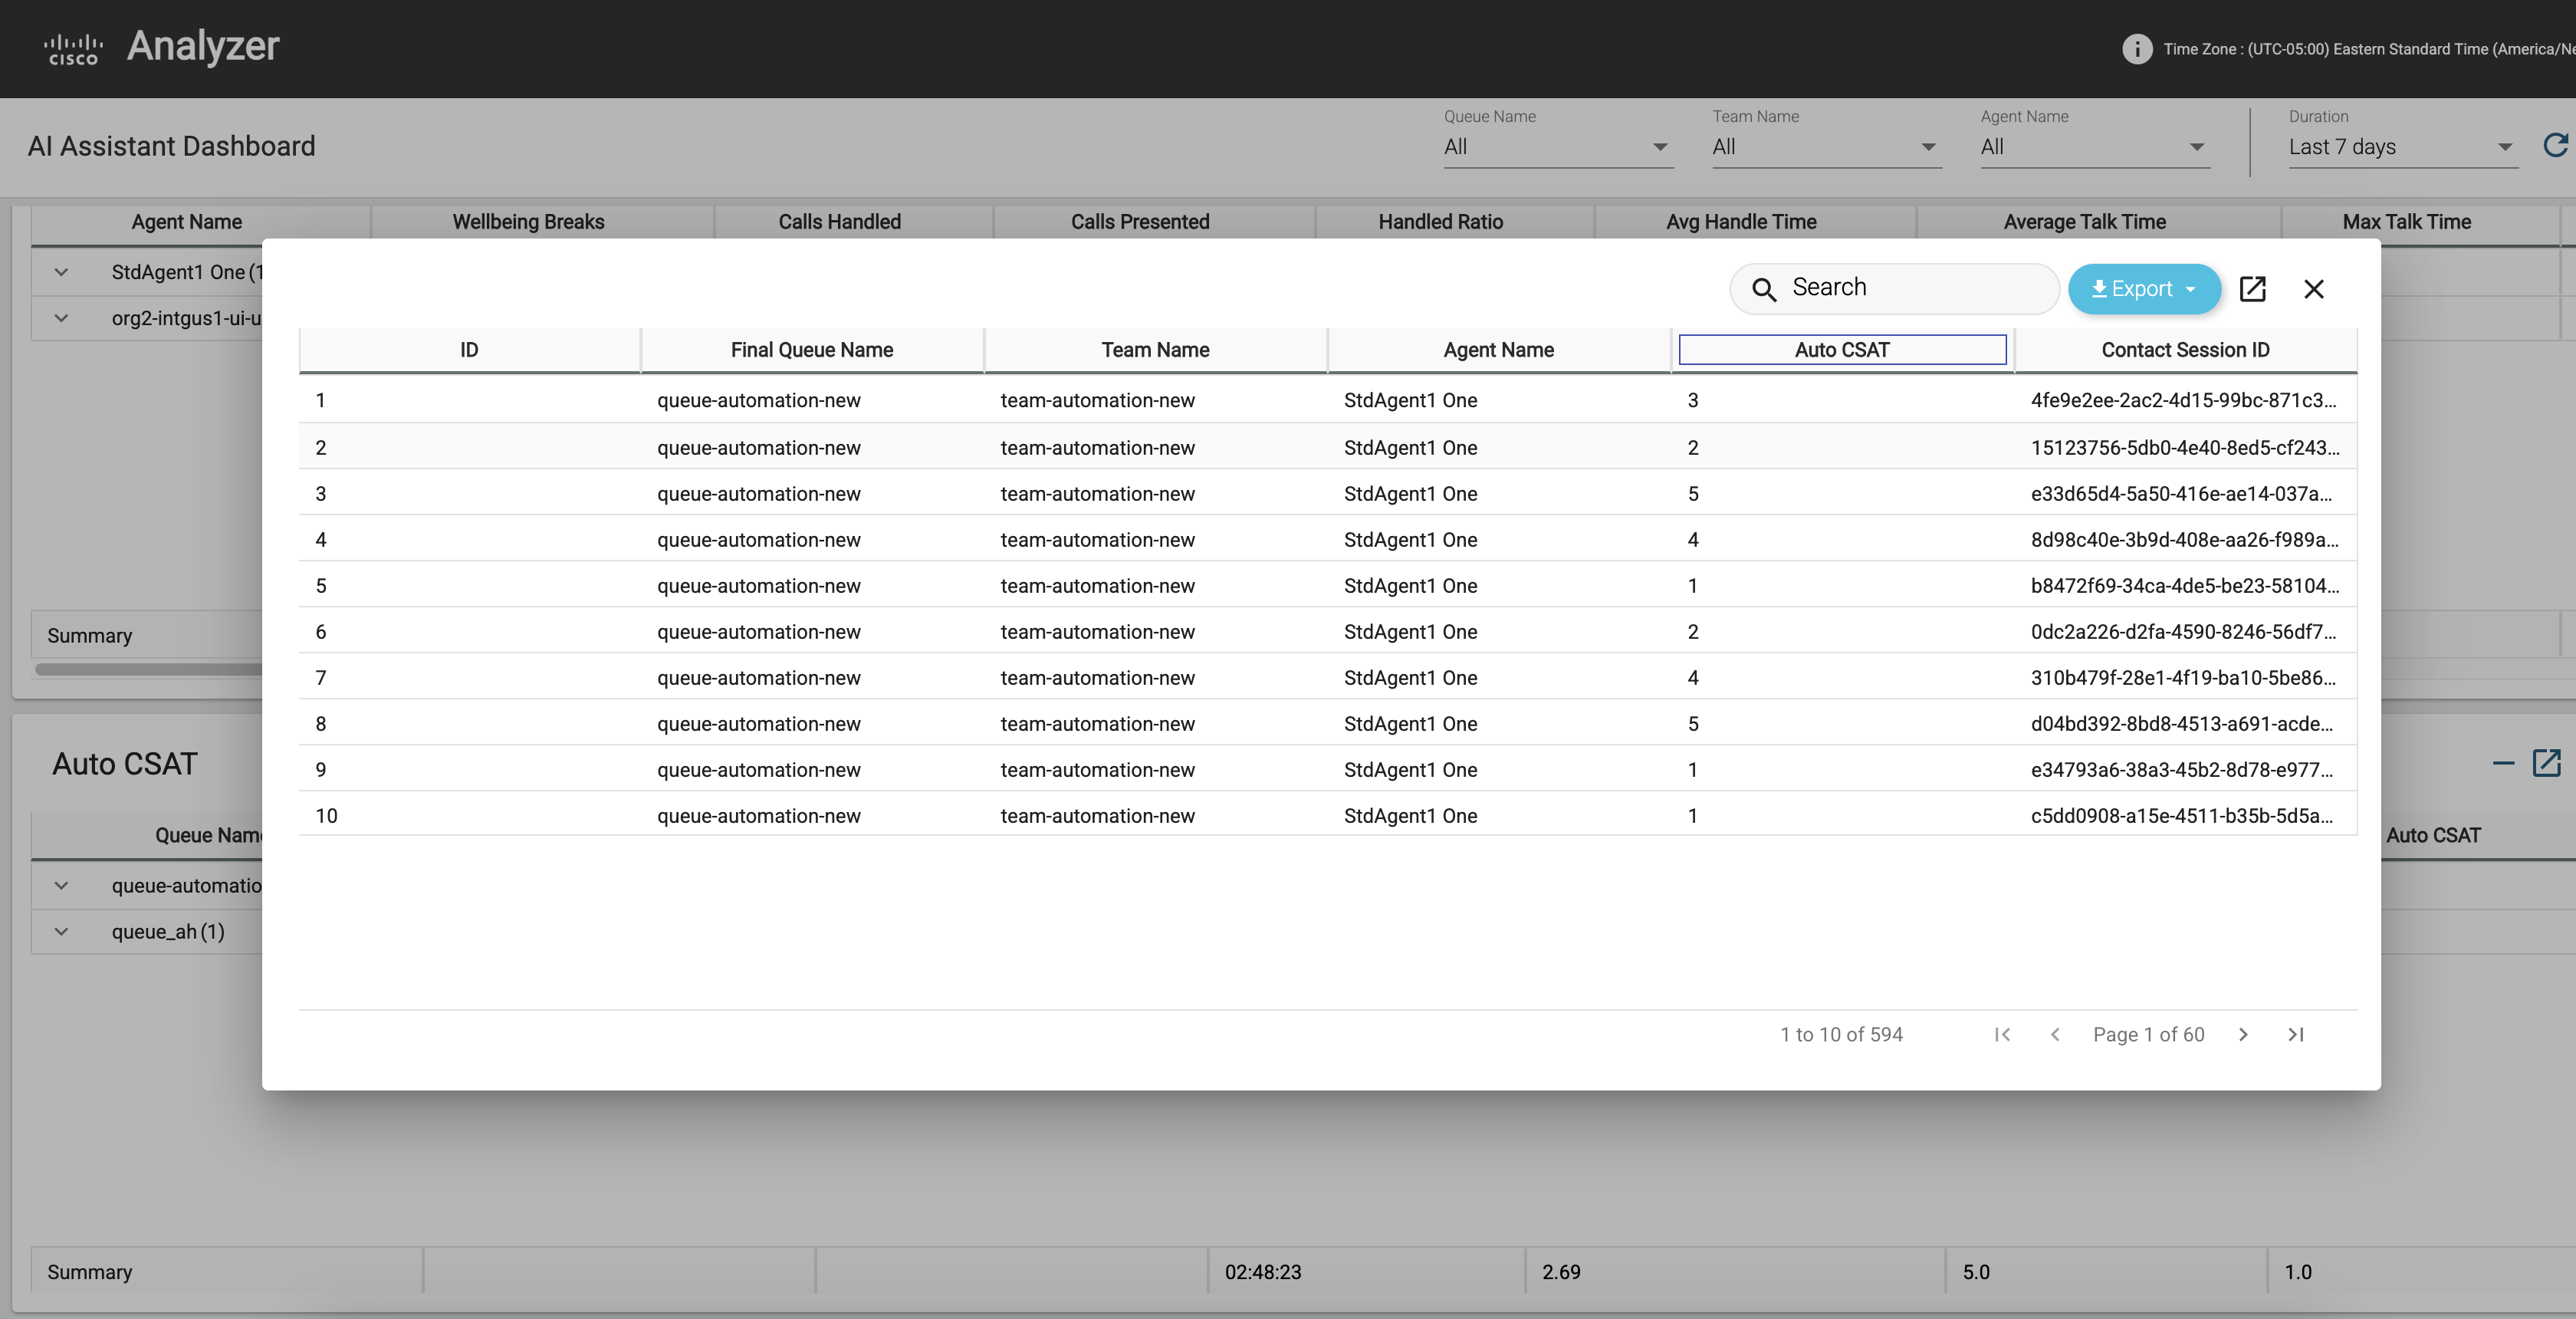
Auto EN AAN DEN 20120
Dit rapport helpt u bij het controleren van trends op het gebied van klantentevredenheid (RESELLERST), zodat u kunt beoordelen hoe wellness pauzes van invloed zijn op de weerslag van agents op de en prestaties van agents, die in TURN van invloed zijn op de klanttevredenheid.
Hieronder volgen de belangrijkste inzichten waarin het Auto SNELTOETS rapport is opgenomen:
- Insights op agentniveau—Wat zijn de Automatische WIDGETT-scores voor interacties die door een specifieke agent zijn afgehandeld en wat zijn de gemiddelde, minimum- en maximumtrends voor die agent?
- Inzichten op teamniveau — Wat zijn de automatische EN VOLGENDE scores voor interacties die door een specifiek team zijn afgehandeld, en wat zijn de gemiddelde, minimale en maximale trends voor dat team
- Insights op wachtrijniveau — Wat zijn de Automatische ENT-scores voor interacties in een specifieke wachtrij, en wat zijn de gemiddelde, minimum- en maximumtrends voor die wachtrij?
- Vergelijkende analyse — Hoe verhoudt DE UW SCORES van verschillende agenten, teams en wachtrijen tot stand?
- Gebieden van verbetering — Op welke gebieden is coaching en training nodig om de prestaties van agenten te verbeteren?
- Interaction Audit — Welke interacties hebben verdere controles of klanten follow-ups nodig?
- Operationele verbeteringen — Op welke gebieden is er behoefte aan operationele of procesverbeteringen?
Zie voor meer informatie de sectie "Veelgestelde vragen (VEELgestelde vragen)" van het artikel Klanttevredenheid met meten .
Het rapport Auto OMA bevat één rij voor elke agent. Elke rij bevat een overzicht van de activiteiten van een agent.
Pad naar rapport: Standaardrapporten > Historische rapporten > Agentrapporten
Type uitvoer: tabel
Parameters die beschikbaar zijn in de tabel:
|
Parameter |
Beschrijving | Formule |
|---|---|---|
|
Agentnaam |
De naam van de agent. Gebruikt als: rijsegment |
|
| Naam wachtrij | De naam van een wachtrij. Gesprekken worden verplaatst van een toegangspunt naar een wachtrij en worden vervolgens omgeleid naar agenten. | Naam wachtrij |
| Teamnaam |
De naam van een team. Gebruikt als: rijsegment |
|
| Gemiddelde Auto DEZET |
Gemiddelde van de door AI gegenereerde automatische klanttevredenheidsscores |
|
| Max Auto AAN DEN 2012 |
Hoogste voorspelde automatische klanttevredenheidsscore |
|
| Min. Auto AAN DE ENE DEN 2012 |
Laagste voorspelde automatische klanttevredenheidsscore |
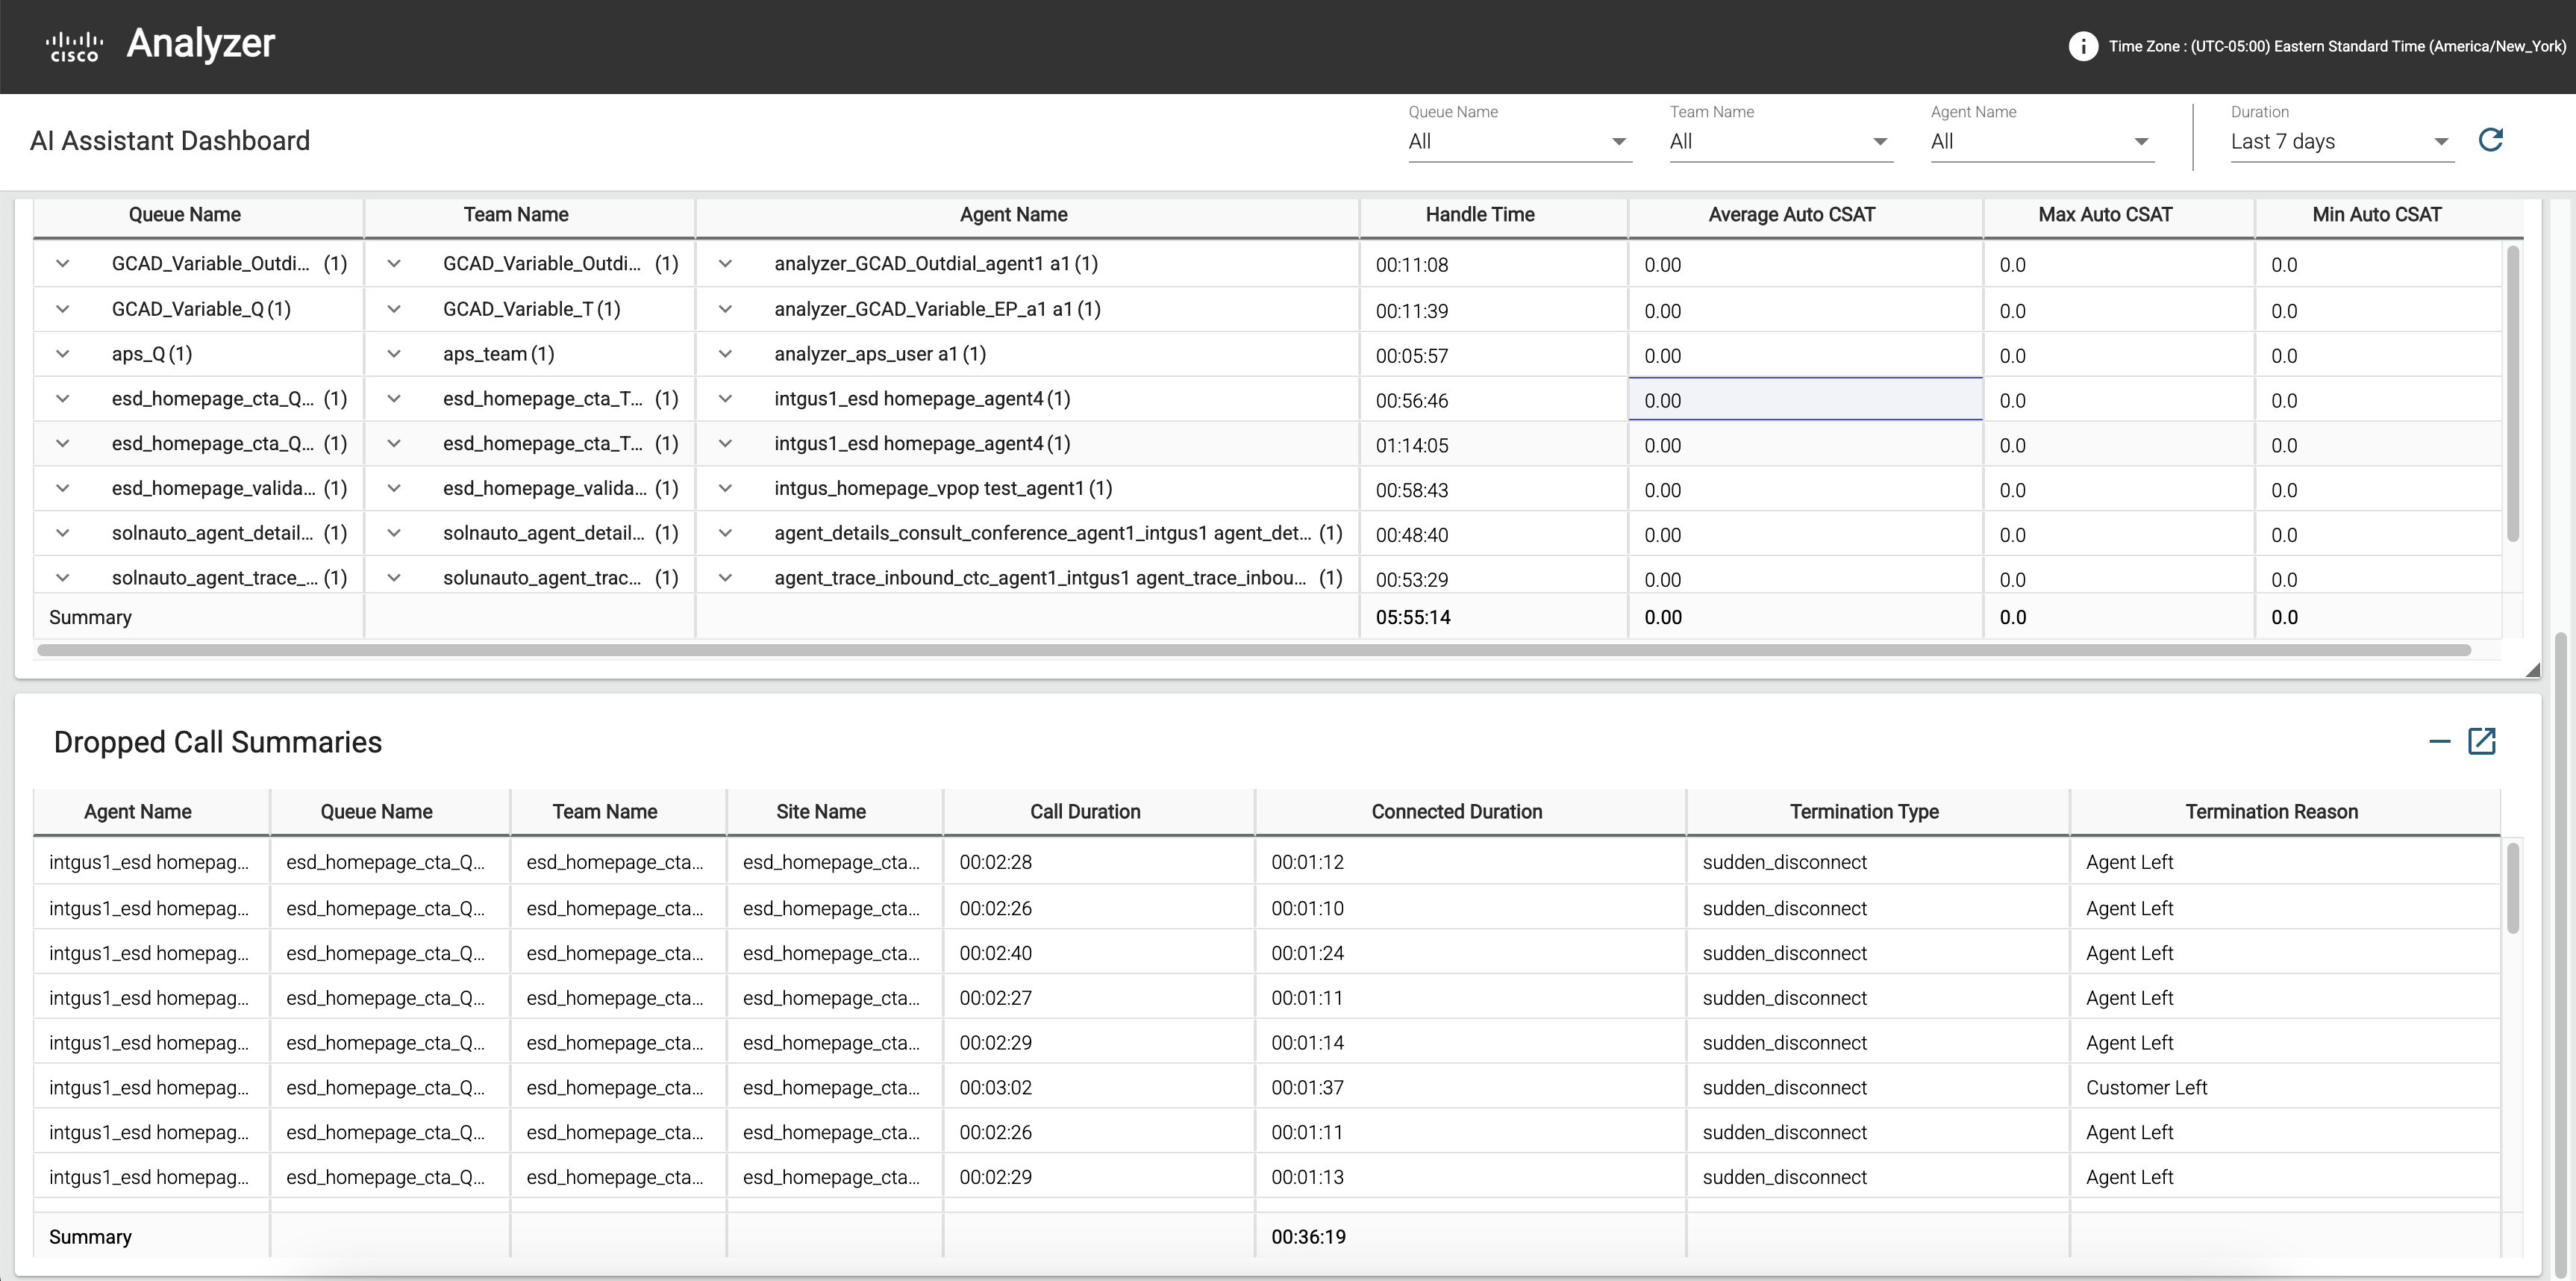
Overzichten verbroken gesprekken
Dit rapport biedt inzicht in de verbroken oproepen en evalueert de betekenis van het overzicht van verbroken gesprekken.
De totale gespreksduur is het aantal minuten dat klanten hebben besteed aan gesprekken die niet correct zijn beëindigd. Als overzichten voor het beëindigen van gesprekken zijn ingeschakeld voor de organisatie en deze klanten terugbellen, is dit de hoeveelheid tijd die kan worden verminderd met het afhandelen van gesprekken.
Een verbroken oproep wordt gecategoriseerd als een oproep met het type beëindiging dat is verlaten, plotselinge verbroken verbinding of doorverbindfout of een beëindigingsreden van een systeemfout of een time-out in wachtrij.
Hieronder staan de belangrijkste inzichten uit het rapport Overzichten verbroken gesprekken:
- Voordelen voor de organisatie: hoe werkt het inschakelen van overzichten voor het beëindigen van gesprekken ten goede aan een organisatie? Wat is de potentiële verbetering die op het aanzien van de verwerkingstijd kan worden aangebracht?
- De totale duur van gesprekken bepalen: wat is de totale duur van gesprekken die niet correct zijn beëindigd?
- De gesprekstypen identificeren. Welke typen gesprekken worden beschouwd als beëindigd?
- Aantal gespreksdruppels - Hoeveel gespreksdruppels ondervinden mijn klanten?
- De oorzaak van gespreksdruppels vaststellen: wat is de belangrijkste oorzaak van gespreksdruppels die mijn klanten ondervinden?
Zie voor meer informatie het gedeelte 'Veelgestelde vragen' van het artikel Verbeter uw efficiëntie met AI-gegenereerde overzichten .
Pad naar rapport: Standaardrapporten > Historische rapporten > Agentrapporten
Type uitvoer: tabel
Het rapport Overzichten verbroken gesprekken bevat één rij voor elke agent. Elke rij bevat een overzicht van de activiteiten van een agent.
Parameters die beschikbaar zijn in de tabel:
|
Parameter |
Beschrijving | Formule |
|---|---|---|
|
Agentnaam |
De naam van de agent. Gebruikt als: rijsegment |
|
| Naam wachtrij | De naam van een wachtrij. Gesprekken worden verplaatst van een toegangspunt naar een wachtrij en worden vervolgens omgeleid naar agenten. | Naam wachtrij |
| Teamnaam |
De naam van een team. Gebruikt als: rijsegment |
|
| Locatienaam |
De callcenterlocatie waarnaar een oproep is omgeleid. Gebruikt als: rijsegment |
|
| Gespreksduur |
De tijd die is verstreken tussen de begintijd en eindtijd van het gesprek. |
|
| Beëindigingstype |
Een tekstreeks die aangeeft hoe een gesprek is beëindigd. |
Waarde van het beëindigingstype |
| Reden beëindiging |
De reden van het beëindigen van het contact. Dit kan een van de volgende redenen zijn:
|
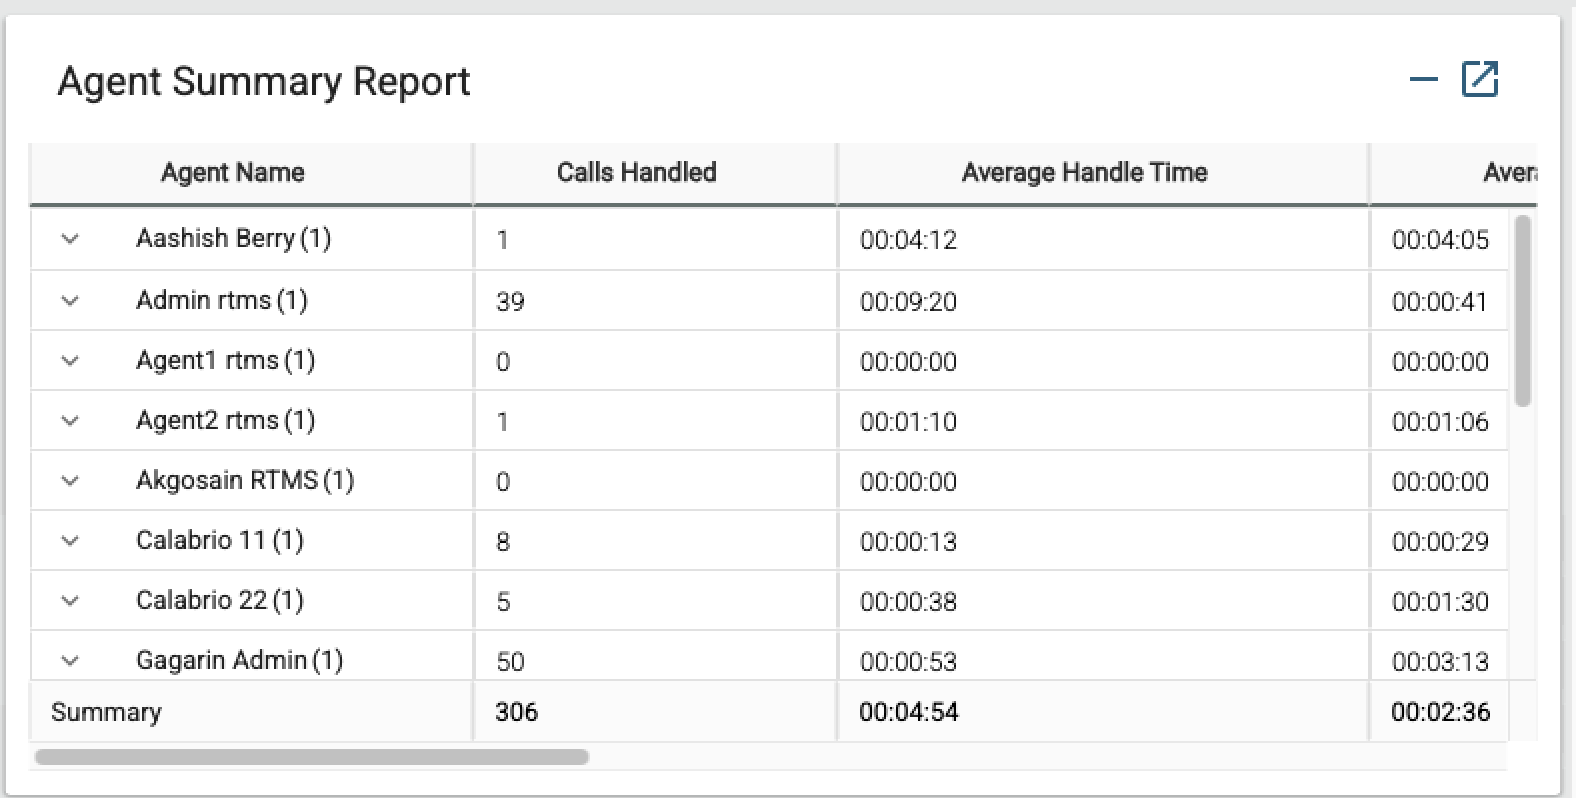
Rapport Overzicht agent
Dit rapport biedt uitgebreide informatie over de werklast- en prestatiecijfers van de agent. Het helpt u de effectiviteit van de wellnessfunctie binnen uw organisatie te evalueren.
Gebruik dit rapport om de prestaties van agenten en klanttevredenheid effectief te volgen, analyseren en optimaliseren.
Hieronder staan de belangrijkste inzichten in het rapport Overzicht agent:
- Werklast en prestaties—Wat waren de werklast en prestaties van de agent in die periode, en hoe zijn deze meetwaarden verbeterd sinds de wellnessfunctie werd ingeschakeld?
- Klantentevredenheid—Wat is de invloed van de wellness-functie op de klanttevredenheid en hoe zijn de SCORES van DE ENE OP DE andere tijd veranderd?
Pad naar rapport: Standaardrapporten > Historische rapporten > Agentrapporten
Het overzichtsrapport agent bevat één rij voor elke agent. Elke rij bevat een overzicht van de activiteiten van een agent.
Type uitvoer: tabel
Parameters die beschikbaar zijn in de tabel:
|
Parameter |
Beschrijving | Formule |
|---|---|---|
|
Agentnaam |
De naam van de agent. Gebruikt als: rijsegment |
|
|
Gesprekken afgehandeld |
Aantal inkomende gesprekken dat is verbonden met een agent.
|
Aantal van naam afrondingscode |
| Gemiddelde verwerkingstijd | Gemiddelde verwerkingstijd voor alle oproepen die de agent heeft behandeld. | Totale verwerkingstijd / afgehandelde gesprekken |
| Gemiddelde tijd in gesprek | De gemiddelde tijd die een agent aan een gesprek heeft besteed. | Gemiddelde duur verbonden |
| Maximale tijd in gesprek | De maximale tijd die een agent aan een gesprek besteedt. | |
| Gem. wachttijd | De gemiddelde tijd die een agent een gesprek in de wachtstand heeft gezet. |
Gemiddelde duur in wacht |
| Maximale wachttijd | De maximale tijd die een agent een gesprek in de wachtstand heeft gezet. | Maximale duur in wacht |
| Gemiddelde werktijd |
De gemiddelde tijd die een agent aan werk heeft besteed na het verbreken van de verbinding of het doorverbinden van een gesprek. |
Gemiddelde afrondingsduur |
| Maximale werktijd |
De maximale tijd die een agent aan werk heeft besteed na het verbreken van de verbinding of het doorverbinden van een gesprek. |
Maximale duur afronden |
KPI's voor real-time omzetting
Dit rapport biedt uitgebreide informatie over het gebruik van de functie real-time omzettingen door agenten van contactcenters. Het helpt organisaties bij het controleren van de aflevering van omzettingen tijdens gesprekken en bij het beoordelen van de impact op de prestaties van de agenten en de klanttevredenheid.
Hieronder staan de belangrijkste inzichten die het rapport Real-time omzettingen biedt:
- Beschikbaarheid van omzettingen: hiermee wordt bijgehouden of real-time omzettingen beschikbaar waren tijdens elk gesprek, en worden de gebruikspatronen en de beschikbaarheid over verschillende wachtrijen gemarkeerd.
- Gebruiksgegevens: details over het aantal agenten dat omzetting gebruikt, het totale aantal verwerkte omzettingsminuten en feedbackmetrieken, waardoor u beter kunt begrijpen hoe goed de functie wordt gebruikt en de effectiviteit ervan.
Dit rapport bestaat uit een rapport en twee kaarten:
- KPI's voor real-time omzetting
- Totaal aantal gesprekken met transcriptskaart
- Gemiddelde afhandelingstijd met transcriptskaart
Pad naar rapport: Standaardrapporten > Historische rapporten > Agentrapporten
Het rapport Real-time omzettingen bevat één rij voor elke agent. Elke rij bevat een overzicht van de activiteiten van een agent.
Dit rapport bevat alleen de interacties waarvoor het kanaaltype 'telefonie' is.
|
Parameter |
Beschrijving |
Formule |
|---|---|---|
| Naam wachtrij | Geeft de naam van een wachtrij weer. Gesprekken worden verplaatst van een toegangspunt naar een wachtrij en worden vervolgens naar agenten geleid. | Naam wachtrij |
| Teamnaam | Geeft de naam van een team weer. Gebruikt als: rijsegment |
|
| Agentnaam | Geeft de naam van de agent weer. Gebruikt als: rijsegment |
|
| Gem. AUTO DEZET met transcripts | Geeft het gemiddelde weer van de door AI gegenereerde automatische klanttevredenheidsscores, waarbij real-time omzetting is ingeschakeld. | |
| Gemiddelde afrondingstijd met transcripts | Geeft de gemiddelde tijd weer die is besteed aan het afronden van de afgehandelde contacten waarvoor real-time omzetting is ingeschakeld. | |
| Totaal gesprekken met transcripts | Het totale aantal oproepen waarvoor real-time omzetting is ingeschakeld. | |
| Gemiddelde afhandelingstijd met transcripts | De gemiddelde afhandelingstijd van alle door de agent afgehandelde gesprekken, waarvoor real-time omzettingen is ingeschakeld. |
Totaal gesprekken met transcripts
Dit rapport geeft het totaal aantal afgehandelde contacten weer waarvoor real-time omzettingen beschikbaar zijn en het kanaaltype 'telefonie' is.
Pad naar rapport: Standaardrapporten > Historische rapporten > Agentrapporten
Uitvoertype: kaart
Gemiddelde afhandelingstijd met telefonie
Dit rapport geeft de gemiddelde afhandelingstijd weer voor alle oproepen die door de agent zijn afgehandeld, waarbij real-time omzettingen beschikbaar zijn en het kanaaltype 'telefonie' is.
Pad naar rapport: Standaardrapporten > Historische rapporten > Agentrapporten
Uitvoertype: kaart
Onderwerp analytics-rapporten
Met toegang tot de belangrijkste onderwerpen en gespreksstuurprogramma's in Analyzer kunnen teams gegevensgestuurde beslissingen nemen. Dit inzicht stelt gebruikers in staat om de bezetting te optimaliseren, de training van de agent, de routeringsstrategieën te verbeteren en de automatisering te verhogen.
Het rapport Topic Analytics biedt twee belangrijke inzichten:
- Trending Topics (Trending Topics): hiermee wordt bijgehouden hoe het aantal interacties voor specifieke onderwerpen na verloop van tijd verandert om patronen en trends in de stuurprogramma's voor klantencontacten te identificeren.
- Overzicht onderwerp analyse - Bekijk het volume van elk onderwerp, de gemiddelde afhandelingstijd en het gemiddelde auto-EN-EN-desinterne auto-EN:200 om zakelijke beslissingen te nemen en de ervaring van de klanten te verbeteren.
Dit rapport bestaat uit de volgende twee rapporten:
- Trending Topics (grafiek)
- Overzicht onderwerp analytics
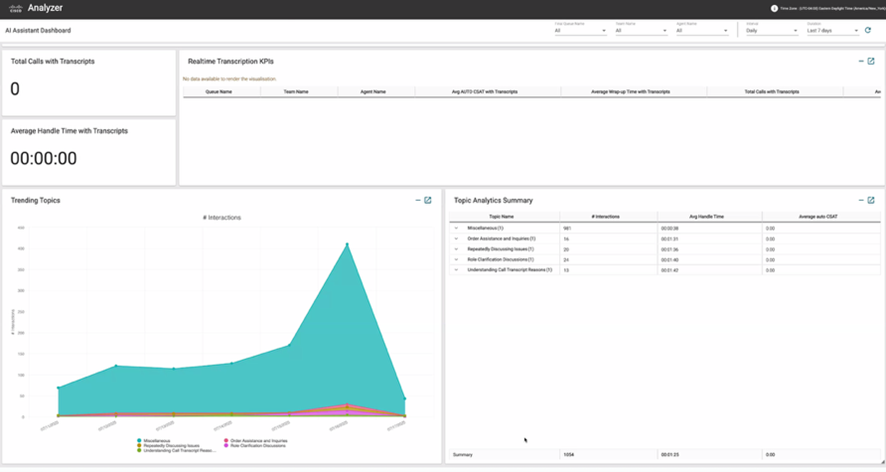
Trending Topics (grafiek)
De grafiek met trending onderwerpen geeft aan hoe vaak elk onderwerp wordt besproken of gebruikt gedurende een bepaalde periode. Het helpt bij het herkennen van opkomende trends door te markeren welke onderwerpen in de loop der tijd steeds meer of minder populair worden.
| Parameter | Beschrijving | Formule |
|---|---|---|
| Onderwerpsnaam | Een door AI gegenereerd label dat een samenvatting biedt van de belangrijkste reden achter interactie met klanten. Onderwerpen worden gegenereerd door vergelijkbare contactstuurprogramma's voor interacties te clusteren in zinvolle labels. In het veld wordt niet van toepassing weergegeven totdat de interactie wordt geanalyseerd door Topic Analytics. | |
| #Interactions | Het aantal interacties waarvoor een gegeven onderwerpsnaam wordt opgegeven. |
Overzicht onderwerp analytics
Het rapport Topic Analytics aggregaten geeft de prevalentie van elk onderwerp weer, samen met belangrijke prestatie-indicatoren zoals Gemiddelde afhandelingstijd en Gemiddelde auto- EN daghandeling. In dit rapport kunt u evalueren hoeveel tijd agenten aan specifieke onderwerpen besteden en klanttevredenheid met betrekking tot die onderwerpen meten.
| Parameter | Beschrijving | Formule |
|---|---|---|
| Onderwerpsnaam | Een door AI gegenereerd label dat een samenvatting biedt van de belangrijkste reden achter interactie met klanten. Onderwerpen worden gegenereerd door vergelijkbare contactstuurprogramma's voor interacties te clusteren in zinvolle labels. In het veld wordt niet van toepassing weergegeven totdat de interactie wordt geanalyseerd door Topic Analytics. | |
| #Interactions | Het aantal interacties waarvoor een gegeven onderwerpsnaam wordt opgegeven. | |
| Gem. Auto EN 2012 |
Gemiddelde van de door AI gegenereerde automatische klanttevredenheidsscores. | |
| Gem. afhandelingstijd | Gemiddelde afhandelingstijd voor gesprekken die overeenkomen met het onderwerp. |
Rapporten aanpassen met Onderwerpenanalyse
Onderwerpnaam en Contactstuurprogramma zijn nu beschikbaar als aangepaste velden in Analyzer. U kunt deze opnemen in nieuwe of bestaande aangepaste rapporten.
Voer voor een nieuw rapport de volgende stappen uit:
- Navigeer naar Home > De > Maak nieuwe > Een dek de nieuwe > een dekbeurt doen.
- Afhankelijk van uw rapportagevereisten kunt u zoeken naar onderwerpsnaam en/of contactstuurprogramma en deze velden toevoegen als rij- of kolomsegmenten.
Zoek voor een bestaand rapport naar de onderwerpsnaam of de contactpersoonsstuurprogramma of beide en neem deze velden op als rijsegment of kolomsegment.
Onderwerpgegevens opvragen met API
We hebben twee nieuwe velden toegevoegd aan de Customer Session Repository (CSR), die u kunt openen via de Pagina zoeken API. Raadpleeg Documentatie voor ontwikkelaars voor documentatie over APIzoeken.
| Parameter | Beschrijving | Formule |
|---|---|---|
| Onderwerpsnaam | Een door AI gegenereerd label dat een samenvatting biedt van de belangrijkste reden achter interactie met klanten. Onderwerpen worden gegenereerd door vergelijkbare contactstuurprogramma's voor interacties te clusteren in zinvolle labels. In het veld wordt niet van toepassing weergegeven totdat de interactie wordt geanalyseerd door Topic Analytics. | |
| Stuurprogramma contact |
Een door AI gegenereerde samenvatting van de eerste reden van het contact. In het veld wordt niet van toepassing weergegeven totdat de interactie wordt geanalyseerd door Topic Analytics. |
- Klanten met bestaande onderwerpgegevens kunnen een bewerkings- of klonentaak voor een oude verzameling activeren om die gegevens beschikbaar te maken in Analyzer.
- Als een interactie in meerdere verzamelingen verschijnt, wordt alleen het laatst toegewezen onderwerp weergegeven.
- Voor interacties die nog niet zijn geanalyseerd, worden de velden Onderwerpsnaam en Contactstuurprogramma weergegeven als 'Null'.
- Het is op dit moment niet mogelijk om kopieën van standaardrapporten te maken in het AI Assistant Dashboard.
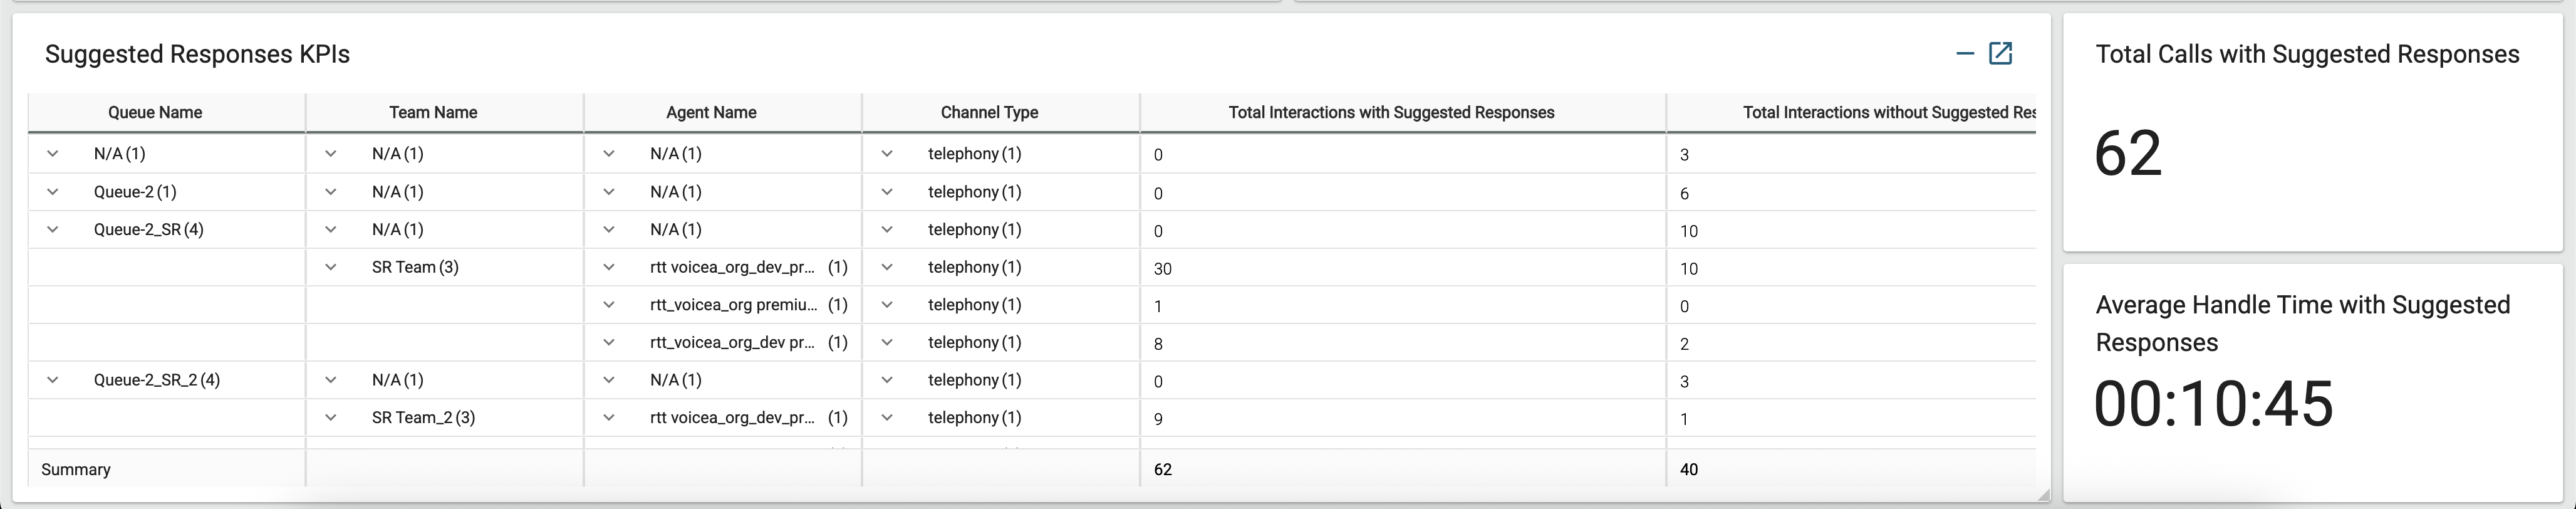
Real-Time assist KPI's
Dit rapport biedt uitgebreide informatie over hoe agenten van contactcentra real-time assistentie in contactcenter gebruiken. Het helpt organisaties de invloed van real-time assistentie op de prestaties van agents en klanttevredenheid tijdens gesprekken en interacties te traceren.
Hieronder staan de belangrijkste inzichten uit het rapport Real-Time Assist KPI's:
- Beschikbaarheid van real-time assistentie: controleert de beschikbaarheid van Real-Time assistentie tijdens elke interactie en identificeert de gebruikstrends en de beschikbaarheid van verschillende wachtrijen.
- Gebruikscijfers: geeft het aantal agenten weer dat gebruikmaakt van Real-Time assistentie en analyseert de impact op de gespreksduur, de raadplegingspercentages en de klanttevredenheid.
Dit rapport bestaat uit een rapport en twee kaarten:
- Real-Time assist KPI's
- Totaal aantal gesprekken met kaart voor real-time assistentie
- Gemiddelde afhandelingstijd met kaart voor real-time assistentie
Pad naar rapport: Standaardrapporten > Historische rapporten > Agentrapporten
Het rapport KPI's voor real-time ondersteuning bevat één rij voor elke agent. Elke rij bevat een overzicht van de activiteiten van een agent.
|
Parameter |
Beschrijving |
Formule |
|---|---|---|
| Naam wachtrij | Geeft de naam van een wachtrij weer. Gesprekken worden verplaatst van een toegangspunt naar een wachtrij en worden vervolgens naar agenten geleid. | Naam wachtrij |
| Teamnaam | Geeft de naam van een team weer. Gebruikt als: rijsegment |
|
| Agentnaam | Geeft de naam van de agent weer. Gebruikt als: rijsegment |
|
| Kanaaltype | Hier wordt het mediatype weergegeven van de contactpersoon, zoals telefoon, e-mail of chat. Gebruikt als: rijsegment |
|
| Totale aantal interacties met real-time ondersteuning | Geeft het totaal aantal interacties met real-time ondersteuning in gebruik weer. | Aantal contactsessie-id |
| Totaal interacties zonder real-time hulp | Geeft het totaal aantal interacties weer zonder real-time ondersteuning in gebruik. | Aantal contactsessie-id |
| Gemiddelde aantal ruggespraak met real-time ondersteuning | Geeft het totaal aantal interacties met Real-Time ondersteuning in gebruik weer. | Som van het aantal consultaties |
| Gemiddeld aantal ruggespraak zonder real-time ondersteuning | Geeft het totaal aantal interacties weer zonder real-time ondersteuning in gebruik. | Som van het aantal consultaties |
| Gemiddelde afhandelingstijd met real-time ondersteuning | Geeft de gemiddelde interactieduur met real-time ondersteuning in gebruik weer. | (Som van Verbonden duur + Som van de afrondingsduur) / Aantal contactsessie-id) |
| Gemiddelde afhandelingstijd zonder real-time ondersteuning | Geeft de gemiddelde interactieduur zonder Real-Time assist in gebruik weer. | (Som van Verbonden duur + Som van de afrondingsduur) / Aantal contactsessie-id) |
| Gemiddelde wachttijd met real-time ondersteuning | Geeft de gemiddelde interactie in wachtstand met real-time hulp in gebruik weer. | Som van de duur in de wacht |
| Gemiddelde wachtduur zonder real-time ondersteuning | Geeft de gemiddelde interactie in de wachtstand weer zonder real-time ondersteuning in gebruik. | Som van de duur in de wacht |
| Gemiddelde afrondingstijd met real-time ondersteuning | Geeft de gemiddelde afrondingsduur van de interactie weer met real-time ondersteuning in gebruik. | Som van de afrondingsduur |
| Gemiddelde afrondingstijd zonder real-time hulp | Geeft de gemiddelde afrondingsduur van de interactie weer zonder real-time ondersteuning in gebruik. | Som van de afrondingsduur |
| Gemiddelde auto-ALS-DE-assist met real-time hulp | Toont de gemiddelde Interaction EN EN Real-Time Assist in gebruik. | Gemiddelde van Auto-AAN-DE-2010 |
| Gemiddelde auto-EN-EN zonder real-time assistentie | Toont de gemiddelde Interactie EEN en ander zonder Real-Time Assist in gebruik. | Gemiddelde van Auto-AAN-DE-2010 |
Totaal aantal gesprekken met real-time ondersteuning
Dit rapport geeft het totaal aantal afgehandelde contacten weer waarbij Real-Time assists beschikbaar zijn en het kanaaltype 'telefonie' is.
Rapportpad: standaardrapporten > historische rapporten > Mijn team en wachtrijstatistieken
Uitvoertype: kaart
| Parameter | Beschrijving | Formule |
|---|---|---|
| Totaal aantal gesprekken met real-time ondersteuning | Het totale aantal gesprekken met real-time ondersteuning in gebruik wordt weergegeven. | Aantal contactsessie-id (alleen telefoniekanaal) |
Gemiddelde afhandelingstijd met real-time ondersteuning
Dit rapport geeft de gemiddelde afhandelingstijd weer van alle door de agent afgehandelde gesprekken. In dit rapport zijn real-time assistentie beschikbaar en is het kanaaltype 'telefonie'.
Rapportpad: standaardrapporten > historische rapporten > Mijn team en wachtrijstatistieken
Uitvoertype: kaart
| Parameter | Beschrijving | Formule |
|---|---|---|
| Gemiddelde afhandelingstijd met real-time ondersteuning | Geeft de Gemiddelde gespreksduur weer wanneer Real-Time Assist in gebruik is | (Som van Verbonden duur + Som van de afrondingsduur) / Aantal contactsessie-id) (Alleen telefoniekanaal) |
KPI's na gesprek en overzicht midden gesprek
Dit rapport biedt uitgebreide inzichten in de effectiviteit en toepassing van DOOR AI gegenereerde interactieoverzichten binnen het contactcenter. Het helpt managers en supervisors bij te houden hoe agenten zowel overzichten na gesprekken als middengesprekken gebruiken, zodat organisaties de impact van AI op de productiviteit van agenten, afhandelingstijden en de algehele operationele efficiëntie kunnen meten.
Hieronder staan de belangrijkste inzichten die zijn verkregen in het rapport Overzicht van de KPI's na oproep en Overzicht midden gesprek:
- Samenvatting: controleert het maken en gebruik van DOOR AI gegenereerde overzichten voor verschillende wachtrijen, teams en agents en identificeert gebruikstrends.
- Operationele efficiëntiecijfers: analyseert de invloed van AI-overzichten op de workflow door belangrijke prestatie-indicatoren zoals gemiddelde consultduur, overdrachten en wachtrijgebeurtenissen tijdens interacties bij te houden.
Dit rapport bestaat uit twee tabellen en twee overzichtskaarten:
- Tabel KPI's na oproepoverzicht
- Tabel KPI's tijdens oproepoverzicht
- Totaal gesprekken met kaart overzichten na gesprekken
- Totaal gesprekken met kaart overzichten midden gesprekken
Pad naar rapport: Standaardrapporten > Historische rapporten > Agentrapporten
Parameters die beschikbaar zijn in de tabel:
|
Parameter |
Beschrijving |
|---|---|
|
Wachtrij / Team / Naam agent |
Het organisatorische hiërarchieniveau waarvoor de gegevens worden weergegeven. U kunt een drilldown maken van Wachtrij naar agent. |
|
Kanaaltype |
Het medium van de interactie (bijvoorbeeld Telefonie). |
|
Totaal interacties met overzichten |
Het totale aantal oproepen waarbij een DOOR AI gegenereerde samenvatting is gemaakt en aan de agent is gepresenteerd. |
|
Totaal interacties zonder overzichten |
Het totale aantal oproepen waarbij geen overzicht is gegenereerd of gebruikt. |
|
Gemiddelde consultduur |
(Midden gesprek) De gemiddelde tijd die agenten hebben besteed aan intern overleg, gebruikt om efficiëntiewinsten te meten. |
|
Aantal doorverbindingen |
(Midden gesprek) Het totaal aantal doorschakels dat is uitgevoerd tijdens het geselecteerde interval. |
|
Aantal in de wacht |
(Midden gesprek) Het totaal aantal gebeurtenissen in de wacht die zijn gestart tijdens consulten of doorververbindingen. |
Totaal gesprekken met kaart overzichten na gesprekken
Dit rapport geeft het totale aantal interacties weer waarbij een DOOR AI gegenereerd overzicht na een oproep is gemaakt en gepresenteerd aan de agent.
Rapportpad: standaardrapporten > historische > agentrapporten
Uitvoertype: kaart
| Parameter | Beschrijving |
|---|---|
| Totaal gesprekken met overzichten na gesprekken | Het totale aantal oproepen waarbij een door AI gegenereerd overzicht na gesprekken is gemaakt. |
Totaal gesprekken met kaart overzichten midden gesprekken
Dit rapport geeft het totale aantal interacties weer waarbij een door AI gegenereerd overzicht tijdens oproep is gemaakt en gepresenteerd aan de agent.
Rapportpad: standaardrapporten > historische > agentrapporten
Uitvoertype: kaart
| Parameter | Beschrijving |
|---|---|
| Totaal gesprekken met overzichten voor mid-gesprekken | Geeft het totale aantal oproepen weer waarbij een door AI gegenereerd overzicht van het midden van de oproep is gemaakt. |
Uw rapporten aanpassen en trendregeldiagrammen maken
U kunt uw rapporten aanpassen en trendregeldiagrammen maken. In de volgende secties wordt het rapport Auto AAN de grote lijn gebruikt om uit te leggen hoe u een rapport aanpast en hoe u trendregeldiagrammen maakt.
Het Auto ENT-rapport aanpassen in het AI Assistant-dashboard
U kunt uw rapport aanpassen in het dashboard AI Assistant. Hier vindt u de stappen om het rapport Auto AAN te passen en u kunt dezelfde benadering toepassen om andere rapporten aan te passen.
| 1 |
Meld u aan bij Analyzer. |
| 2 |
Ga naar . Selecteer het AI Assistant-dashboard en klik op de puntjes om de rapportopties weer te geven. Kies De optie Kopie maken om een aangepaste versie van het dashboard te maken. Klik op Opslaan als en sla het op in de gewenste map. |
| 3 |
Ga naar . Selecteer het Auto DEZE RAPPORT en klik op de puntjes om de rapportopties weer te geven. Kies De optie Kopie maken om een kopie van het rapport Auto DEZE te maken om deze indien nodig te wijzigen. Klik op Opslaan als en opslaan in de gewenste map. |
| 4 |
Enquêtes integreren:
|
| 5 |
Navigeer naar de map waar u uw aangepaste dashboard hebt opgeslagen en klik op Bewerken. Voeg bij Aan de knop Module het aangepaste Auto GADGETT-rapport dat u in stap 2 hebt gemaakt, toe aan het aangepaste AI Assistant Dashboard. Klik op Opslaan. 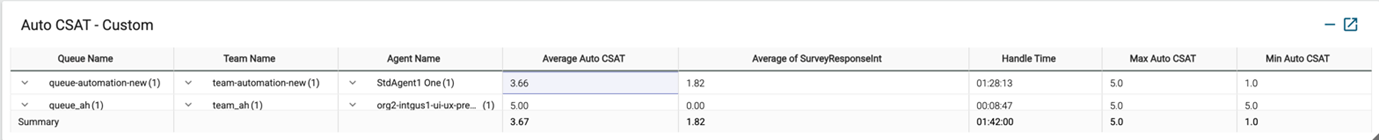
|
Trendlijndiagrammen maken
U kunt trendregeldiagrammen maken met uw rapporten. Hier volgen de stappen voor het maken van trend lijngrafieken met behulp van het rapport Auto DEZE REEKS om aan de hand van tijdsschommelingen in en om zo waardevolle inzichten te verkrijgen in de agentprestaties, de efficiëntie van het team en de trends op het gebied van klantervaringen. u kunt op dezelfde manier trendregeldiagrammen maken in andere rapporten.
| 1 |
Meld u aan bij Analyzer. |
| 2 |
Ga naar . Selecteer het AI Assistant-dashboard en klik op de puntjes om de rapportopties weer te geven. Kies Kopie maken om een aangepaste versie van het dashboard te maken. Klik op Opslaan als en sla het dashboard in de gewenste map op. |
| 3 |
Ga naar . Selecteer het Auto DEZE RAPPORT en klik op de puntjes om de rapportopties weer te geven. Kies Een kopie maken om een kopie van het Rapport Auto AAN TE passen. U kunt ook een bestaande aangepaste versie opnieuw gebruiken. |
| 4 |
De berekening van de gegevens aanpassen in de tabel Auto AAN: Stel in het gedeelte Berekenen het interval in op Dagelijks voor het volgen van de trend of de gewenste tijdsperiode. |
| 5 |
Wijzig het uitvoertype in lijngrafiek in de vervolgkeuzelijst Een in een van de vervolgkeuzelijstEn . |
| 6 |
Verwijder alle profielvariabelen en behoud alleen de Gem. auto ALS u zich focust op de kernmetrieken. |
| 7 |
Voeg de aangepaste trendlijngrafiek toe aan uw aangepaste AI Assistant dashboard. Klik op Opslaan. 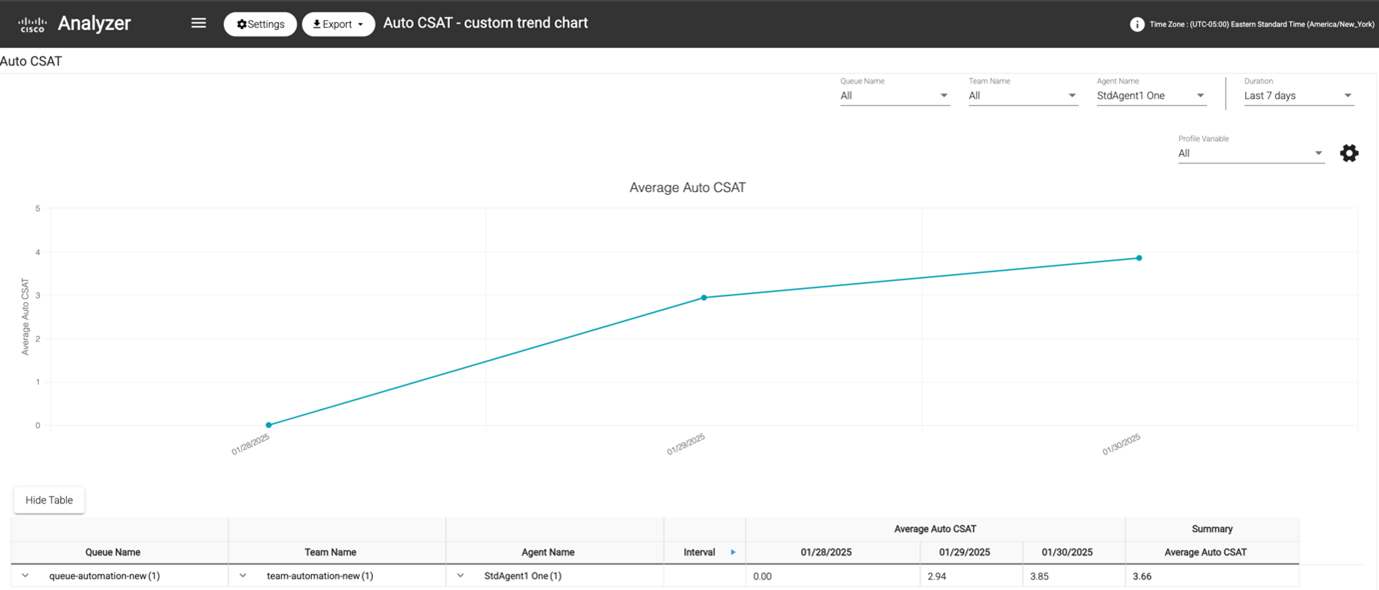
|
Dashboard en rapporten delen via browserkoppelingen
U kunt browserkoppelingen naar rapporten en dashboards delen met standaard- en premiumagenten die geen toegang hebben tot de Analyzer. Agenten kunnen rapporten en dashboards openen via de browserkoppelingen.
| 1 |
Meld u aan bij de Webex Contact Center Analyzer. |
| 2 |
Voer de visualisatie of het dashboard uit dat u wilt delen. |
| 3 |
Kopieer de URL die in de browser wordt weergegeven. U kunt deze URL met de agenten delen. |


