- Home
- /
- Article

Thanks for your feedback.

Access Dedicated Instance Applications from Control Hub
 In this article
 Feedback?
Access the Dedicated Instance Applications from Control Hub allows you to launch and manage UCM applications seamlessly. You can cross-launch these applications from Control Hub and selecting the desired UC applications.
Overview
Dedicated Instance is based on the Cisco Unified Communications Manager architecture and consists of the following applications deployed in a private cloud for a given region:
-
Cisco Unified Communication Manager
-
Cisco Unity Connection
-
Cisco Unified Communications Manager IM and Presence
-
Cisco Emergency Responder (only for AMER)
-
Cisco Expressway Core and Edge
-
Cisco Session Management Edition (optional)
The Unified Communications applications' features and services are administered using the native application portals and accessed from the Dedicated Instance configuration tab in Control Hub.
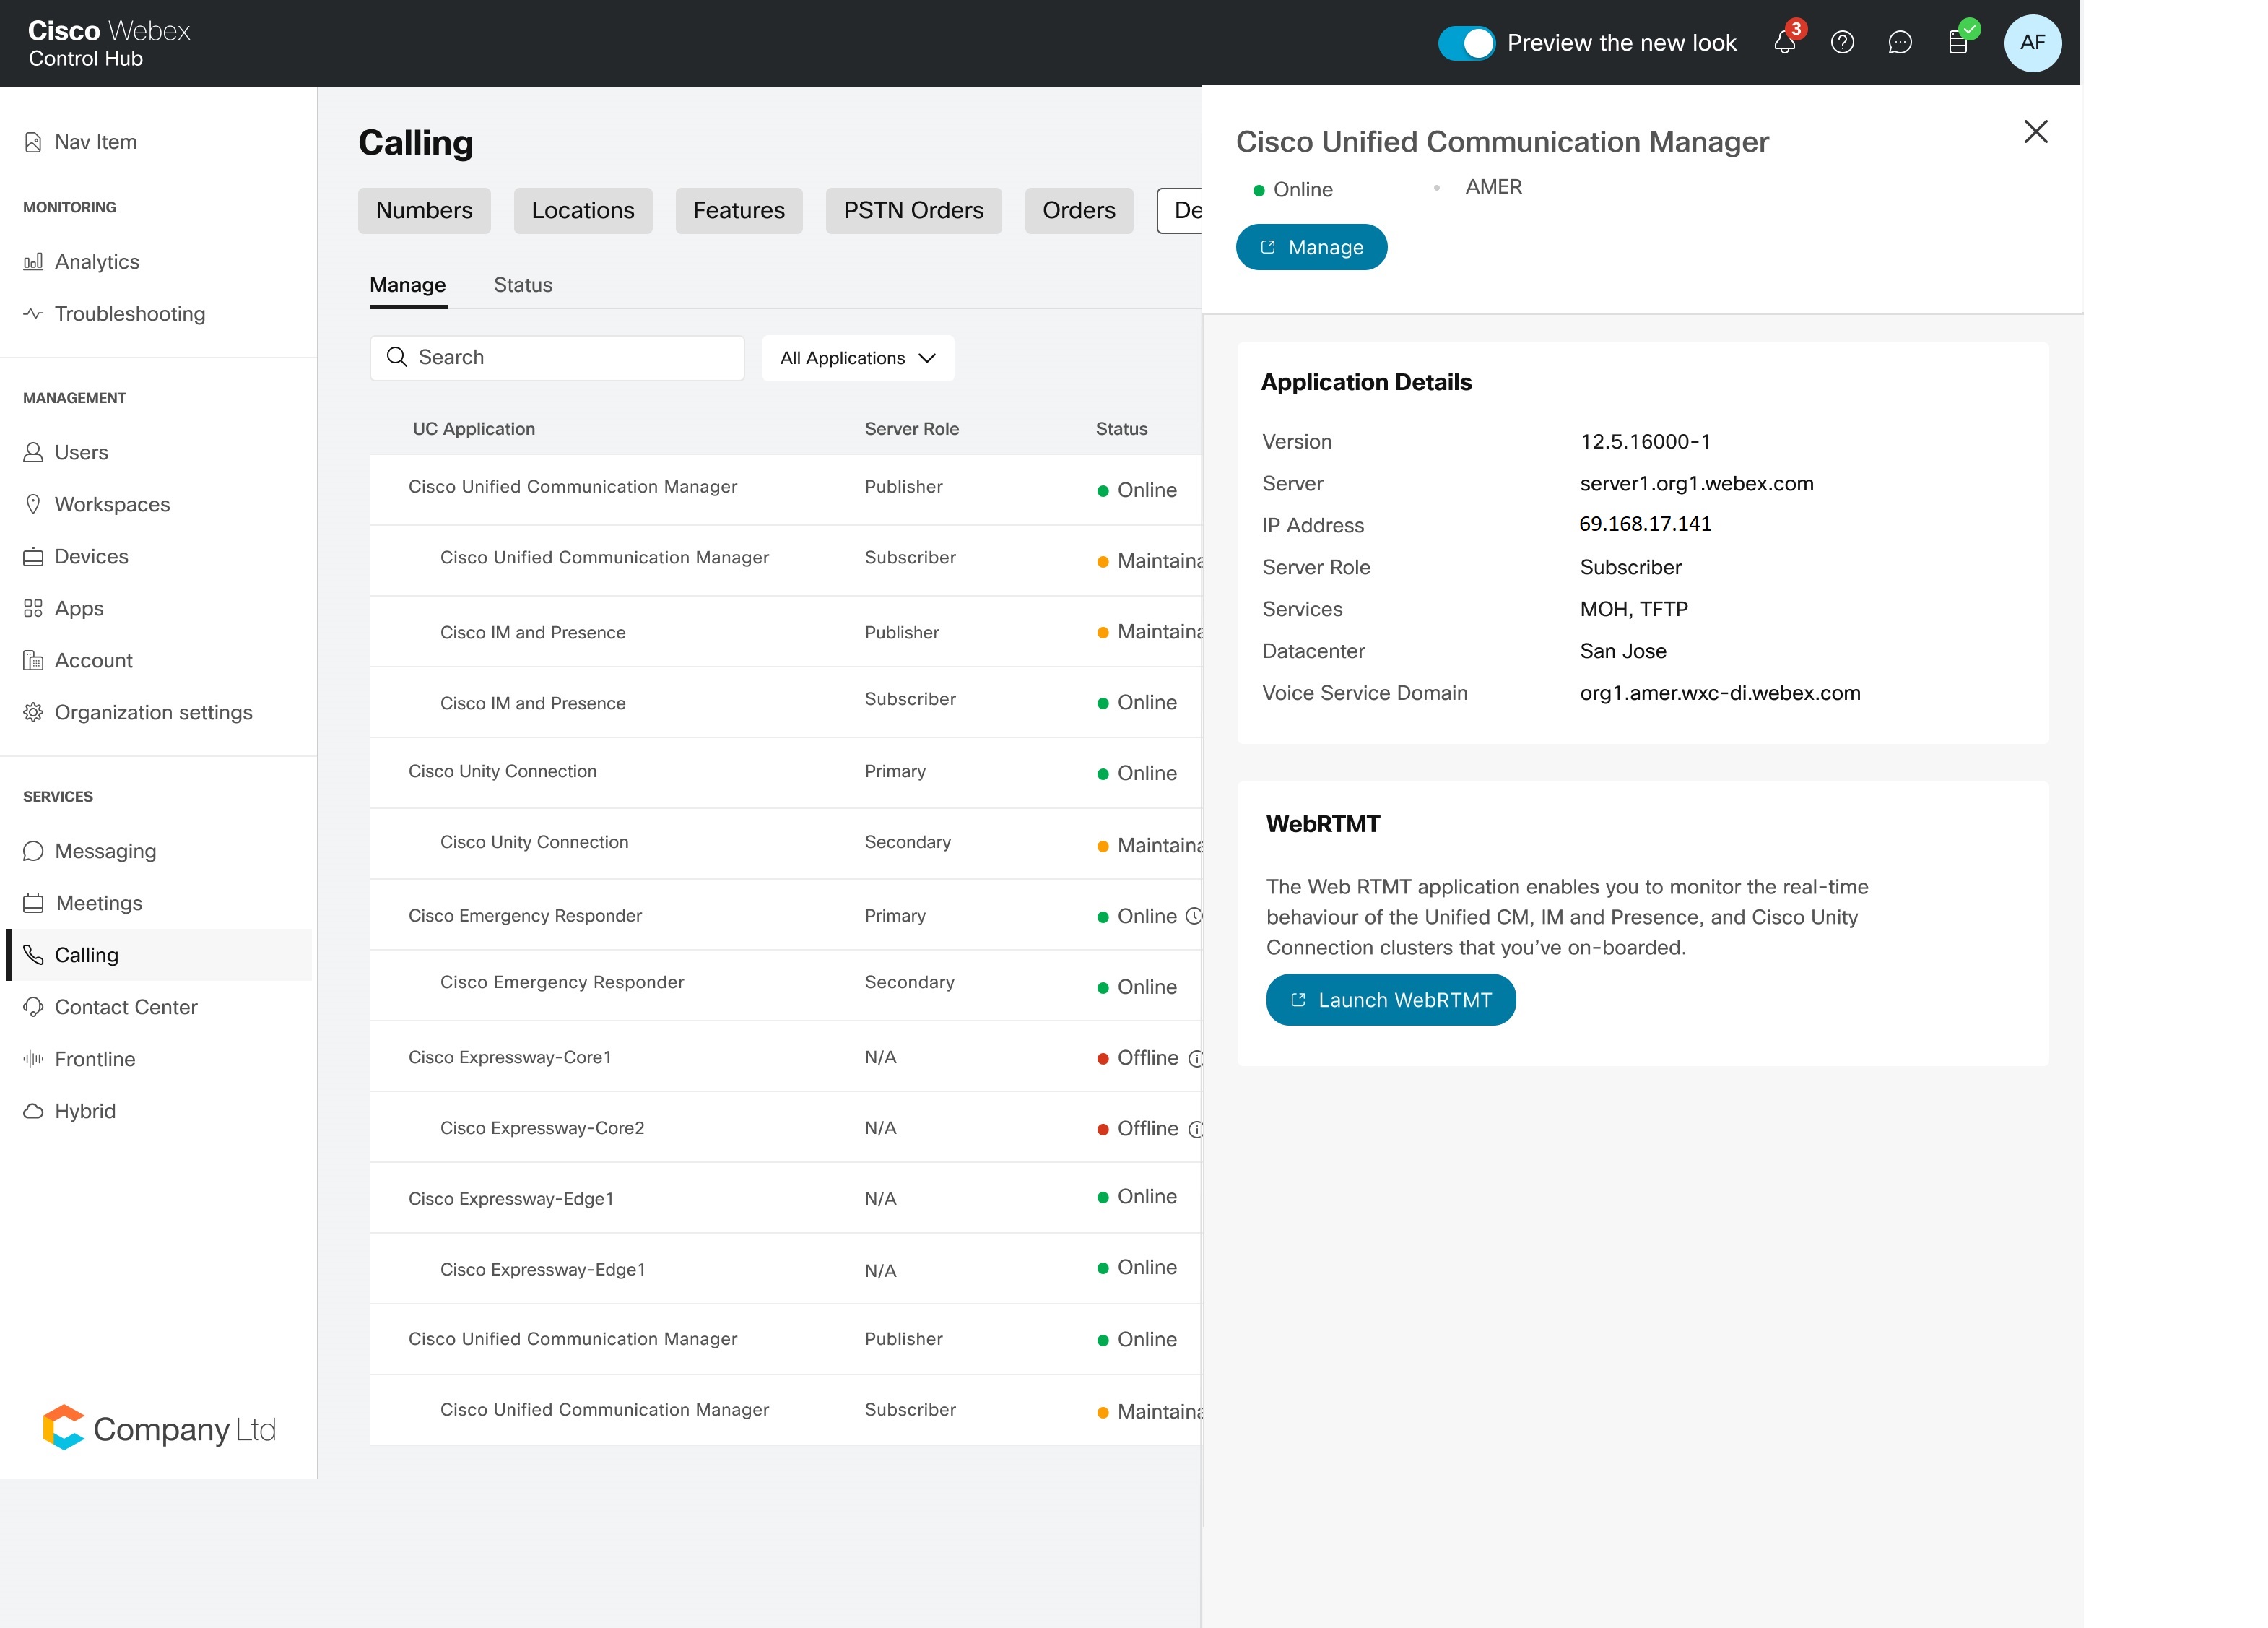
The Partner or Customer administrator can view the UC application's networking and datacenter information by clicking on Calling → Dedicated Instance → Manage → UC application, which opens a right pane in Control Hub.
The following details are displayed on the right pane:
-
Version - Current version of the UC application
-
Server - Fully qualified domain name of the UC application
-
IP address - Internal IP address of the UC application
-
Server Role - Indicates whether the node is a Publisher/Primary or Subscriber/Secondary
-
Services - Provides a list of only those services that are activated on the node.
List of services available are:
-
Provisioning (only for Publisher)
-
Call Processing
-
CTI Manager
-
Music on Hold (MOH)
-
Trivial File Transfer Protocol (TFTP)
The sync is scheduled every 24 hours, for the changes made in application to reflect in Control Hub. -
-
Datacenter - Datacenter where the node is deployed
-
Voice Service Domain - Voice service domain for Internal and MRA registrations
-
Public IP address — Internet facing IP address (applicable only for the Expressway Edge nodes)
Access Built-in Unified Communication Application Portal from Control Hub
You can cross launch all the Unified Communication applications from Control Hub over-the-top. This enables to start the on-boarding activities in the Unified Communication applications until the peering activities are complete.
The browser used for cross launching the above Unified Communication applications from Control Hub should be enabled to allow cookies. For further troubleshooting tips, refer to Troubleshooting Cross Launch Issues section.
-
Sign in to Control Hub at https://admin.webex.com/login
-
Go to Services > Calling > Dedicated Instance > Manage.
-
Select the UC Application and click Manage on the right pane to launch the corresponding UC application or the Expressway portal. The Unified Communication application’s built-in portal is cross launched in a new tab.
For SSO enabled UC applications, the recovery URL portal will be launched in a new tab and the user is expected to login with the local admin credentials.
The SSO configuration for the UC applications can't be done using the cross launch functionality. It can be only done from the original UC application's administration page.
The Cisco Session Management Edition (SME) cluster is spread across Dedicated Instance regions, hence the SME's publisher region is where the cluster is listed under the Manage tab. The subscribers deployed in different regions can be obtained from the right pane upon clicking on the server.
Troubleshooting Cross Launch Issues:
-
Supported Browsers:
-
Mozilla Firefox
-
Google Chrome
-
Microsoft Edge
-
Safari
-
-
Procedure to clear the web browser cache and cookies:
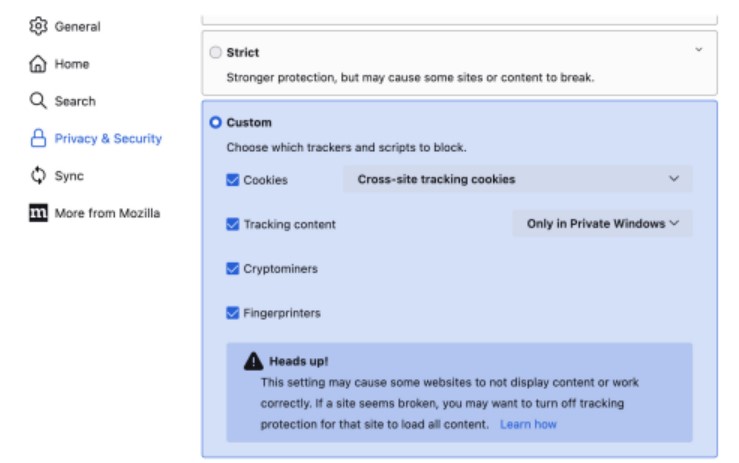
In case you have HTTP status code: 401 while cross launching the UC application from Mozilla FireFox, perform the following settings:
-
Click the Menu icon in the upper-right of the browser window.
-
Click Settings > Privacy & Securtiy.
-
Select Custom radio button and select Cookies and Tracking content check box.
-
Reload the browser.
-
- To clear cookies in Safari browser:
- Open the Safari app.
- Click the Safari menu in the top-left corner of your screen.
- Select Settings.
- Click the Privacy tab.
- Click Manage Website Data.
- To remove all website data, click Remove All.
- Confirm by clicking Remove Now, then Done.
-
If the above options does not resolve the issue, please contact TAC for further assistance.
Access Web RTMT Portal Over Cisco Webex Control Hub
Partner administrator with Sales Full Administrator role and Customer administrators with Full Administrator or Read-only Administrator role can cross launch the Web RTMT. The Web RTMT application enables you to monitor the real-time behavior of the Unified CM, IM and Presence, and Cisco Unity Connection clusters that are onboarded.
Configuring an email group to receive WebRTMT alerts is not supported in DI. Instead, you can set up a delivery channel through Control Hub to receive notifications via email and/or Webex space. Refer to Alerts center in Control Hub and Control Hub application status alarm definitions for more information on setting up the delivery channel and the alerts notified to Control Hub.
The cross launch is Over-The-Top (OTT) and does not require VPN access.
Before you begin
The browser used to access the Control Hub should allow cookies for the site - https://apps.ucmgmt.cisco.com.
Step 1 Sign in to Control Hub at https://admin.webex.com/login.
Step 2 Go to Services > Calling and select Dedicated Instance.
Step 3 Click on the UC application for which you need to monitor the real-time data. A pop-up right handed panel with the respective UC application details is displayed.
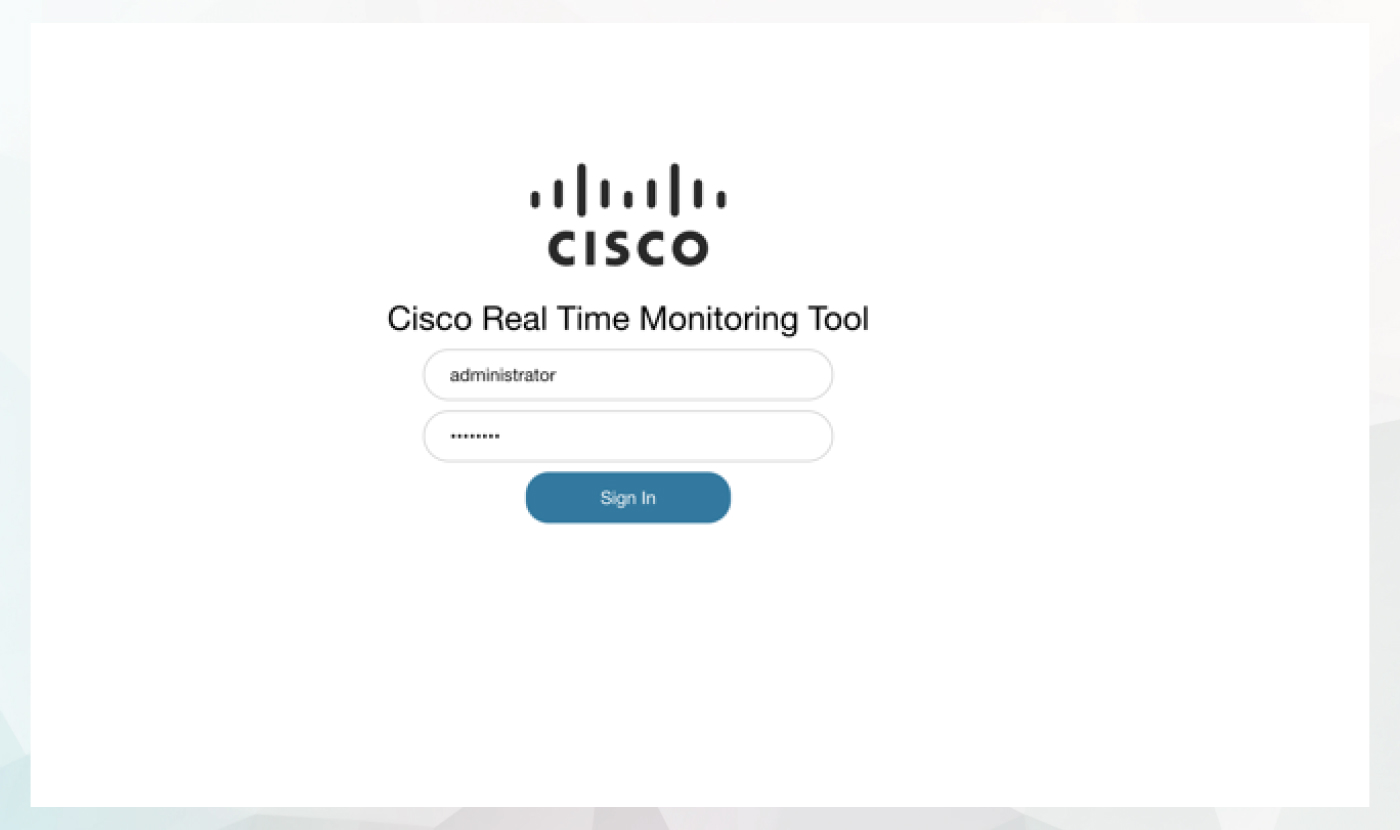
Step 4 Click Launch WebRTMT under WebRTMT section.
Launch to Web RTMT is through the publisher node, however, after launching, the Web RTMT gives an option to select subscriber node for which logs have to be collected.
Login to the Cisco Real Time Monitoring Tool that is launched in a separate window with administrator credentials.
System
The information in the following metrics is view only, no action is required by customer/partner administrators.
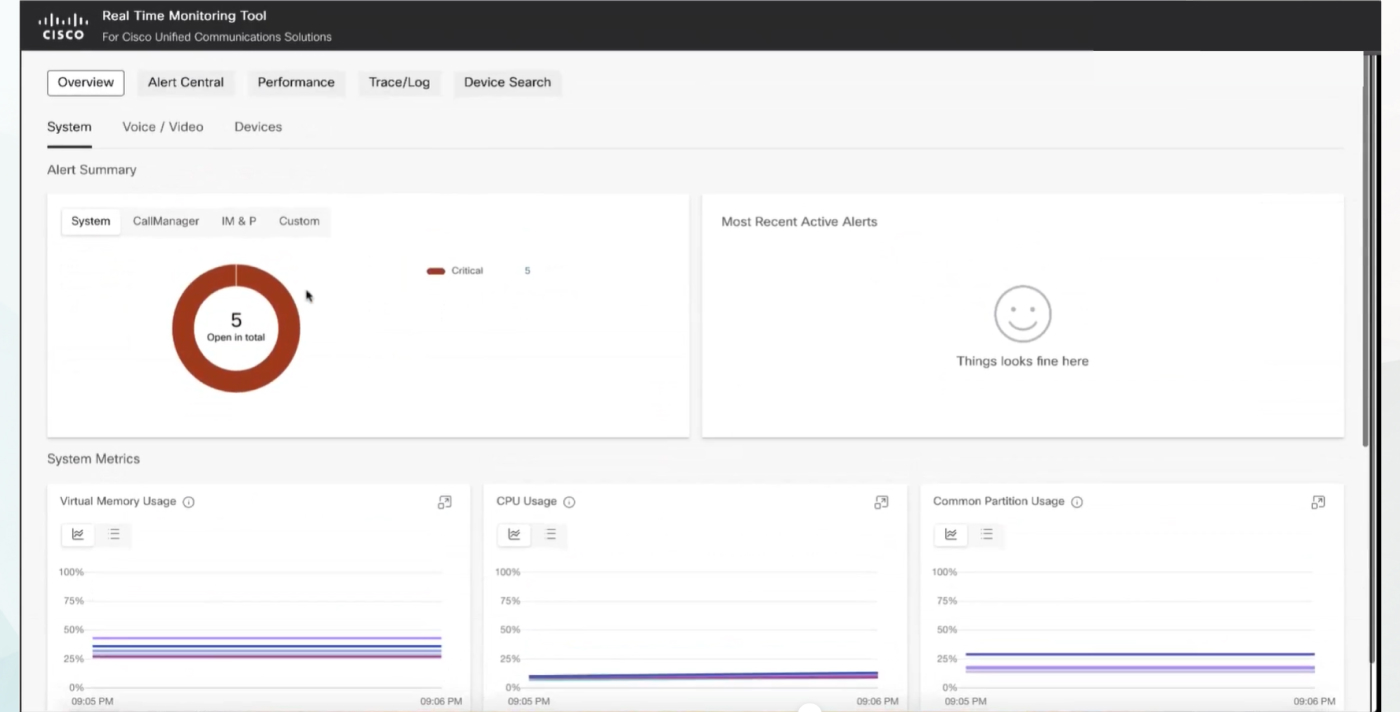
Alert Summary
The Alert Summary card gives a summary of all active alerts reported by all the nodes in a selected cluster. It shows the count of active alerts for each alert category. The card has the following tabs:
-
System: Displays the distribution of all active preconfigured alerts in each category reported by the selected cluster.
-
CallManager or Unity Connection: For a Unified CM cluster, this tab is titled CallManager and for a Cisco Unity Connection cluster this tab is titled Unity Connection.
-
IM & P: Displays the distribution of all active IM and Presence Service alerts that are reported by the selected cluster.
This tab is not applicable for a Cisco Unity Connection cluster. -
Custom: Displays the distribution of all active custom alerts that is reported by the selected cluster.
For more information about the previously mentioned alerts, refer to Cisco Unified Real-Time Monitoring Tool Administration Guide for your respective Unified CM release.
The Most Recent Active Alerts section lists the five most recent alerts. Click View All Alerts in the Most Recent Active Alerts section of the Alert Summary card to view information related to all the active alerts.
System Metrics
This section of the Web RTMT Overview page consists of charts that shows the health of the system. The following table describes the information that is displayed on the various charts.
|
Card Title |
Description |
|---|---|
|
Virtual Memory Usage |
This card displays a trend chart of the virtual memory usage for each node in the selected cluster. |
|
CPU Usage |
This card displays a trend chart of the CPU usage for each node in the selected cluster. |
|
Common Partition Usage |
This card displays a trend chart of the common partition usage for each node in the selected cluster. All log files are stored in the common partition. A high usage indicates that some processes are creating large log files. For example, if you’ve enabled debug logging during troubleshooting and forgotten to disable it after you’re done, the common partition usage would be high. |
The numbers displayed on these charts are in percentages (%).
Database Metrics
This section of the Web RTMT Overview page consists of charts that shows the health of the system. The following table describes the information that is displayed on the various charts.
The numbers displayed on these charts are in percentages (%).
This section of the Web RTMT Overview page consists of charts that provide active database connections and replication information about the node. These charts enable you to track the nodes related to the total number of active client connections, the number of replicates that have been created, and the status of the replication.
The following table describes the information that is displayed on the various charts.
|
Card Title |
Description |
|---|---|
|
Total Number of Clients Connected |
This card displays a trend chart of the total number of clients that are connected to the database for each node in the selected cluster. A steep rise or fall in this value indicates an issue on the node. |
|
Replicates Created |
This card displays a trend chart of the number of replicates created of the database tables for each node in the selected cluster. |
|
Replication Status |
This card displays a trend chart of the replication status of the database tables for each node in the selected cluster. The chart enables you to diagnose database replication issues. In the Table View, you can view one of the following values for the Replication Status of a node:
|
Call Activity
This section of the Web RTMT Overview page consists of charts that provide information about the call activity on the Cisco Unified Communications Manager such as completed calls, attempted calls, and calls in progress. This includes all servers in the cluster, if applicable.
The following table describes the information that is displayed on the various charts.
|
Card Title |
Description |
|---|---|
|
Calls Completed |
This card displays a trend chart of the calls that are completed for each call processing node in the selected cluster. The chart shows the data for only successful calls. |
|
Calls Attempted |
This card displays a trend chart of the calls that are attempted for each call processing node in the selected cluster. The chart shows the data for both successful and failed calls. |
|
Calls in Progress |
This card displays a trend chart of the calls that are in progress for each call processing node in the selected cluster. |
|
Logical Partition Failure |
This card displays a trend chart of the total logical partition failures for each node in the selected cluster. |
Gateway Activity
This section of the Web RTMT Overview page consists of charts that provide information about the gateway activity on the Cisco Unified Communications Manager, including active ports, ports in service, and calls completed. This includes all servers in the cluster, if applicable.
The following table describes the information that is displayed on the various charts.
You can view activity for a particular type of gateway using the drop-down list. The default is MGCP FXS gateway.
|
Card Title |
Description |
|---|---|
|
Calls Completed |
This card displays a trend chart of the calls that are completed for each call processing node that are routed through the selected gateway type. |
|
Ports Active |
This card displays a trend chart of the ports, of the selected gateway type, which are actively registered with each call processing node of the selected cluster. Ideally, the chart should display a flat line. Numerous variations in the chart indicate a network issue which in turn impacts gateway calls. |
|
Ports in Service |
This card displays a trend chart of the ports in service of the selected gateway type, which are actively registered with each call processing node of the selected cluster. |
Trunk Activity
This section of the Web RTMT Overview page consists of charts that provide information about the trunk activity on the Cisco Unified Communications Manager, including calls in progress and completed calls. This includes all servers in the cluster, if applicable.
The following table describes the information that is displayed on the various charts.
You can view activity for a particular type of trunk using the drop-down list. The default is trunk.
|
Card Title |
Description |
|---|---|
|
Calls in Progress |
This card displays a trend chart of the calls that are in progress for each call processing node that is routed through a trunk. |
|
Calls Completed |
This card displays a trend chart of the calls that are completed for each call processing node that is routed through a trunk. |
Devices
Registered Device Summary
This section of the Web RTMT Overview page consists of charts that provide information about the number of registered phone devices, registered gateway devices, registered media resource devices, and registered other station devices.
The following table describes the information that is displayed on the various charts.
|
Card Title |
Description |
|---|---|
|
Phone Devices |
This card displays a trend chart of the number of phone devices that are registered to each node in the selected cluster. |
|
Gateway Devices |
This card displays a trend chart of the number of gateway devices that are registered to each node in the selected cluster. |
|
Media Resource Devices |
This card displays a trend chart of the number of media resource devices that are registered to each node in the selected cluster. Examples of media resource devices are transcoder, Music on Hold (MOH), Media Termination Point (MTP), and conference bridge. |
|
Other Station Devices |
This card displays a trend chart of the number of other station devices that are registered to each node in the selected cluster. |
Phone Summary
This section of the Web RTMT Overview page consists of charts that provide information about the number of registered phones, phones that are running SIP, phones that are running Skinny Client Control Protocol (SCCP), partially registered phones, and the number of failed registration attempts.
The following table describes the information that is displayed on the various charts.
|
Card Title |
Description |
|---|---|
|
Phone Devices |
This card displays a trend chart of the number of phones that are registered to each Unified CM server in the selected cluster. |
|
Registered SIP Devices |
This card displays a trend chart of the number of SIP phones that are registered to each Unified CM server in the selected cluster. |
|
Registered SCCP Phones |
This card displays a trend chart of the number of SCCP phones that are registered to each Unified CM server in the selected cluster. |
|
Partially Registered Phones |
This card displays a trend chart of the number of phones that are partially registered to each Unified CM server in the selected cluster. A partially registered phone is a SIP phone which only has some lines registered to the server. |
|
Failed Registration Attempts |
This card displays a trend chart of the number of failed registration attempts to each Unified CM server made by all the phones in the selected cluster. |
Key Performance Indices (KPIs)
|
Field Title |
Description |
|---|---|
|
Poor Calls |
Count of the total poor calls and the percentage from the total calls in the past 1 hour. A call for which the SCSR value exceeds the long call and short call SCSR threshold is graded as a poor call. For more information, see Unified CM Call Quality Grades . If you see an unusually high value of poor calls, it indicates that there could be network issues related to bandwidth, QoS settings, and so on. |
|
Failed Calls |
Count of the total failed calls and the percentage from the total calls in the past 1 hour. If the origination and termination cause code of a CDR are not one of these values—'0', '1', '2', '3', '16', '17','31','126','127','393216','458752','262144', then a call is graded as a failed call. If you see an unusually high value of failed calls, check the call failure report. |
Charts on the Dashboard
The following table describes the information that is displayed on the various charts.
It may take up to 10 minutes for the information about calls that have completed, to appear here. The refresh time on the charts is 1 minute.
|
Card Title |
Description |
|---|---|
|
Poor Calls |
This card displays a trend chart and data of all the poor calls from the past 1 hour. The drop-down list enables you to filter data and view information for either poor, acceptable, or good calls. By default, the chart displays data for poor calls. The legend on the chart indicates the clusters for which data is displayed. |
|
Failed Calls |
This card displays a trend chart and data of all the failed calls from the past 1 hour. The drop-down list enables you to filter data and view information for either failed, dropped, or successful calls. By default, the chart displays data for failed calls. The legend on the chart indicates the clusters for which data is displayed. |
Enable Borderless CTI
Borderless CTI for Dedicated Instance provides the overview and the necessary information on methods to enable the Borderess CTI feature with the supported versions.
See Borderless CTI for more information.


