- Home
- /
- Article

Thanks for your feedback.

Media Health Monitoring for Video Mesh
 In this article
 Feedback?
You, the administrator, can use the monitoring tool in Control Hub to identify any connectivity issues for meetings originating from and supported by Video Mesh. The tool lets you proactively identify and diagnose SIP signaling, media signaling, and media cascade path issues.
Monitoring Tool for Video Mesh
The Monitoring tool in Control Hub helps your organization in monitoring the health of your Video Mesh deployment. You can run the following tests on your Video Mesh nodes, clusters, or both to get results for specific parameters.
-
Signaling Test - Tests whether SIP signaling and media signaling occurs between the Video Mesh node and Webex cloud media services.
-
Cascade Test - Tests whether a cascade can be established between the Video Mesh node and Webex cloud media services.
-
Reachability Test - Tests whether the Video Mesh node can reach the destination ports for media streams in Webex cloud media services. It also tests if the Video Mesh node is able to communicate with the cloud clusters associated with media containers through those ports.
When you run a test, the tool creates a simulated meeting. After the test finishes, you see a simple pass or fail result with inline troubleshooting tips in the report. You can schedule the test to run periodically or run the test on demand. For more information, see Media Health Monitoring for Video Mesh.
Run an immediate test
Use this procedure to run an on-demand media health monitoring and reachability test on Video Mesh nodes and/or clusters registered to your Control Hub organization. The results are captured in Control Hub and are aggregated every 6 hours starting at 00:00 UTC.
| 1 |
Log in to Control Hub, then go to . |
| 2 |
Click on Configure Test, click Test now, then check the nodes and/or clusters you want to test. If you want to clear the boxes you've checked and restore your last configuration, click Restore last test configuration. |
| 3 |
Click Run test. |
What to do next
The results appear in the monitoring tool overview page in Control Hub. By default, results of all the tests are displayed together. Click on Signalling, Cascade, or Reachability to filter the results according to the specific test.
The points on the timeline with slider show aggregated test results for the entire organization. The cluster-level timelines show aggregated results for each cluster.
The timeline might display dates in the US format. Change your language in the profile settings to view dates in your local format.
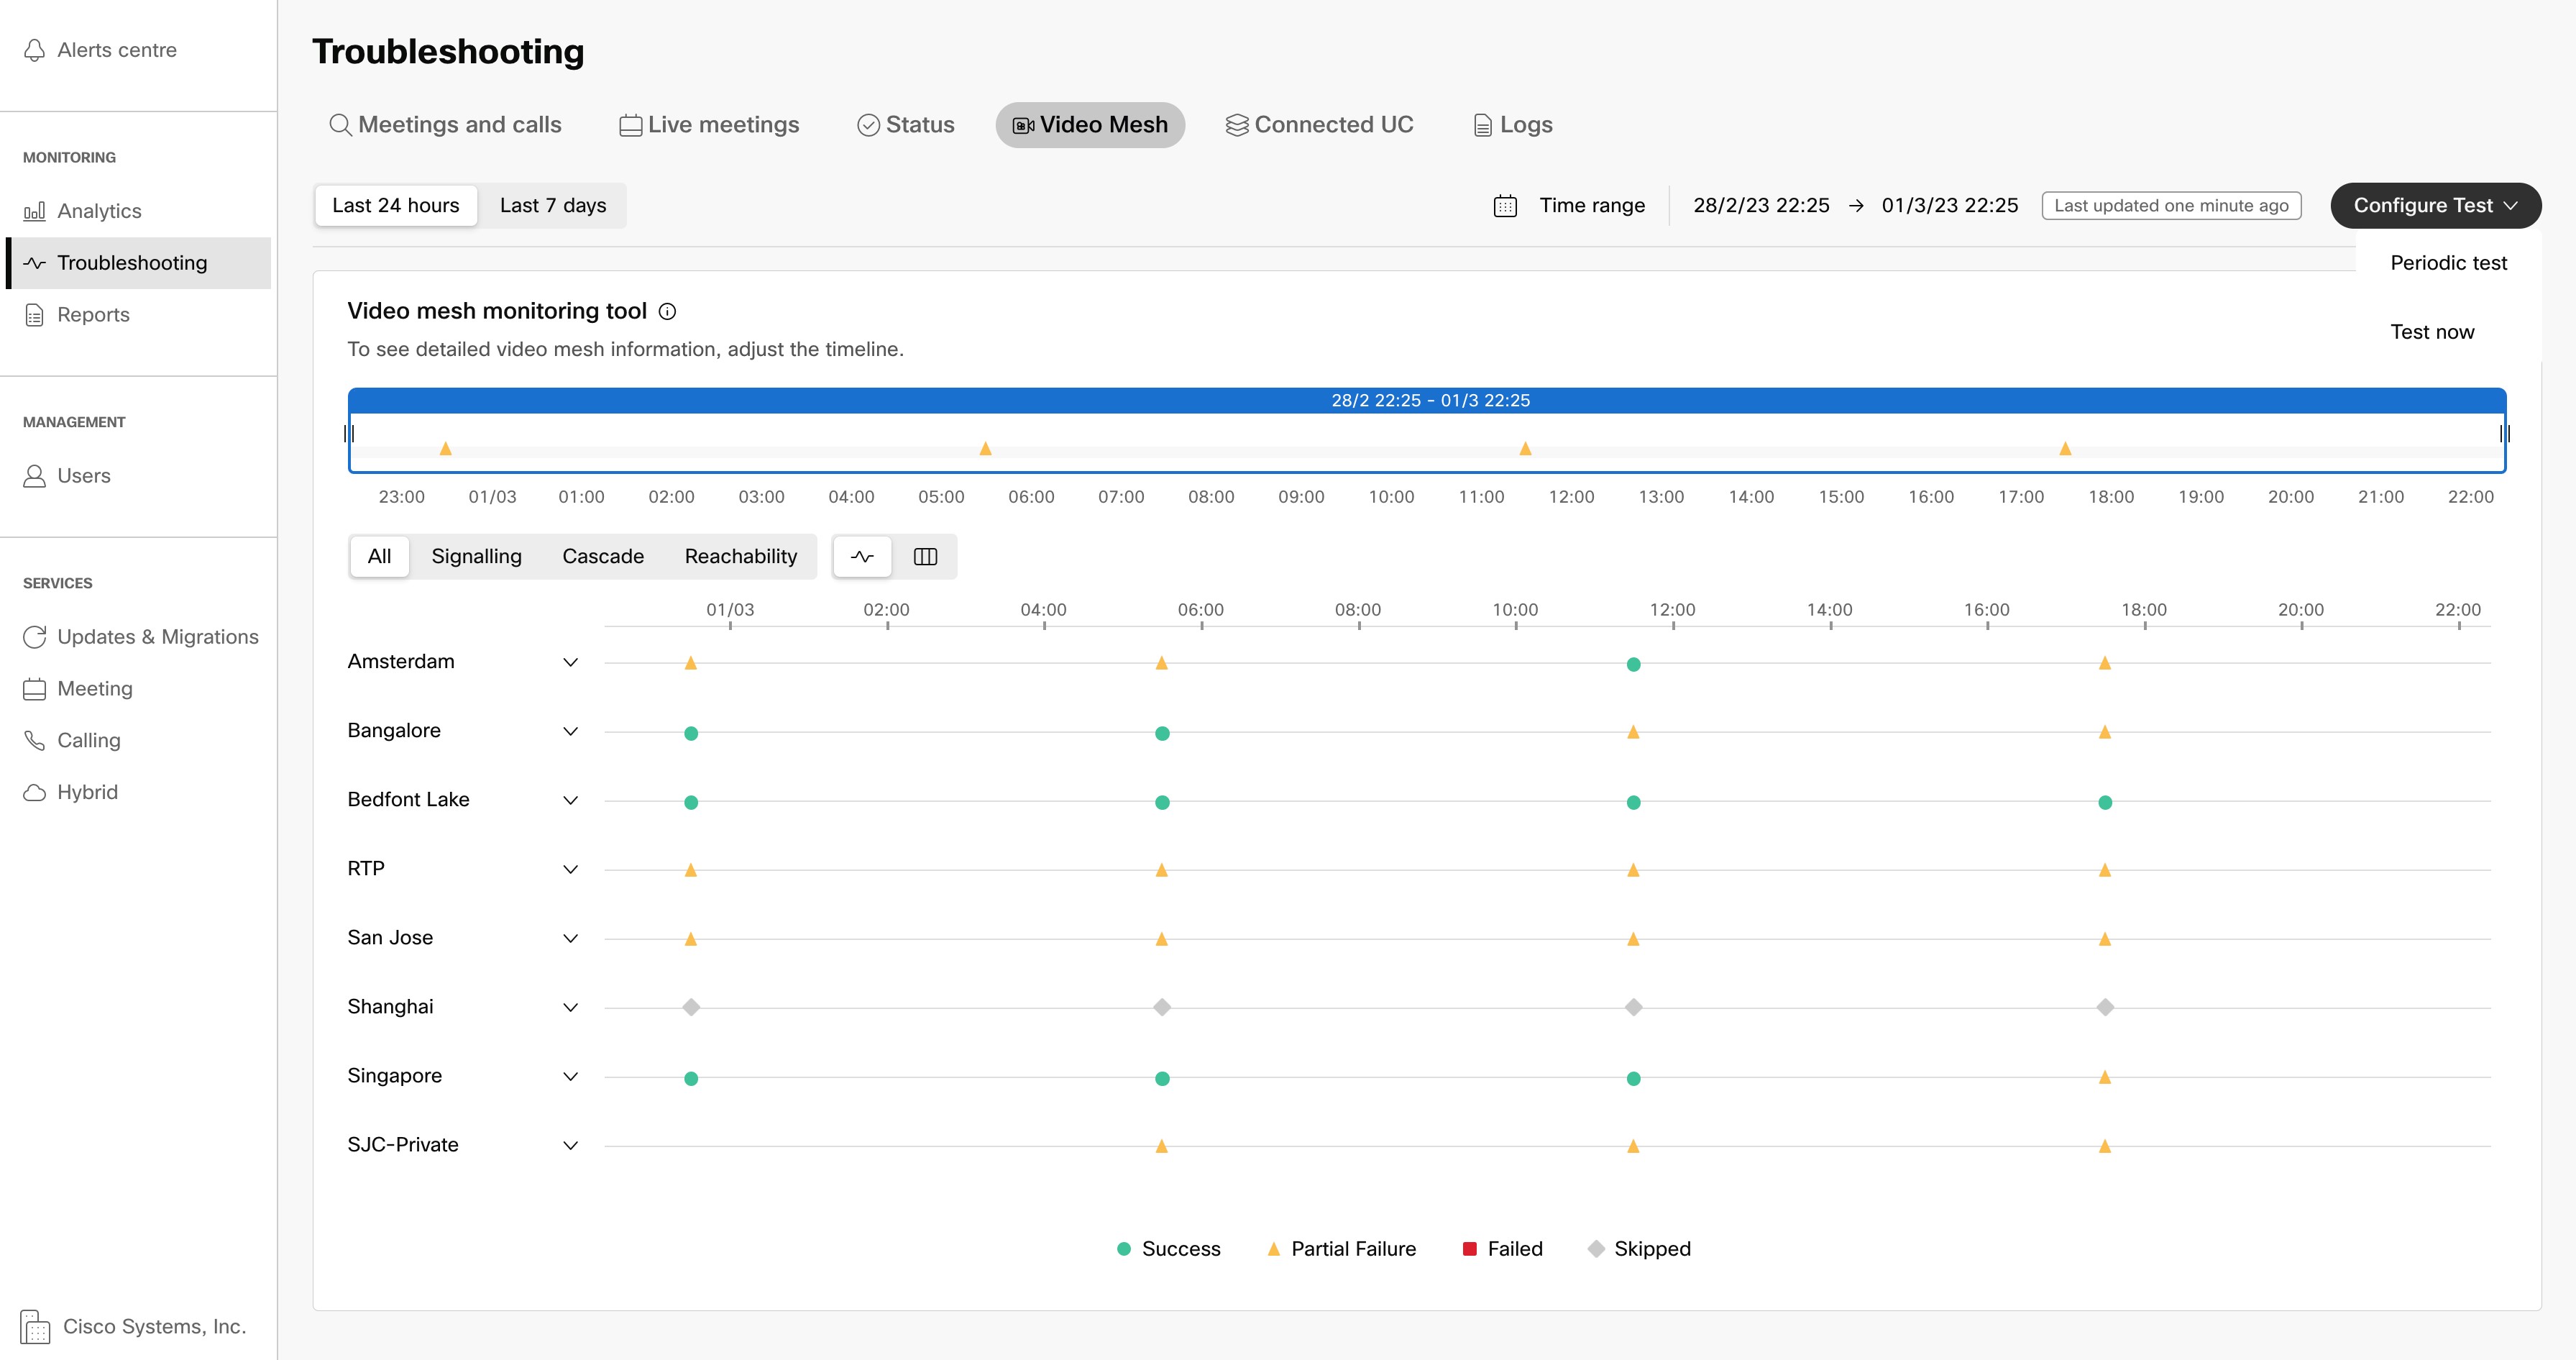
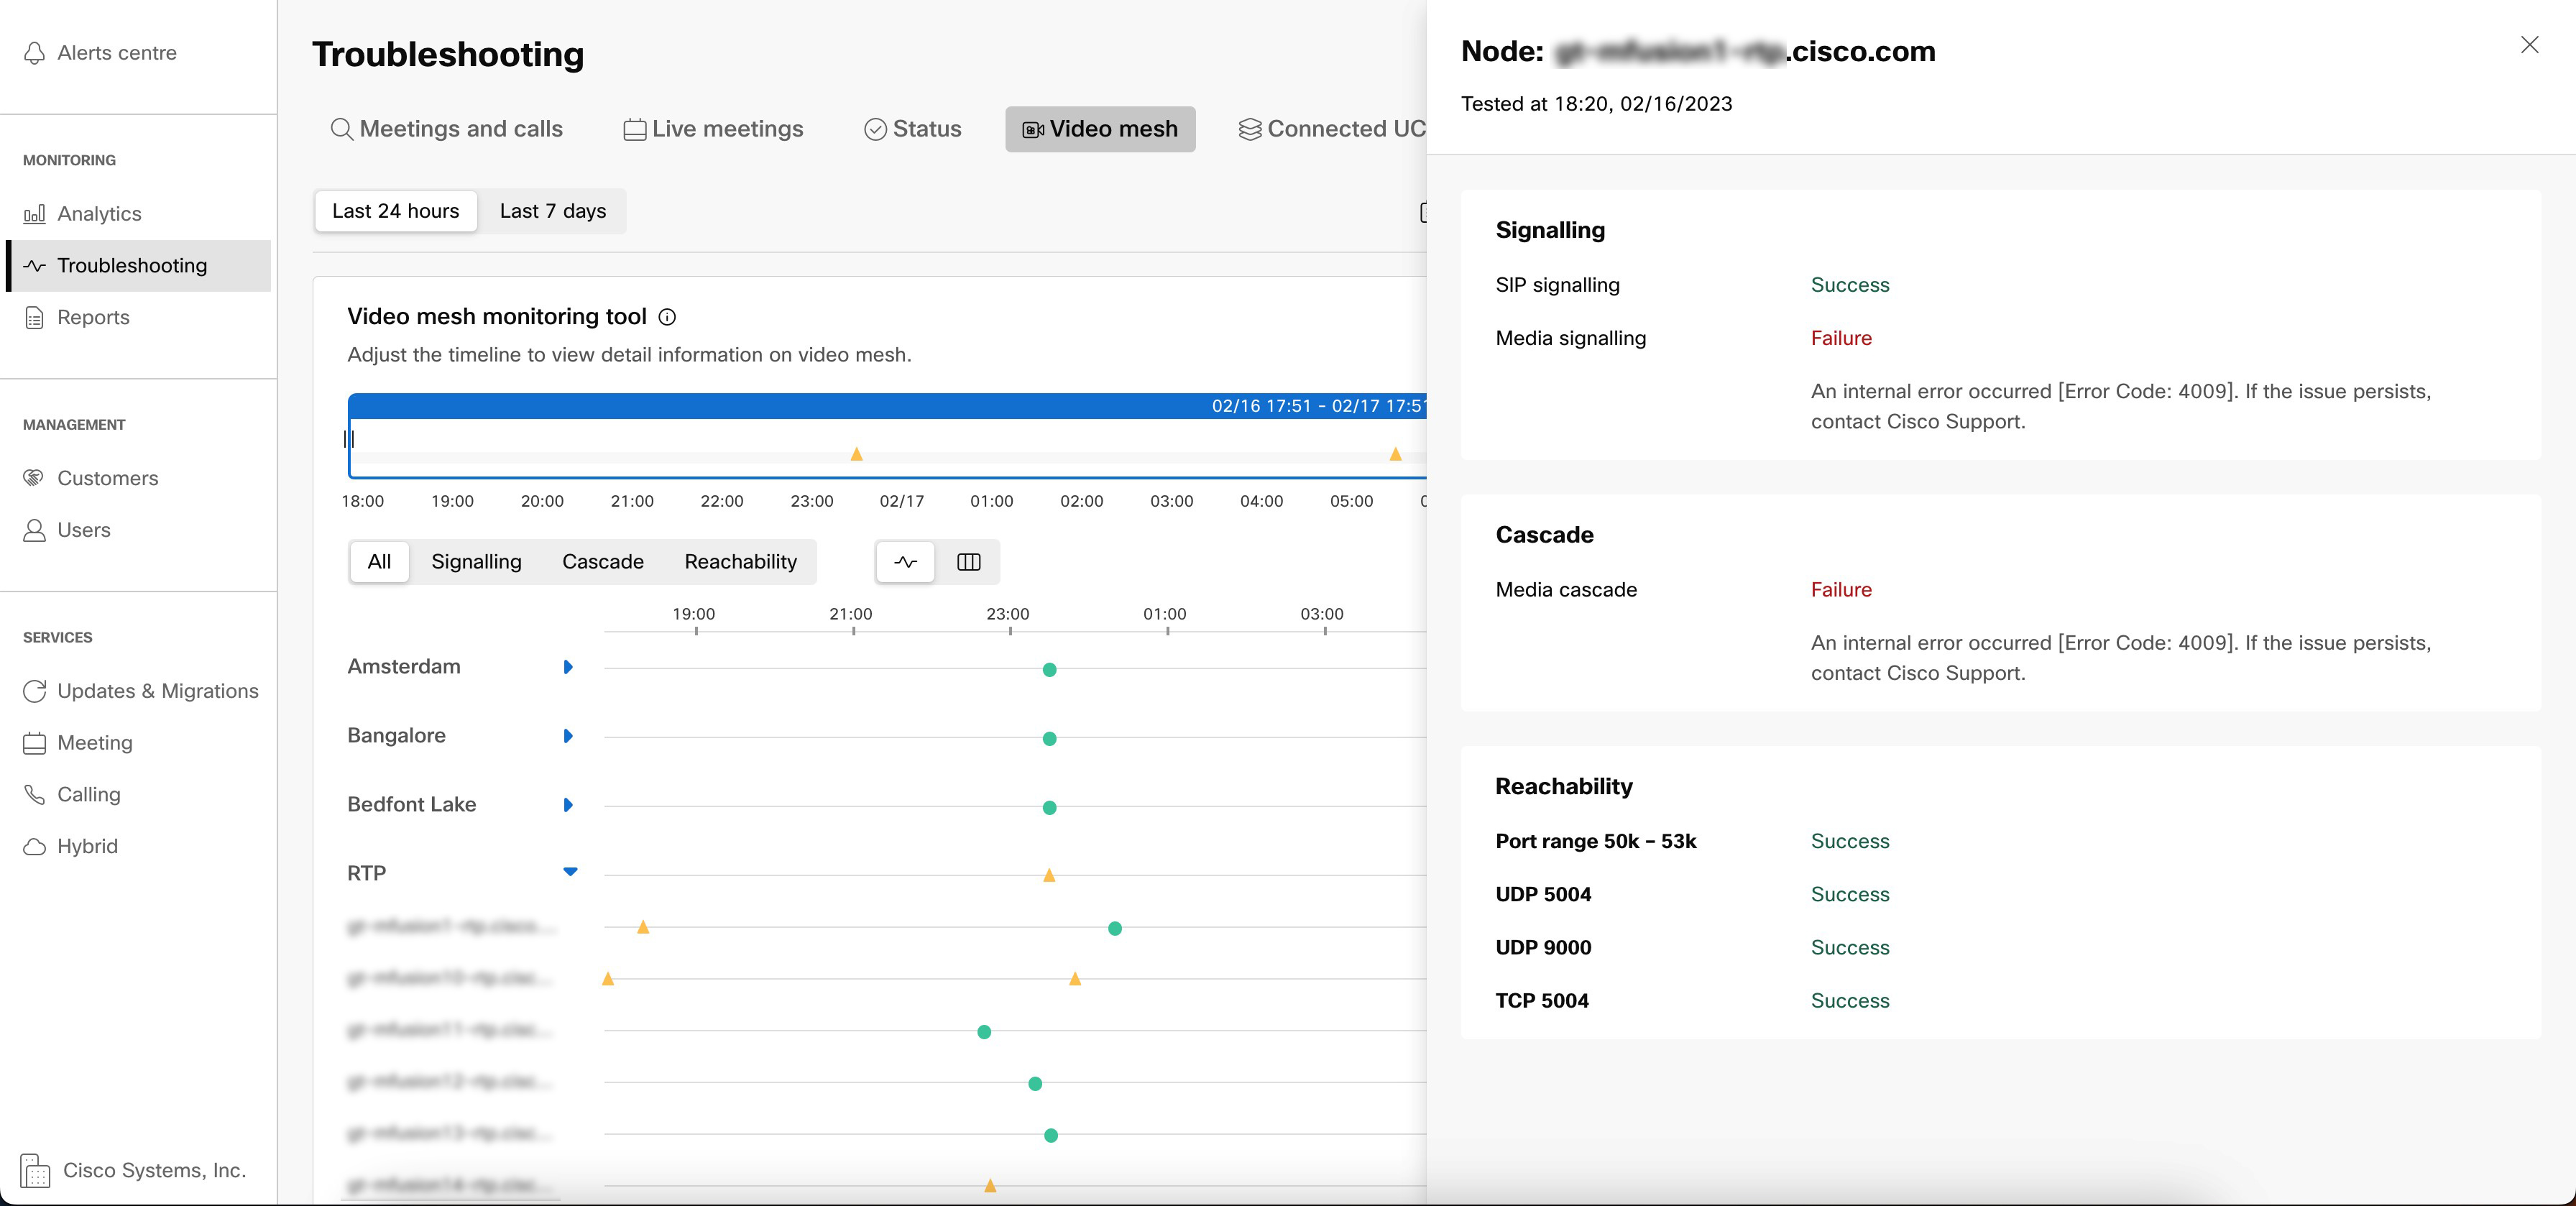
Hover over the points on the timelines to see the test results. You can also see detailed test results for each node. Click on a point on the cluster-level timeline to view detailed results.
The results are displayed in a side panel and split into Signaling, Cascasde and Reachabilty. You can view whether the test was a success, if it was skipped, or if the test failed. Error codes with possible fixes are also displayed with the results.
Use the toggle provided to view the success rates of various parameters in the form of a table.
Configure periodic tests
Use this procedure to configure and start periodic media health monitoring and reachability tests. These tests run every 6 hours by default. You can run these tests at cluster-wide, cluster-specific, or node-specific levels. The results are captured in Control Hub and are aggregated every 6 hours starting at 00:00 UTC.
| 1 |
Log in to Control Hub, then go to . |
| 2 |
Click on Configure Test, click Periodic test, then check the nodes and/or clusters you want to test. |
| 3 |
Choose an option:
|
| 4 |
Click Next. |
| 5 |
Review the list of clusters and nodes to run the periodic tests. If you are satisfied, click Configure to schedule the current configuration. |
What to do next
The results appear in the monitoring tool overview page in Control Hub. By default, results of all the tests are displayed together. Click on Signalling, Cascade, or Reachability to filter the results according to the specific test.
The points on the timeline with slider show aggregated test results for the entire organization. The cluster-level timelines show aggregated results for each cluster.
The timeline might display dates in the US format. Change your language in the profile settings to view dates in your local format.
Hover over the points on the timelines to see the test results. You can also see detailed test results for each node. Click on a point on the cluster-level timeline to view detailed results.
The results are displayed in a side panel and split into Signaling, Cascasde and Reachabilty. You can view whether the test was a success, if it was skipped, or if the test failed. Error codes with possible fixes are also displayed with the results.
Use the toggle provided to view the success rates of various parameters in the form of a table.
Disable a Monitoring Tool test
| 1 |
Log in to Control Hub, then go to . |
| 2 |
In the Video Mesh section, choose View Details next to Monitoring Tool. |
| 3 |
Mouse over or click Configure Test, and then click Hourly. |
| 4 |
Uncheck the test that you want to disable, and choose Next. |
| 5 |
Click Configure. |


