Thanks for your feedback.
Webex Monitoring Service data in Control Hub
 Feedback?
As of June 18, 2024, Webex Monitoring Service went end of life. We recommend that you switch to using the ThousandEyes integration in Troubleshooting for similar data.
The Webex Monitoring Service agent helps you see the quality of your organization's network connection when using Webex services within the last seven days. You must have an agent set up and be a full customer administrator or read-only customer administrator to view this data.
Before you begin
| 1 |
Sign in to Control Hub, then under Monitoring, select . |
| 2 |
Under Webex Monitoring Service, select View Details. 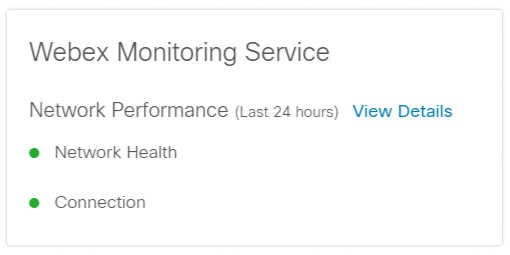
|
| 3 |
Next to Agent, select the Webex Monitoring Service agent for which you want to view data. |
The network test data that the Webex Monitoring Service agent provides help you see what your network connection is like when connecting to a Webex service. You can use this information to compare it with your actual Webex meetings quality data to see where potential network problems could be coming from, either from your organization's network or from a Webex data center.
The agent runs network traffic tests every five minutes from your organization's network to Webex data centers and shows you network quality data for the following:
-
Web Service—Accessing Webex web services like scheduling a meeting on a Webex site, visiting Webex Site Administration, visiting the Webex Meetings API page, and accessing network-based recordings.
-
Conferencing Service—In-meeting actions, such as how long it takes to join a meeting, muting and unmuting, using the chat box, and content sharing.
-
Media Service—Audio and video quality of a Webex meeting.
-
SIP—What the signalling connection is like when an on-premises video device is used for Webex services, such as dialing in a URI to join a meeting.
The graph turns red to highlight potential problems if the agent's connection reaches the threshold for any of the services twice in a row.
The default thresholds are:
|
Metric |
Threshold |
|---|---|
|
Latency |
500ms |
|
Packet Loss |
10% |
|
TCP |
1500ms |
|
TLS |
3000ms |
|
DNS |
1000ms |
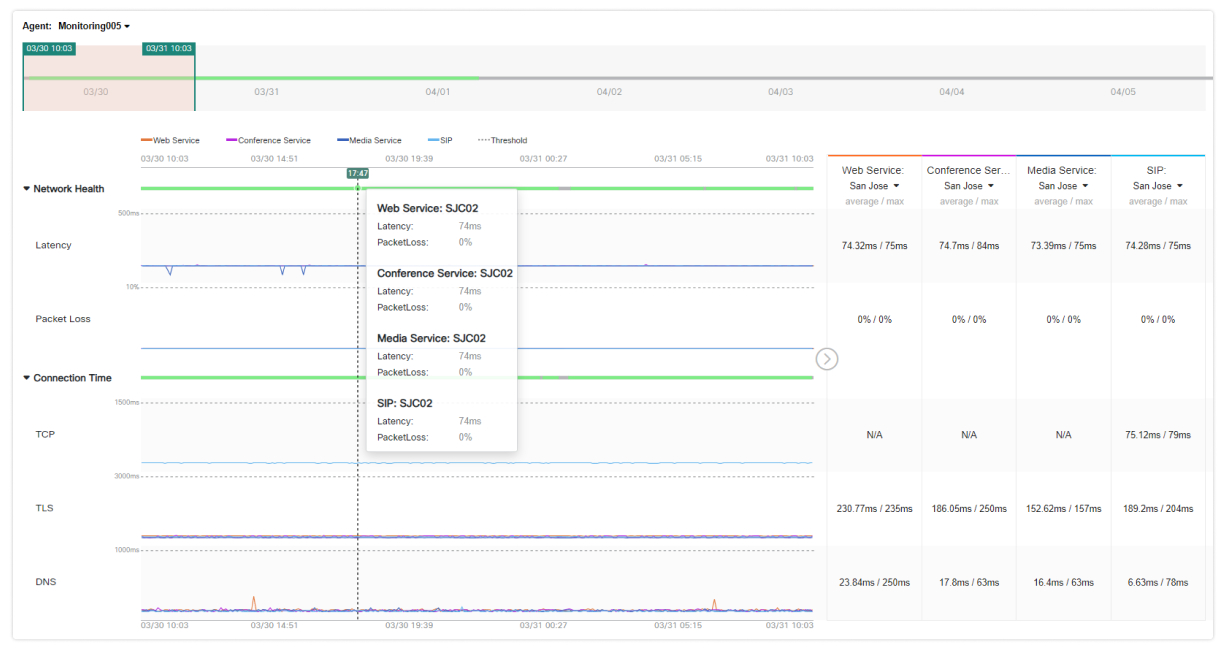
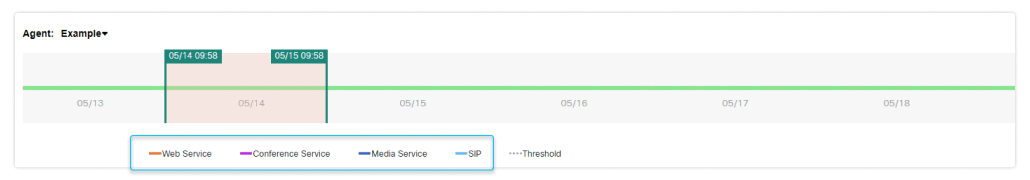
Use the timeline slider to zoom in on a 3 to 24 hour window within the 7 days of performance data. You can also filter the data shown in the charts.
Services Panel
The services panel is shown on the right-side, and you can collapse it with the Arrow
 .
.
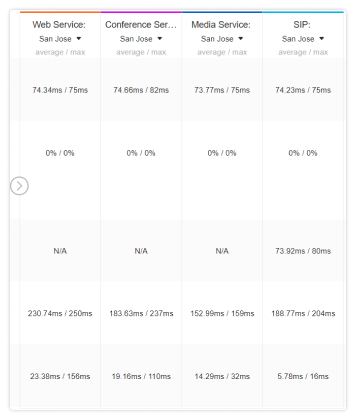
This panel shows you the average data for all the connections made to each service and compares it with the highest threshold reached within the timeframe that you're currently viewing. You can switch between different Webex data centers to see what your organization's network connection is like for different locations.
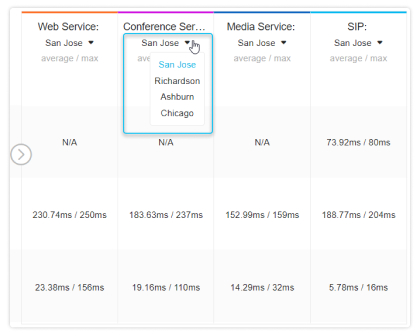
The Webex data centers that you can choose from are based on the Webex site settings and the location of the agent.
Network Health
This graph shows you the health of the network path from the agent to each of the Webex services. You can hover over any point in the graph to show you the data for each end-to-end connection the agent made to a service.
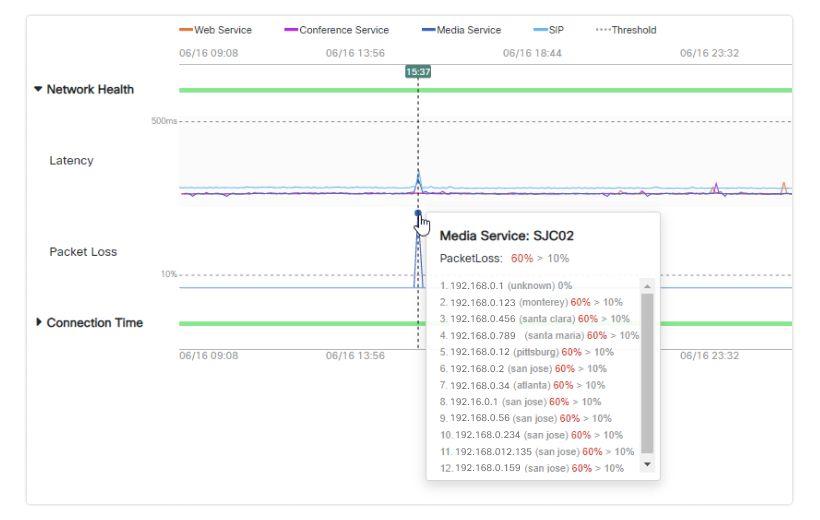
For the latency and packet loss graphs, you can hover over a point of interest to see the exact numbers for every connection made during that time. The top number represents the metric from end to end, and below that you can inspect the metrics for each hop. If the end to end connection seems excessively high, you can check each individual hop to help troubleshoot where a problem with your network connection could be coming from.
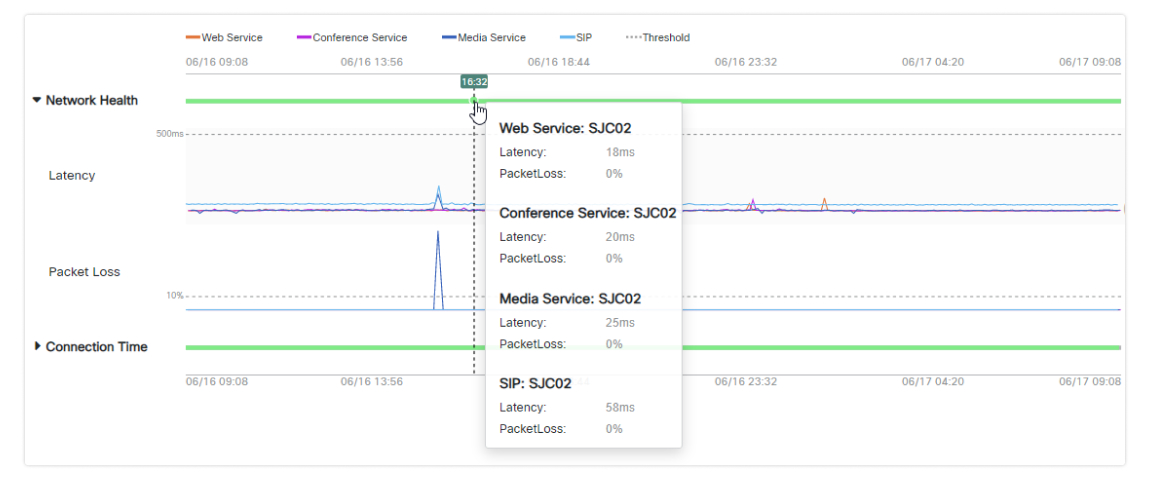
Example: Latency
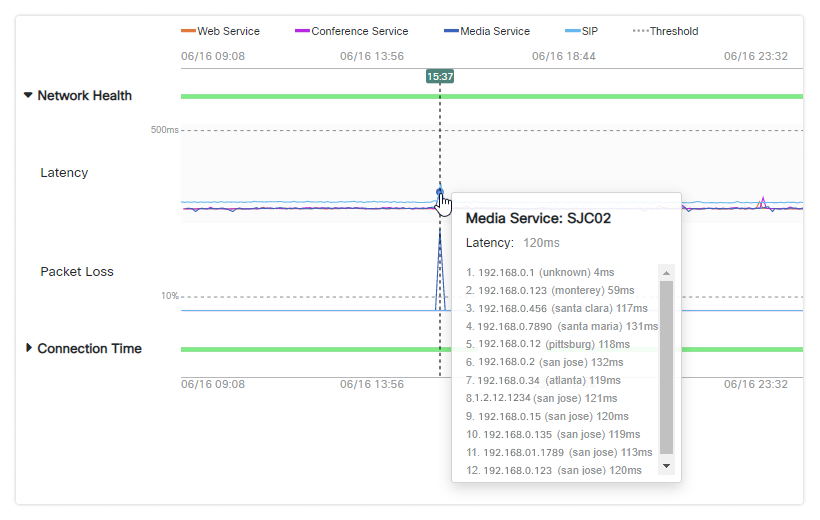
Example: Packet Loss
Connection Time
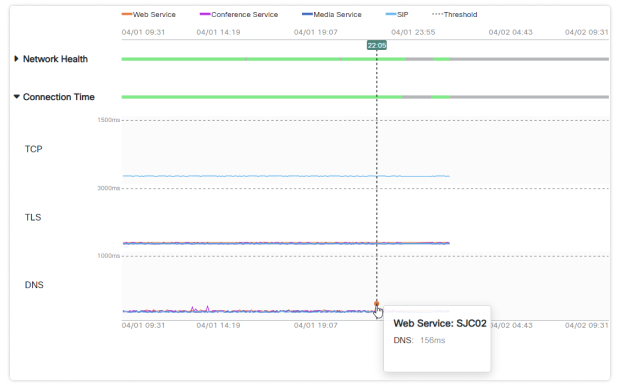
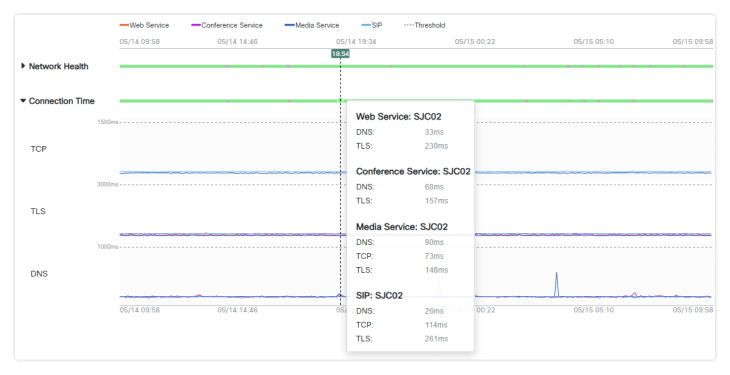
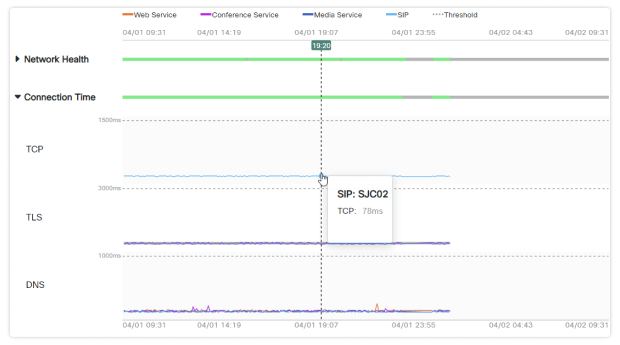
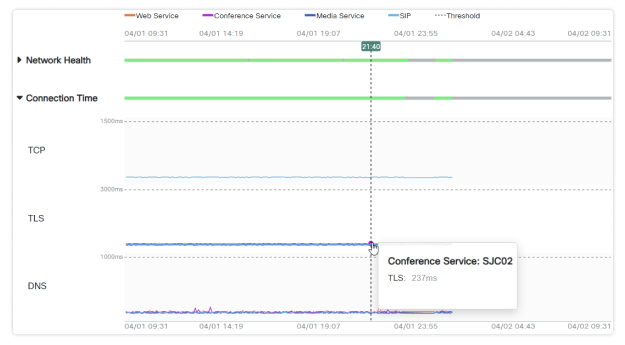
This graph shows you the time it takes for the agent to establish a connection or resolve the DNS entries to each of the Webex services. You can hover over any point in the graph to show you the data for each end to end connection the agent made to a service.
For the TCP, TLS, and DNS graphs, you can hover over a point of interest to see the exact numbers for the connections made during that time.
Example: TCP
Example: TLS
Example: DNS