- Home
- /
- Article

Thanks for your feedback.

Troubleshoot Dedicated Instance call failure and call quality in Control Hub
 In this article
 Feedback?
The troubleshooting view in Dedicated Instance allows administrators to troubleshoot a call failure and call quality issue in a Dedicated Instance call. You can search for information related to the call, view its media statistics, identify where the issue occurred, and resolve the problem.
Overview
The call quality troubleshooting feature doesn’t require any specific configuration and is available by default in the Control Hub. It’s available to full customer, read-only, support, partner, and partner read-only administrators.
Administrators can search using the following criteria to get a list of calls where a call session was used with at least one Dedicated Instance registered endpoint:
-
Call quality
-
Reason for failure
-
Host name
-
Call IDs
-
Device pool
- Final called number
- Duration
- Calling number
- Dialed number
- Caller user ID
- Dialed user ID
- Conversation ID
- Source device session ID
- Destination device session ID
The call failure and call quality troubleshooting feature allow administrators to:
-
View the end-to-end experience of the participants of the call.
-
View a hop detail of the call.
-
View calls for the past seven days.
-
Analyze the call quality metrics that impacted the user's experience.
-
Detect if the issue is with the caller or the callee.
Prerequisites
- Sign in to Control Hub.
- Under Services select Calling → Dedicated Instance → Manage
- Click Cisco Unified Communications Manager, then enable the
following under Helpdesk services:
- Enable Telemetry module for Unified CM/SME node.
- Enable Analytics toggle.
- Ensure that the telemetry module version is 2005 and above.
Access the Dedicated Instance troubleshooting view
To analyze a call, perform the following:
-
Sign in to Control Hub, then go to Monitoring > Troubleshooting
> Dedicated Instance.
CDR records are displayed only after you apply the filters. By default, calls are not displayed on the troubleshooting page.
- Search for the call status, call quality, failure reason, user ID, phone number, session
ID, device pool, and so on, of the call leg you'd like to view.
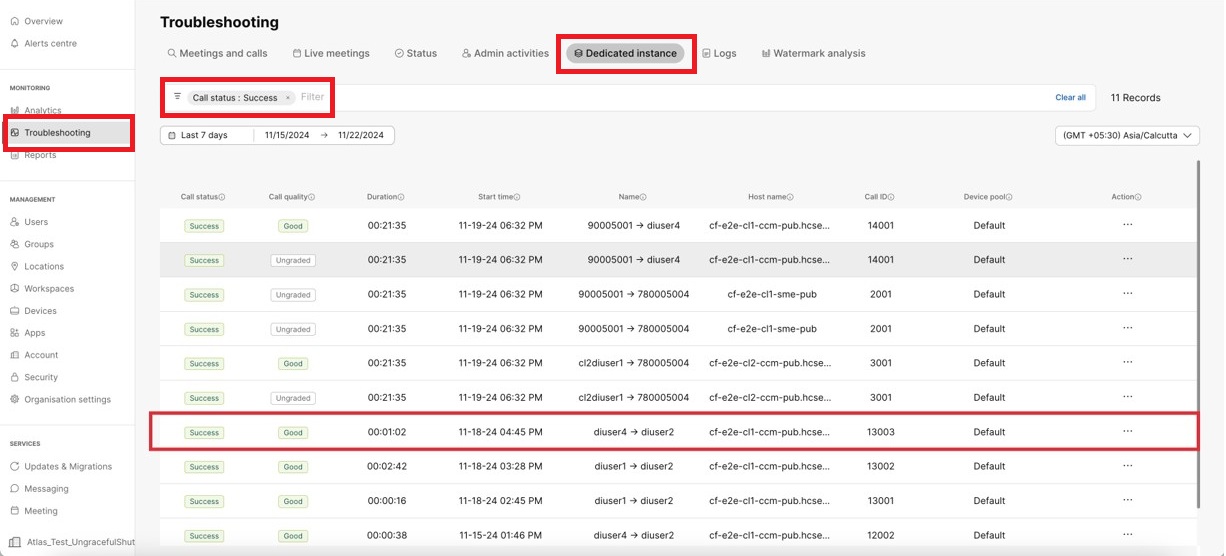
- The calls are graded for quality. The call experience is graded as:
Grade
SCSR Threshold Values
Long Call SCSR Ranges
Short Call SCSR Ranges
Good
Less than 3%
Less than 20%
Acceptable
3%-7%
20%-30%
Poor
Greater than 7%
Greater than 30%
- Click a specific call on the listing view, to inspect the ladder diagram of the call as
per the call flow and the details of the call.
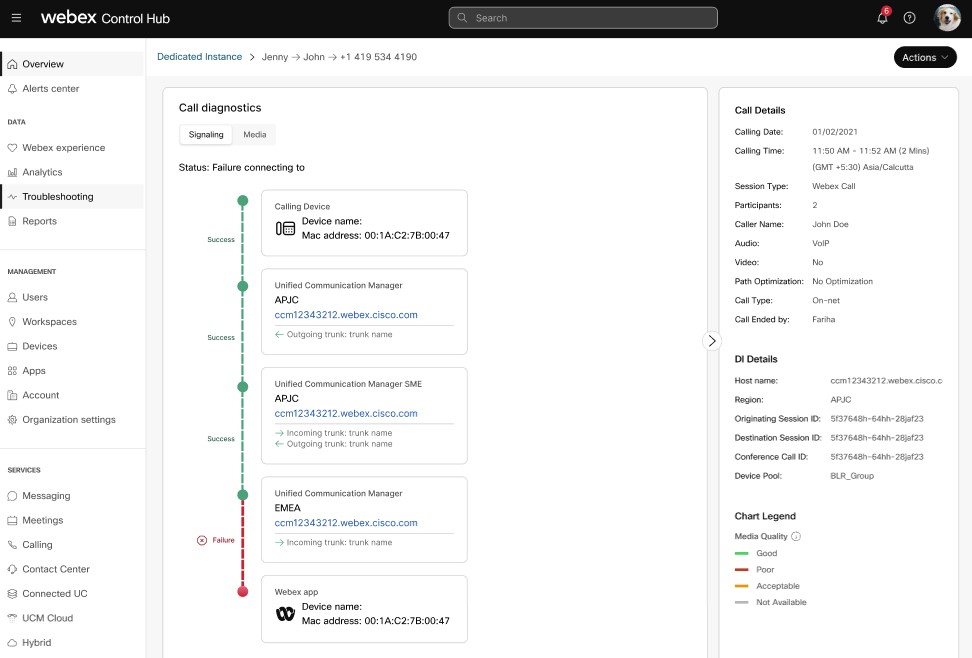
There are two views available under Call diagnostics. You can switch between Signaling and Media tabs for detailed information.
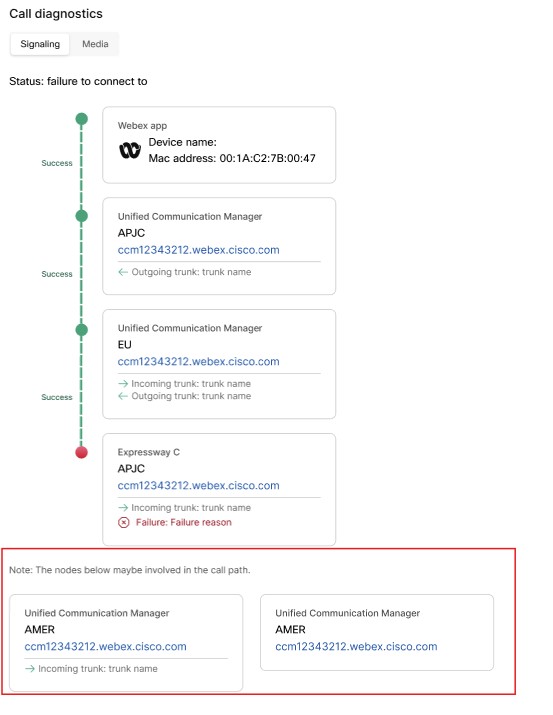
- Signaling
- Shows the call status (success or failure) for every call leg along with call quality, indicated by the color of the dotted line.
- If there's a failure in any call leg, a failure reason is displayed.
- If the call has trunks involved, both incoming and outgoing trunk details are displayed inside the Unified CM block.
- The originating device can be a desk phone or any soft phone which shows as a cloud device.
-
Administrators can cross-launch Unified CM or other UC applications by clicking the hostname.
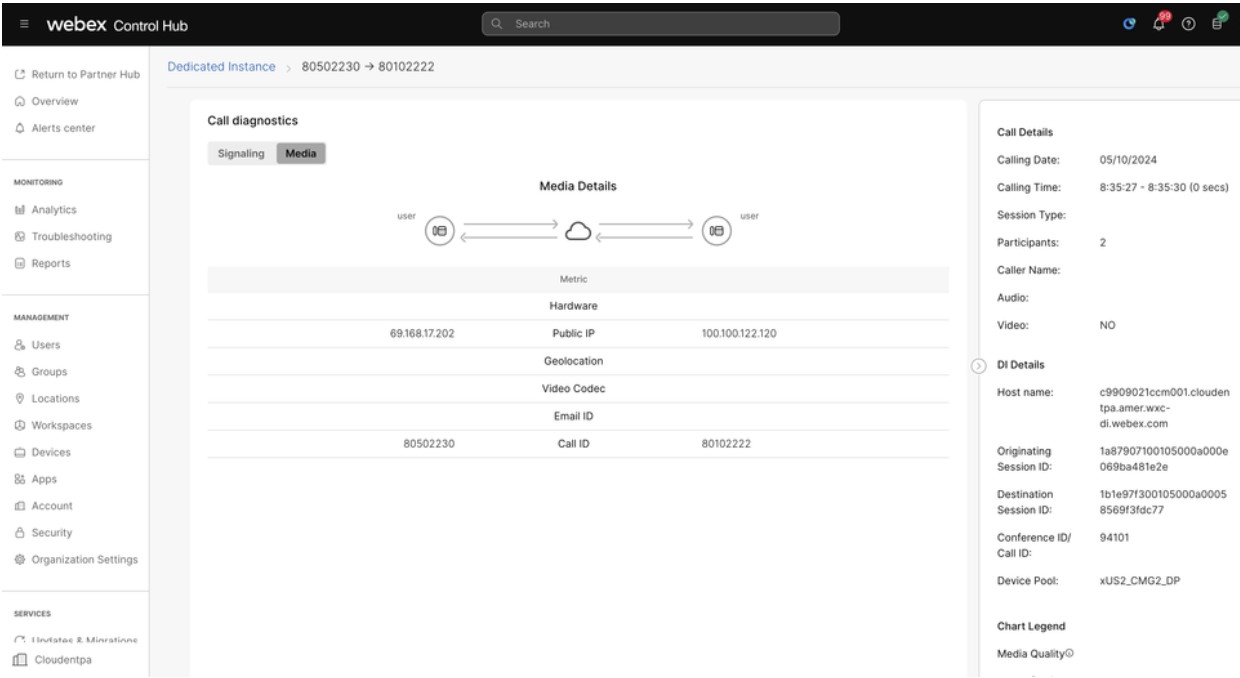
- Media
- Shows the media flow and its quality between two users.
- Metrics such as hardware information, IP address, Geolocation, Video codec, Email ID, and Call ID are displayed for both the users.
- Signaling
Legends on the troubleshooting view
See the following details in the right pane of the hop-by-hop view.
| Term | Definition |
| Calling Date | The date when the call occurred. |
| Calling Time | The time of when the call started and ended, shown in the time zone that you selected in the search view. |
| Session Type | The type of session that is supported. For example: Webex Call. |
| Participants | The number of participants who joined the call. |
| Caller Name | Name of the caller. |
| Audio | The type of audio used. |
| Video | Shows Yes if video is enabled by a participant. If video wasn't enabled at all, it shows No. |
| Term | Definition |
| Host name |
Hostname of the Unified CM node from where the call originated. |
| Origination session ID |
Session IDs are used in Call Detail Records (CDRs) to record the session IDs of the originating and terminating devices. These fields are populated when the session terminates, providing a unique identifier for the session associated with each device involved in the call. |
| Destination session ID | |
| Conference ID/Call ID |
Global Call ID is an identifier allocated each time a Cisco Unified IP Phone is taken off hook or a call is received from a gateway. |
| Device Pool |
DevicePool of the originating device/Caller, |
| Term | Definition |
| Hardware |
Displays one of the following:
|
| Public IP | This is the public IP address of the client as seen by the cloud. For enterprises, this is the address of the firewall providing the NAT. |
| Geolocation | Geo lookup of Public IP address. |
| Video Codec | (Send or Receive) The media encoding and decoding format in use for the media that are transmitted by a client. Applies only for a video call. |
| Call ID | The internal identifier that is used to identify the call leg. |
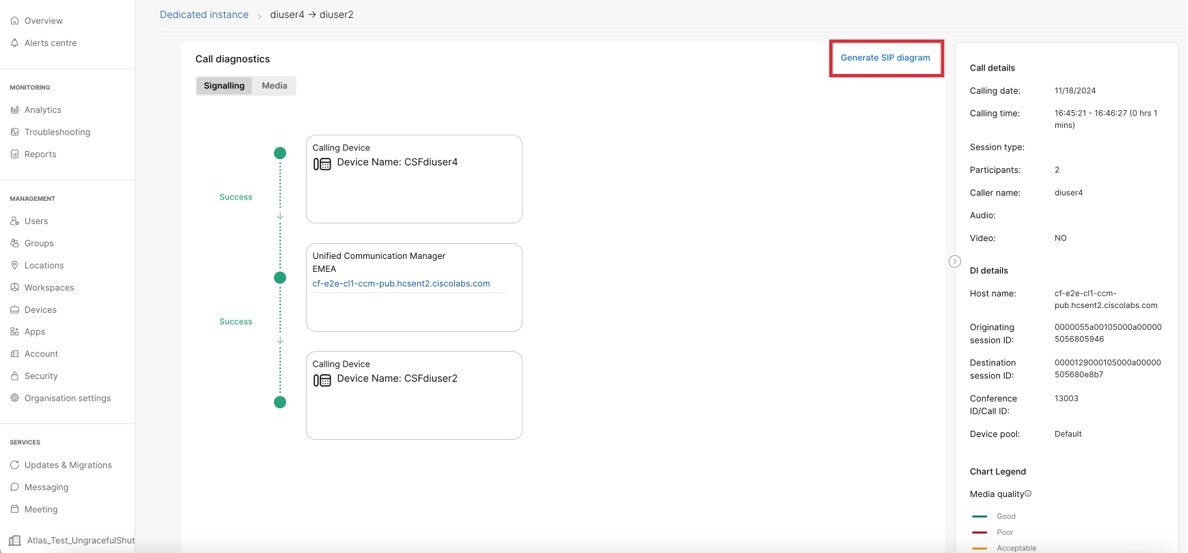
Generate SIP diagram and download log files
You can generate a SIP diagram and download SDL logs for a selected call. The SIP diagram provides a visual representation of SIP messages that are exchanged between endpoints, helping users understand the call flow and identify anomalies.
This functionality helps with:
-
Pinpointing where a call is failing or facing issues, such as registration failures or incorrect responses.
-
Tracing the entire call lifecycle—including setup, modification, and teardown—to understand how it progresses through the network.
-
Analyzing the timing of SIP messages to detect latency or delays that may impact call quality.
To generate a SIP diagram:
- Sign in to Control Hub, then go to Monitoring > Troubleshooting > Dedicated Instance.
-
Search for the call status, call quality, failure reason, user ID, phone number, session ID, device pool, and so on, of the call leg you'd like to view.
-
Click a specific call on the listing view, to inspect the ladder diagram of the call as per the call flow and the details of the call.
-
Click Generate SIP Diagram.
The logs are being collected from Unified CM nodes and uploaded to the cloud during this process.
-
Use the SIP diagram drop-down, to either view the SIP diagram or download logs for further analysis of the call.
The analysis time for viewing the SIP Diagram depends upon the size of the logs being retrieved for the duration of the call. Log sizes can range 10–300 MB, which influences the analysis duration, typically taking 1–5 minutes.
-
To view the SIP diagram:
- Click View the SIP diagram in the SIP
diagram drop-down.
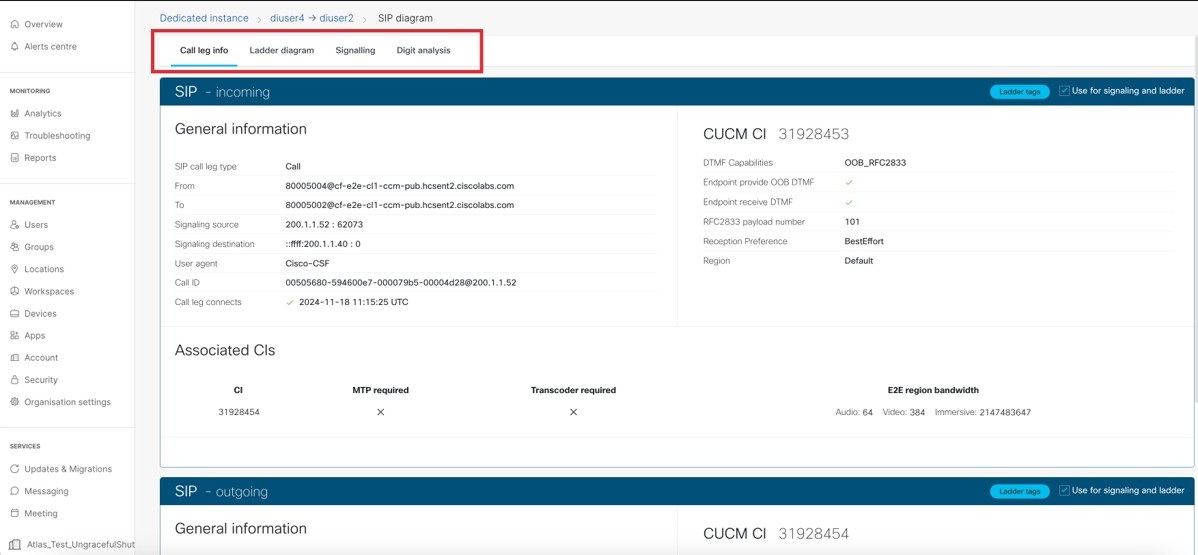
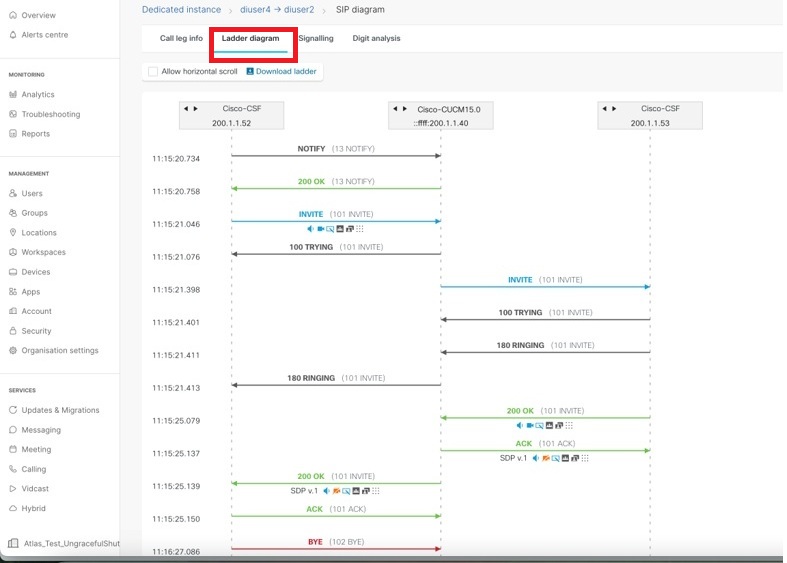
- Click Ladder diagram, which provides a visual
representation of the call signaling traversing the Unified CM clusters.
- Click View the SIP diagram in the SIP
diagram drop-down.
-
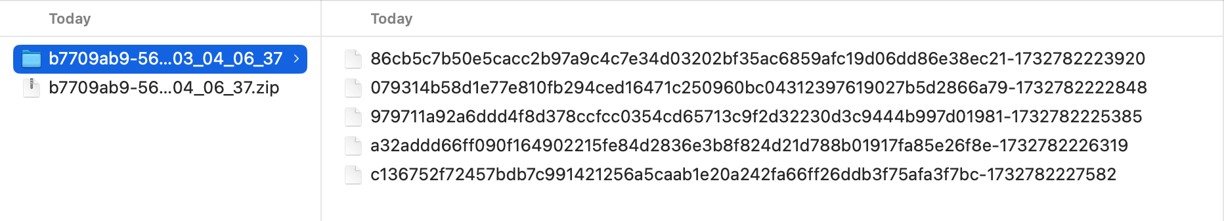
To download the log file:
-
Click Download log in the SIP diagram drop-down.
Extracting the downloaded zip file shows some files and each file represents logs collected from one of the nodes. Extract the inner file again to view the contents.
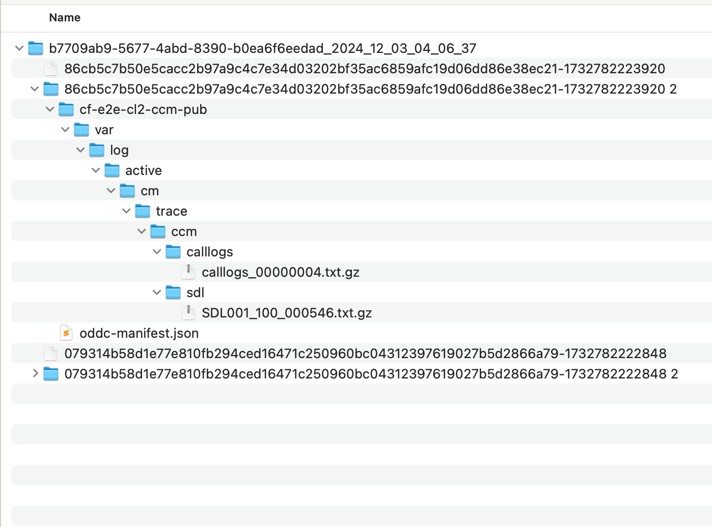
Upon extraction, the file reveals a folder that is named after the node's hostname, containing a directory structure that mirrors the original layout on the node. SDL and Call logs within this folder are organized based on the timestamps of call origination and disconnection.
-
-
Known issues and limitations
- Park and Retrieve, and CER 911 call aren’t supported. Signaling data not
available for the call' or This call type is not
supported is shown under the Signaling and
Media tabs.
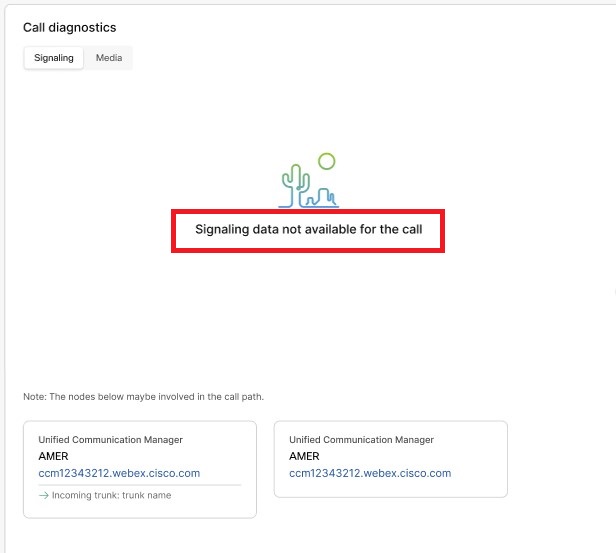
- Ladder diagrams are partially created if some CDRs aren't available or if they don't
contain all the information needed. There’s a related nodes section at the bottom showing
the nodes which might be involved in the call.
-
If the log rotation occurs and the SDL and CALL logs are not found for the duration when the call occurred, the analysis fails.


