Thanks for your feedback.
Advanced diagnostics and troubleshooting for your Webex for Government meetings in Control Hub
 Feedback?
If you're a full administrator, read-only administrator, or support administrator, you can use the Troubleshooting information that's presented in Control Hub to help you determine the root cause of meeting-related issues faced by your users. We include a powerful Diagnostics section as well, where you can drill down even further into specific meetings that are in progress or that have occurred within the past 21 days. Search for meetings by meeting number, the email address of the host or participants, conference ID, or the name of cloud-registered devices. You can then drill down into participant details, video quality, audio quality, and more.
Meetings in progress appear at the top of list with an In Progess status.
Rich troubleshooting data for Webex Events is available for participants who join through the desktop app, otherwise, only packet loss and latency data are available.
Only packet loss and latency data are available for Webex Training sessions.
View Troubleshooting Data
| 1 |
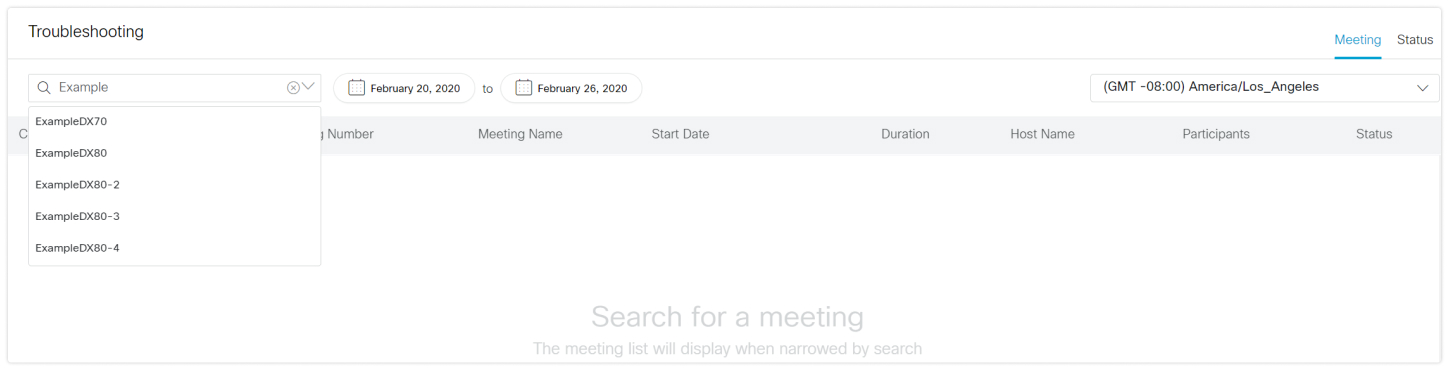
From the customer view in https://admin-usgov.webex.com, click Troubleshooting. |
| 2 |
Use the Search bar to search for a meeting by host email, participant email, meeting number, or conference ID. By default, you can see reports from the last 7 days, but you can click the
calendar icon The time zone is set according to your profile at the top right corner, but you can change the time zone anytime from the drop-down menu. For example, if a meeting host comes to you with an issue from a meeting that took place in a different time zone, you can switch to that time zone so that you don’t have to do the time conversion. 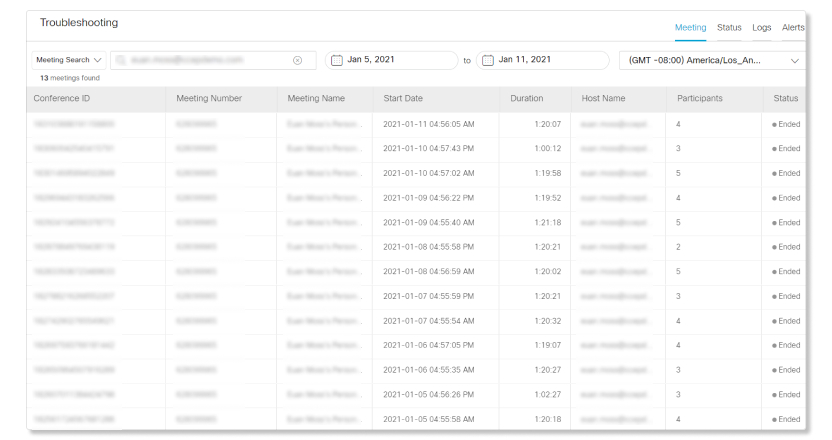 |
| 3 |
In the search results, select the meeting that you want more information about. |
 to specify a specific date for the report. You
can search for meetings that happened up to 21 days ago.
to specify a specific date for the report. You
can search for meetings that happened up to 21 days ago.If someone reports an issue with a meeting, you can search for the email of the host or participants, the 9-digit meeting number (also known as meeting access code), or conference ID. You have access to information such as what people were up to during the meeting (like hosting or sharing), when people joined audio and video, and how long the meeting lasted. Troubleshooting issues relating to meetings just got easier with this type of information at your fingertips.
If you click on a meeting and then use the back button to go back into the search view, the last viewed meeting is highlighted in yellow.
The time zone is set according to your profile setting, but you can change it at the top right corner.
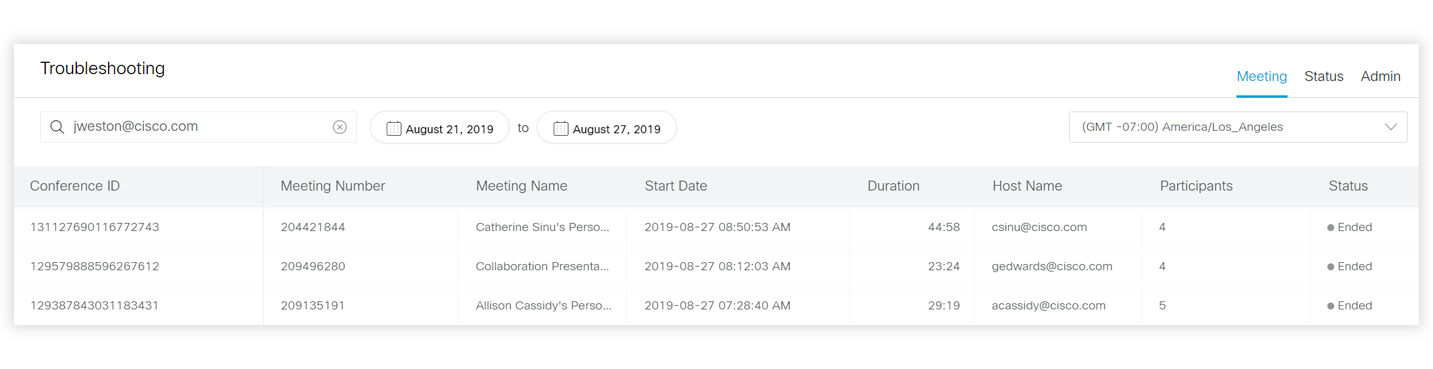
Search By Email
Enter someone’s email address, including the domain, to find out more about meetings they attended. See if they hosted meetings or who participated in meetings they were in. You can also see information about live meetings that are still in progress.
A list of meetings that have been hosted or attended by a specific person is shown. One meeting summary is shown per entry. Meetings that are in progress show up at the top of the list and are indicated with a status of In Progress. Ongoing meetings that have started within the past 10 minutes are considered to be in progress.
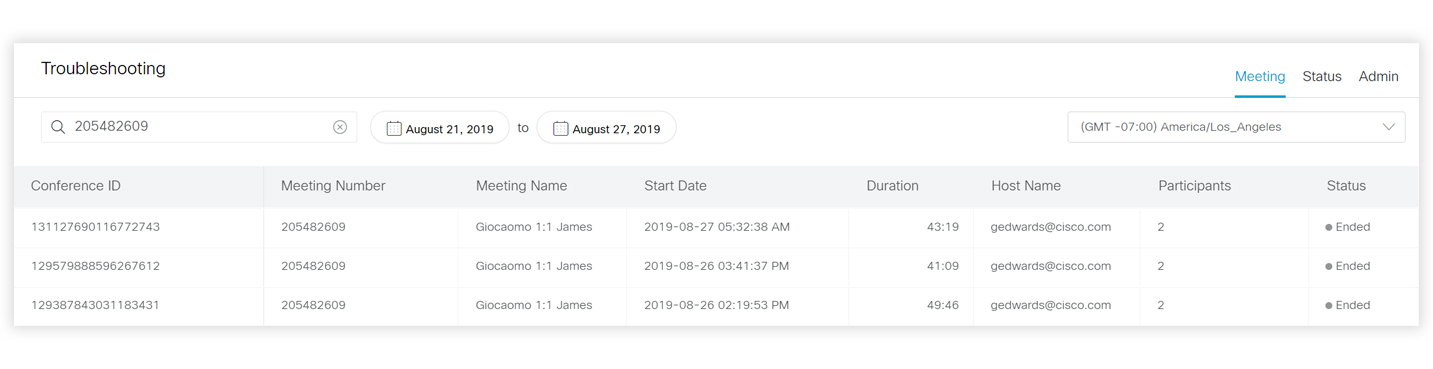
Search By Meeting Number
Meeting numbers are also known as the 9-digit access code. This number may not be unique across meetings. For example, a person's Cisco Webex Personal Room access code doesn't change from meeting to meeting.
Enter the 9-digit number without spaces or dashes. A list of meetings that match your search criteria display.
Search By Name of Cloud-Registered Device
Enter the name of a cloud-registered device to find out more about meetings joined from a specific device. If you search for a partial device name, such as Example, a drop-down list shows you the closest match that you can select from. If you search for the full name of the device, the meeting list shows you all the meetings joined from the device.
Search By Conference ID
Every meeting has a unique conference ID per meeting. The conference ID is an internal ID that isn't commonly available to users. You can locate this ID via Analytics.
Enter the conference ID in the search field. Conference IDs are 9 to 18 characters in length and can be alphanumeric. Meeting details for the conference ID you're looking for display.
Limitations
Wildcard searches, like searches that use special characters, are not supported.
Data isn't available for audio-only meetings, where every participant in the meeting (including the host) dialed into the meeting and no one joined through a client or device.
Data might not be available for one-on-one meetings on the Webex App app.
If the meeting was scheduled in a space, then use the meeting number to find the
meeting if you can't find the meeting using the host's email address. You can find
the meeting number by going to the space, selecting the activity menu and choosing
Meetings
![]() , then Space meeting
information.
, then Space meeting
information.
Once you select a meeting from the search view, you see the meeting view.
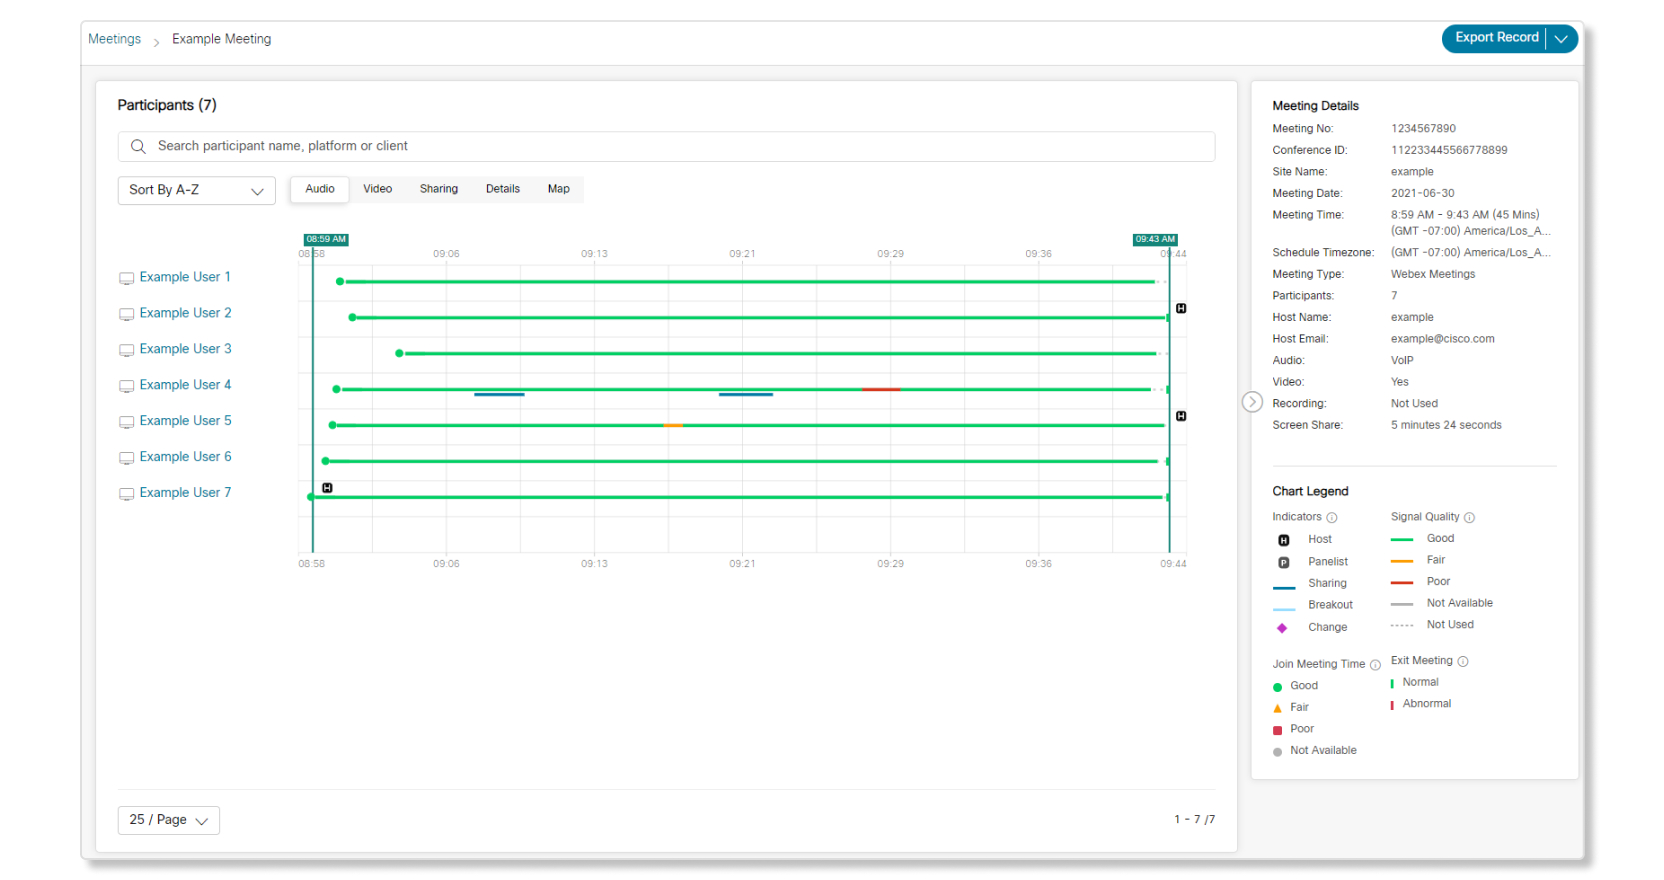
The meeting detail view lists all the participants on the left side, participant usage and quality information in the middle, and a sliding right panel with specific meeting details.
In progress meetings are shown with an  icon. In progress meetings don’t refresh
automatically. Click the refresh
icon. In progress meetings don’t refresh
automatically. Click the refresh  icon to update the meeting information that’s shown
on the page.
icon to update the meeting information that’s shown
on the page.
Participants List
The name of the participant or device, and the icon of the device used to join the meeting, shows up on the left. If someone joins a meeting using their Webex client and they connect audio with call back over PSTN, then two entries are shown. For example, when you call into a meeting and your Webex App app is paired with a Cisco Webex Room Device, there are two entries: Webex App app and Room Device.
Hover over a participant to see a short summary about the participant, such as the client type used to join the meeting. When someone calls into a meeting, you can see their join time, and the amount of time they were in the meeting.

Join Meeting Time (JMT)
The JMT for each client is captured with the exception of calls using PSTN. JMT is calculated in seconds as (the time from clicking the meeting link to loading the preview window) + (the time from clicking the Join Now button in the preview window to connecting into the meeting).
JMT doesn’t count the time the user spends browsing menus, making selections in the preview window, or waiting in the lobby.
A JMT of less than 10 seconds is shown in green, between 10 and 20 seconds is shown in yellow, and over 20 seconds is shown in red. Hover over the colored dot to see the JMT of a participant.
A participant’s join meeting time will always show the first time that the participant joined the meeting, even if the participant leaves and re-joins the meeting multiple times.

Meeting Details
Meeting details are shown on the right-side sliding panel, and can be collapsed with
the  icon.
icon.

Meeting details include a summary of the meeting, such as the meeting number, conference ID, the Webex site name, the date and time the meeting took place, the type of meeting that was held, the number of participants, and the host's name and email address. The Meeting details also indicates if audio, video, and recording were used, and if a screen was shared how long the screen share lasted.
The host name and email indicate the user who scheduled the Webex meeting or the person who created the meeting in Webex App.
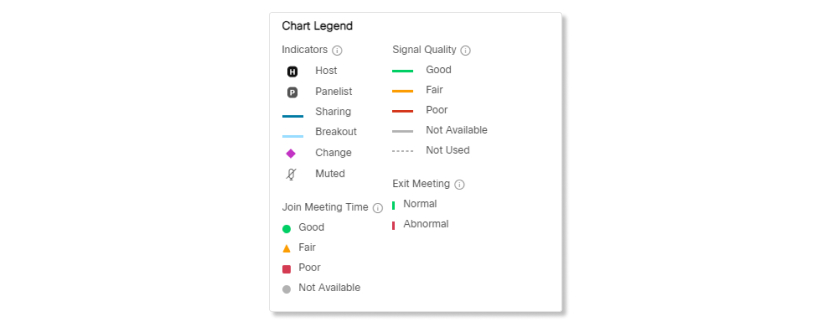
A legend is provided under the panel. Hover over the information  icon to see how the thresholds are defined.
Audio, Video, and Sharing Tab
You can switch between the Audio, Video, and Sharing tabs to see the detailed views of a meeting, which includes JMT, usage, and quality metric.
Quality data is updated every minute. Network quality is visualized using green (good), yellow (fair), or red (poor). If you see a dotted gray line, it means the audio, video, or sharing of the device is turned off. If you see a solid gray line, that indicates only minimal data is available, like usage and JMT. Solid gray lines mean the user joined the meeting with an application or device that is older than the minimum supported version or a Cisco on-premises device.
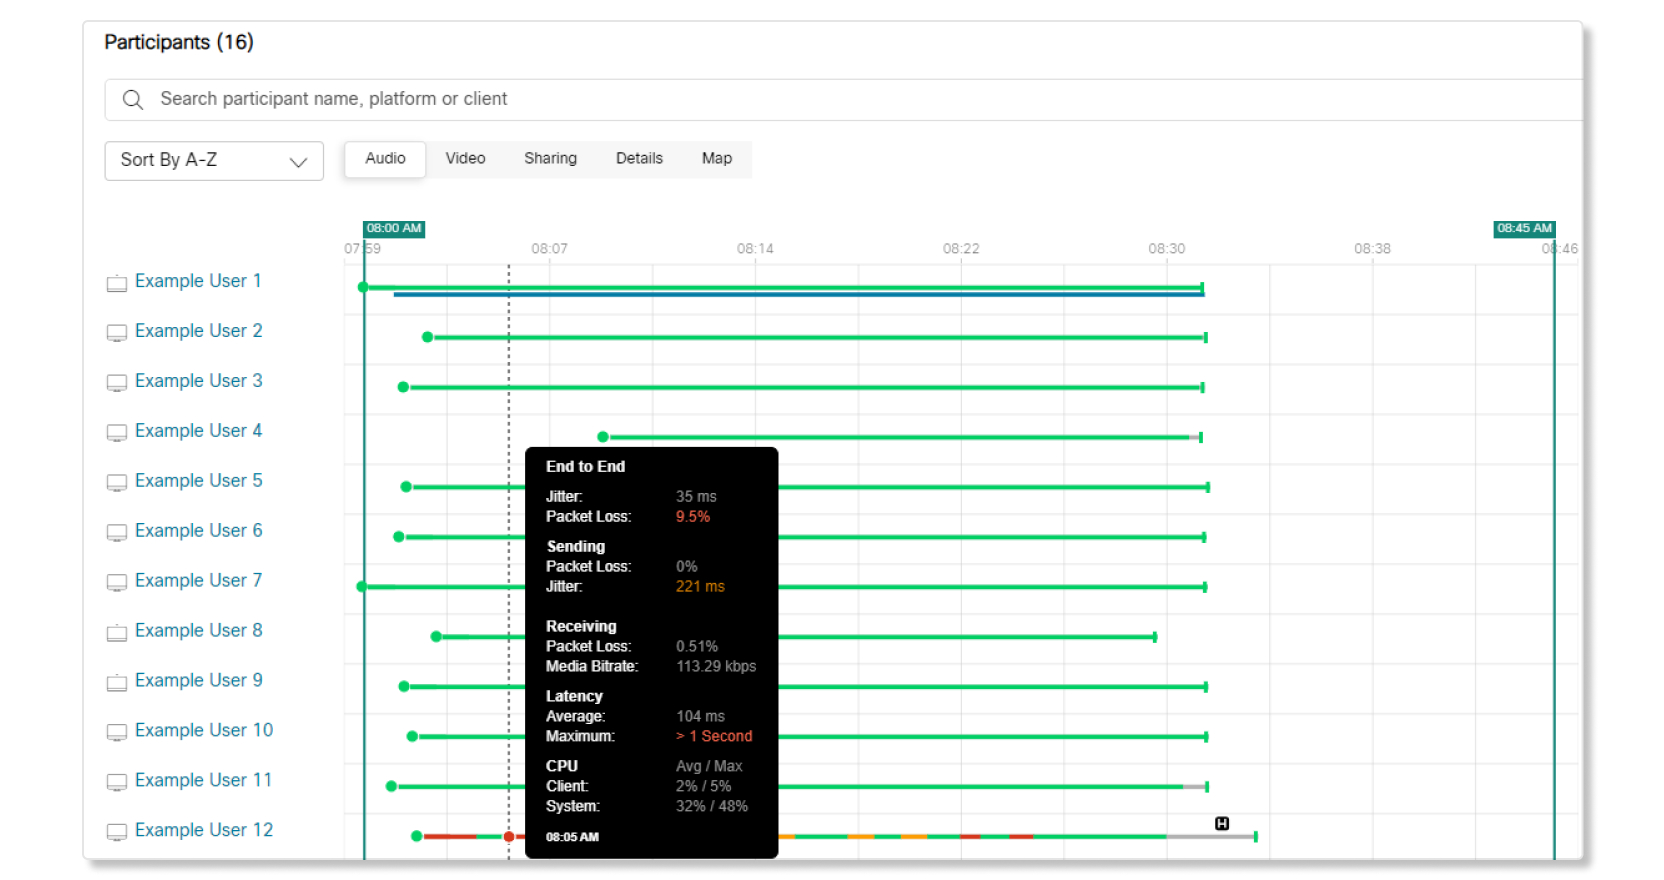
You can hover over a line to see a summary of the quality metric as a pop-up.
Host and Share Indicator
An H  icon indicates when a participant becomes the host of
the meeting and a blue line shows who's sharing their screen.
icon indicates when a participant becomes the host of
the meeting and a blue line shows who's sharing their screen.
Hardware Change Indicator
A purple diamond  icon indicates when a participant changes their network
connection, headset, microphone, or camera during a meeting. Hover over the icon to
see the change details.
icon indicates when a participant changes their network
connection, headset, microphone, or camera during a meeting. Hover over the icon to
see the change details.
The dotted line shows you how long a participant was muted for, and you can hover over the icon to see if the participant muted and unmuted multiple times within that duration.
End Meeting Indicator
If a participant joined a meeting using VoIP with the Webex Meetings app, Webex App app, or a device, then you can see how a meeting ended for that participant. A
green line  icon indicates when a participant left a meeting
normally, while a red line
icon indicates when a participant left a meeting
normally, while a red line  icon indicates when a participant left a meeting
unexpectedly, such as getting dropped from a meeting due to a system or network
issue.
icon indicates when a participant left a meeting
unexpectedly, such as getting dropped from a meeting due to a system or network
issue.
Details Tab
The Details tab provides a table view of participants. You can see how long they were in the meeting for, the client and platform they used to join a meeting, their IP addresses, their hardware information, how they ended a meeting, the location they joined from, and if they were the host. You can use the scroll bar to see additional information, such as the participant's dialed #, audio, video and share transport and codec, microphone, speaker, and camera. This table can be exported to a CSV file using the Export Record button at the top right.
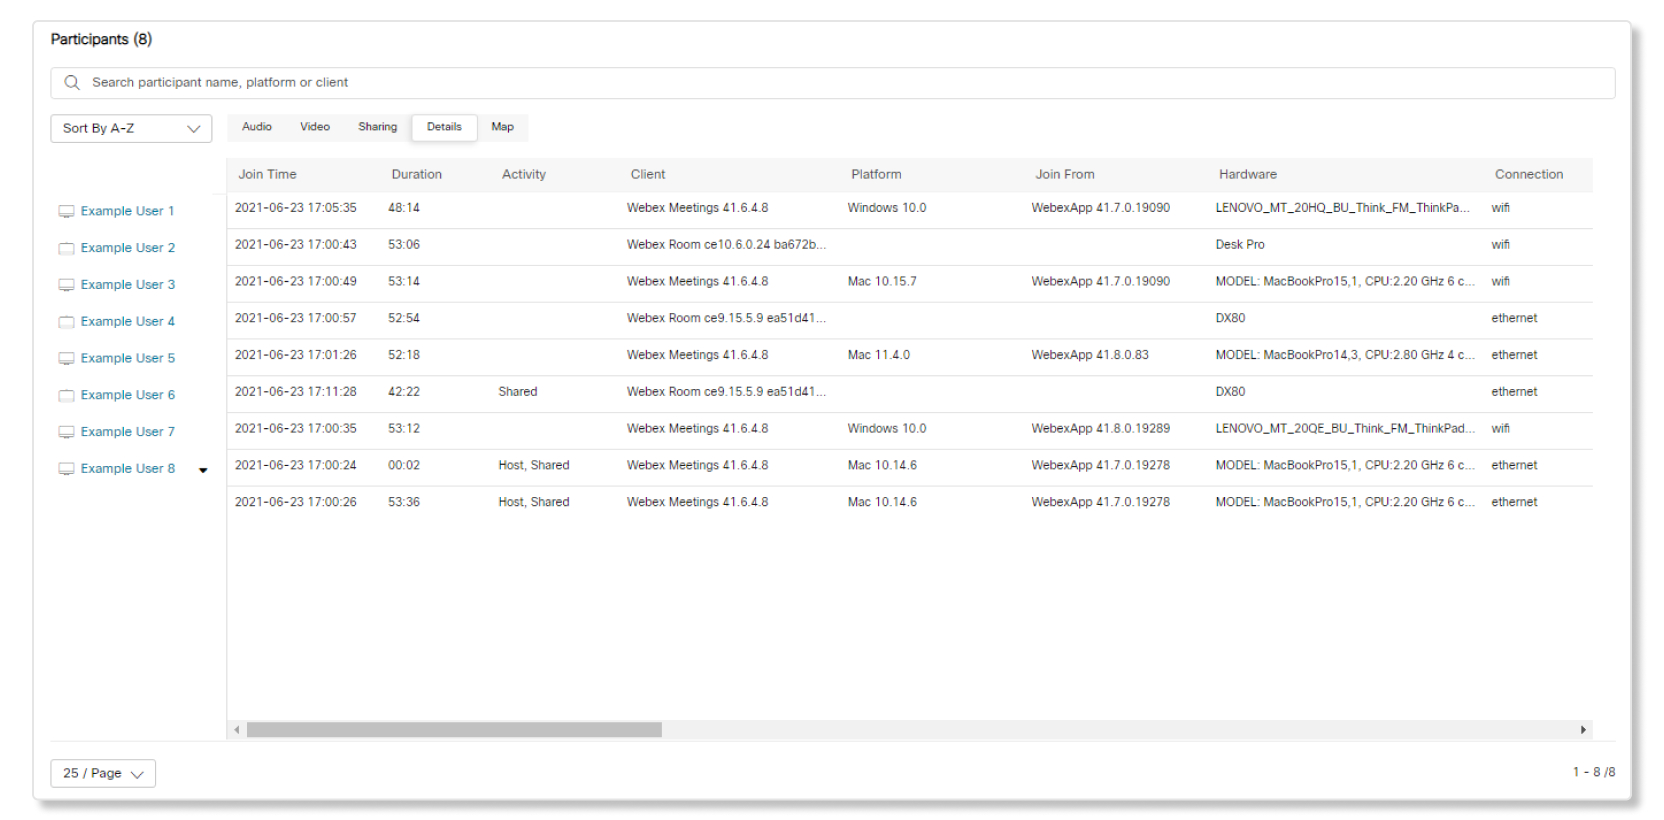
The meeting details shows values that are relevant to the meeting. If a feature or function wasn't used, like if no one shared their screen during the meeting, then the value is left blank.
Here is the Details data that is available.
|
Title |
Description |
|---|---|
|
Join Time |
When the participant joined the meeting shown in the time zone you select. |
|
Duration |
Duration of the meeting. |
|
Activity |
If the participant was the host, was transferred the host role, or shared content during the meeting. |
|
Client |
The type and version of the application used to join the meeting. |
|
Platform |
The operating system and version of the device used to join the meeting. Possible values could be "windows", "mac", "android", "ios", and "linux” |
|
Join From |
If the participant joined the meeting by browser, this shows the browser type and version used to join the meeting. |
|
Hardware |
This hardware make and model of the device used to join a meeting. For computers, this might be "Lenovo Thinkpad p60". For phones, this might be "Samsung Galaxy S7". For room devices, this might be "Cisco Webex Room Kit". |
|
Connection |
The type of network connection that the client used to exchange media. Possible values could be "wifi", "ethernet", "cellular", or "unknown". This is not tracked per media type. It it is possible (and relatively common) that this changes over the course of a meeting. |
|
Local IP |
The local IP address of the client for the network interface that it is using to transmit media. |
|
Public IP |
This is the public IP address of the client as seen by the media servers. |
|
Location |
Geo lookup of Public IP address. |
|
Media Node |
The datacenter or region of the media node that the client is connected to. For cloud based media nodes this will be a general region name such as "San Jose, USA". For video mesh based media nodes, this will have a more specific name that matches the video mesh cluster name that was provisioned by the customer. |
|
System Code |
What happened to the participant during a meeting. The system codes available are:
|
|
Phone |
The phone number of the participant. |
|
Dialed # |
The conference bridge PSTN number. |
|
Audio Transport |
The network type used to transport audio. Valid values could be "UDP", "TCP", "xTLS". This can change over the course of a meeting, however, only the initial transport used is reported. |
|
Video Transport |
The network type used to transport video. Valid values could be "UDP", "TCP", "xTLS". This can change over the course of a meeting, however, only the initial transport used is reported. |
|
Share Transport |
The network type used to transport a screen or application share. Valid values could be "UDP", "TCP", "xTLS". This can change over the course of a meeting, however, only the initial transport used is reported. |
|
Audio Codec |
(Send) The media encoding and decoding format in use for the media transmitted by a client. Note that this can change over time during a call. (Receive) The media encoding and decoding format in use for the media received by a client. This can change over the course of a meeting, however, only the initial codec used is reported. |
|
Video Codec |
(Send) The media encoding and decoding format in use for the media transmitted by a client. Note that this can change over time during a call. (Receive) The media encoding and decoding format in use for the media received by a client. This can change over the course of a meeting, however, only the initial codec used is reported. |
|
Share Codec |
(Receive) The media encoding and decoding format in use for the media received by a client. This can change over the course of a meeting, however, only the initial codec used is reported. |
|
Microphone |
The brand name and model information for the the microphone that was used during the meeting. This can change over the course of a meeting, however, only the initial microphone used is reported. |
|
Speaker |
The brand name and model information for the the speaker that was used during the meeting. This can change over the course of a meeting, however, only the initial speaker used is reported. |
|
Camera |
The brand name and model information for the the camera that was used during the meeting. This can change over the course of a meeting, however, only the initial camera used is reported. |
Export
From the meeting or participant view, you can export meeting information in a JSON file. You can also export the participant list and details to a CSV file.
Presenter and host information in the data tab isn't included in the JSON file.
Click on a participant name to see the detailed metrics of their client and device. All information is updated every minute. Additional information about a participant's equipment and network can be found on the right side.
Participant Details
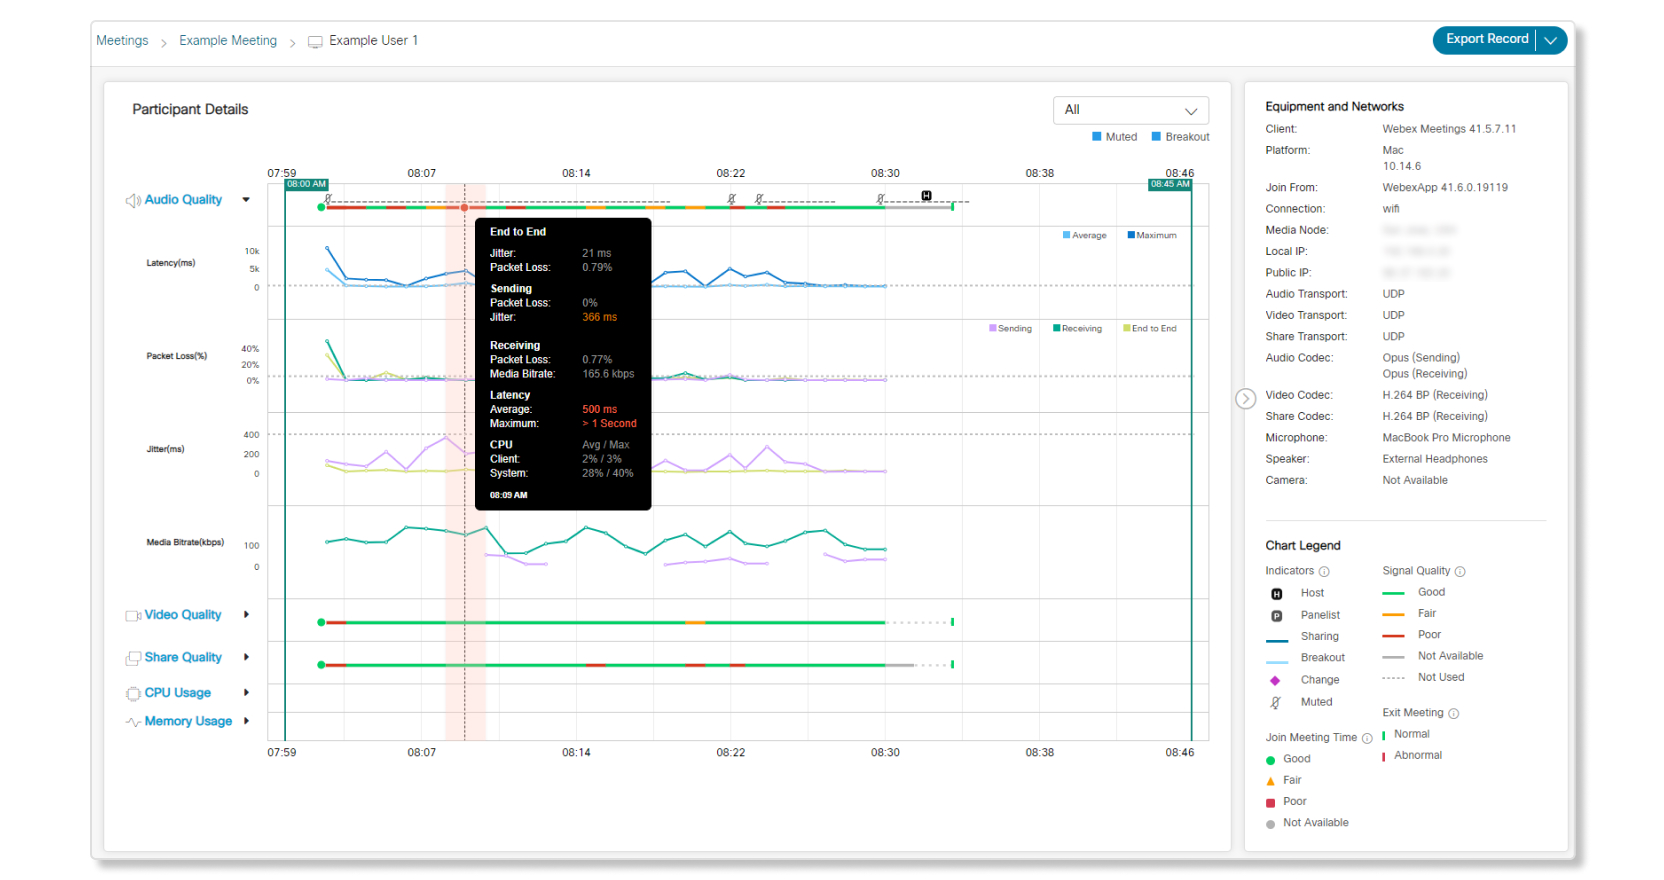
You can click on the down arrow on any of the charts to collapse them. You can also switch between showing Sending & Receiving, Sending, or Receiving details with the drop-down menu next to Signal.
Audio Quality, Video Quality, Share Quality,CPU Usage, and Memory Usage data is updated every minute for meetings that are in progress.
You can click the red or yellow line segments to highlight the selection with a vertical bar. Then hover over each of the line to show the pop up with the actual value and timestamp of each chart.
-
Audio Quality—The quality of the audio experienced by that participant throughout the meeting.
-
Video Quality—The quality of the video experienced by that participant throughout the meeting.
-
Share Quality—The quality of any content shared during the meeting. The share quality includes information on how content was sent and received.
-
CPU Usage—The percentage of the CPU that was used by the machine that the participant joined the meeting with.
-
Memory Usage—The percentage of memory that was used by the machine of the participant during the meeting.
Mute Indicator
A mute  icon indicates when a participant was muted during a
meeting. The mute indicator shows for participants who clicked the mute button on
the Webex Meetings desktop and mobile app, the Webex App desktop and mobile app, and cloud-registered room devices. If a participant was
muted through an external hardware, like a microphone, then the mute indicator
doesn't show.
icon indicates when a participant was muted during a
meeting. The mute indicator shows for participants who clicked the mute button on
the Webex Meetings desktop and mobile app, the Webex App desktop and mobile app, and cloud-registered room devices. If a participant was
muted through an external hardware, like a microphone, then the mute indicator
doesn't show.
Mute on entry only shows for participants who join from the Webex App desktop and mobile app.
Here are the quality metrics that are available.
|
Title |
Description |
|---|---|
|
Latency(ms) |
Latency is a delay in the delivery of audio or video during a meeting. |
|
Packet Loss (%) |
Packet loss occurs when there is a problem transmitting data packets, and some packets are dropped before they are received by the recipient. |
|
Jitter(ms) |
Jitter is a variation in the delay of packets that are received. |
|
Media Bitrate(kbps) |
Bit rate is the number of bits that are processed per second. |
|
Frame Rate(fps) |
Frame rate is the number of frames that are shown every second of a meeting. |
|
Resolution(p) |
Resolution is the number of pixels shown on user’s screen during a given amount of time. |
|
System CPU(%) |
The total percentage of CPU that is used by all applications. On a multi-core system, CPU usage is measured across all cores. |
|
Webex App CPU(%) |
The percentage of CPU that is taken by Webex Meetings or the Webex App app during the meeting. On a multi-core system, CPU usage is measured across all cores. |
|
System Memory(%) |
The total percentage of memory that is used by all applications. |
|
Webex App Memory(%) |
The total percentage of memory that is taken by Webex Meetings or the Webex App app during the meeting. |
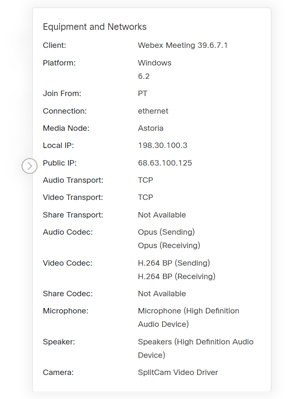
Equipment and Networks Details
The Equipment and Networks panel shows you information about a participant's
configuration. You can collapse the panel with the icon.
Similar information is available for the Webex Meeting Desktop application, Webex App Desktop application, Webex App for Android, Webex App for iPhone and iPad, and cloud-enabled devices. Webex Meetings for mobile, on-premises devices, and 3rd party SIP devices will be supported in the near future.
Platform, microphone, speaker, and camera details aren't availble for cloud-enabled devices.
Only phone number and conference bridge information is available for call in and callback users.
For PSTN: Call In and Call Back, only phone numbers or conference bridge information is available.
Here is the equipment and network data that is available.
|
Title |
Description |
|---|---|
|
Client |
The type and version of the application used to join the meeting. |
|
Platform |
The operating system and version of the device used to join the meeting. Possible values could be "windows", "mac", "android", "ios", and "linux” |
|
Join From |
If the user joined the meeting by browser, this shows the browser type and version used to join the meeting. |
|
Hardware |
This hardware make and model of the device used to join a meeting. For computers this might be "Lenovo Thinkpad p60". For phones this might be "Samsung Galaxy S7". For room devices this might be "Cisco Webex Room Kit". |
|
Connection |
The type of network connection that the client used to exchange media. Possible values could be "wifi", "ethernet", "cellular", or "unknown". This is not tracked per media type. It it is possible (and relatively common) that this changes over the course of a meeting. |
|
Local IP |
The local IP address of the client for the network interface that it is using to transmit media. |
|
Public IP |
This is the public IP address of the client as seen by the media servers. |
|
Location |
Geo lookup of Public IP address. |
|
Media Node |
The datacenter or region of the media node that the client is connected to. For cloud based media nodes this will be a general region name such as "San Jose, USA". For video mesh based media nodes, this will have a more specific name that matches the video mesh cluster name that was provisioned by the customer. |
|
Audio Transport |
The network type used to transport audio. Valid values could be "UDP", "TCP", "xTLS". This can change over the course of a meeting, however, only the initial transport used is reported. |
|
Video Transport |
The network type used to transport video. Valid values could be "UDP", "TCP", "xTLS". This can change over the course of a meeting, however, only the initial transport used is reported. |
|
Share Transport |
The network type used to transport a screen or application share. Valid values could be "UDP", "TCP", "xTLS". This can change over the course of a meeting, however, only the initial transport used is reported. |
|
Audio Codec |
(Send) The media encoding and decoding format in use for the media transmitted by a client. Note that this can change over time during a call. (Receive) The media encoding and decoding format in use for the media received by a client. This can change over the course of a meeting, however, only the initial codec used is reported. |
|
Video Codec |
(Send) The media encoding and decoding format in use for the media transmitted by a client. Note that this can change over time during a call. (Receive) The media encoding and decoding format in use for the media received by a client. This can change over the course of a meeting, however, only the initial codec used is reported. |
|
Share Codec |
(Receive) The media encoding and decoding format in use for the media received by a client. This can change over the course of a meeting, however, only the initial codec used is reported. |
|
Microphone |
The brand name and model information for the the microphone that was used during the meeting. This can change over the course of a meeting, however, only the initial microphone used is reported. |
|
Speaker |
The brand name and model information for the the speaker that was used during the meeting. This can change over the course of a meeting, however, only the initial speaker used is reported. |
|
Camera |
The brand name and model information for the the camera that was used during the meeting. This can change over the course of a meeting, however, only the initial camera used is reported. |
|
Type |
The type of call made. Values might be Edge Audio, Toll number or Toll Free number |
|
Phone |
The phone number of the Participant. |
|
Dialed # |
The conference bridge PSTN number. |
|
Join Time |
When the participant joined the meeting shown in the time zone you select. |
|
Duration |
Duration of the meeting. |
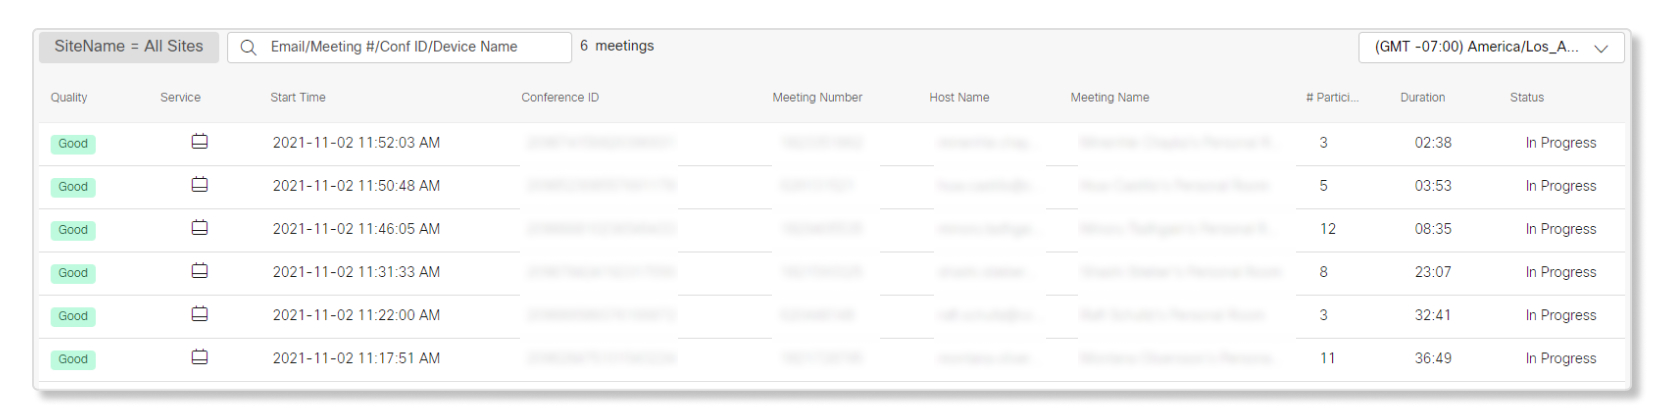
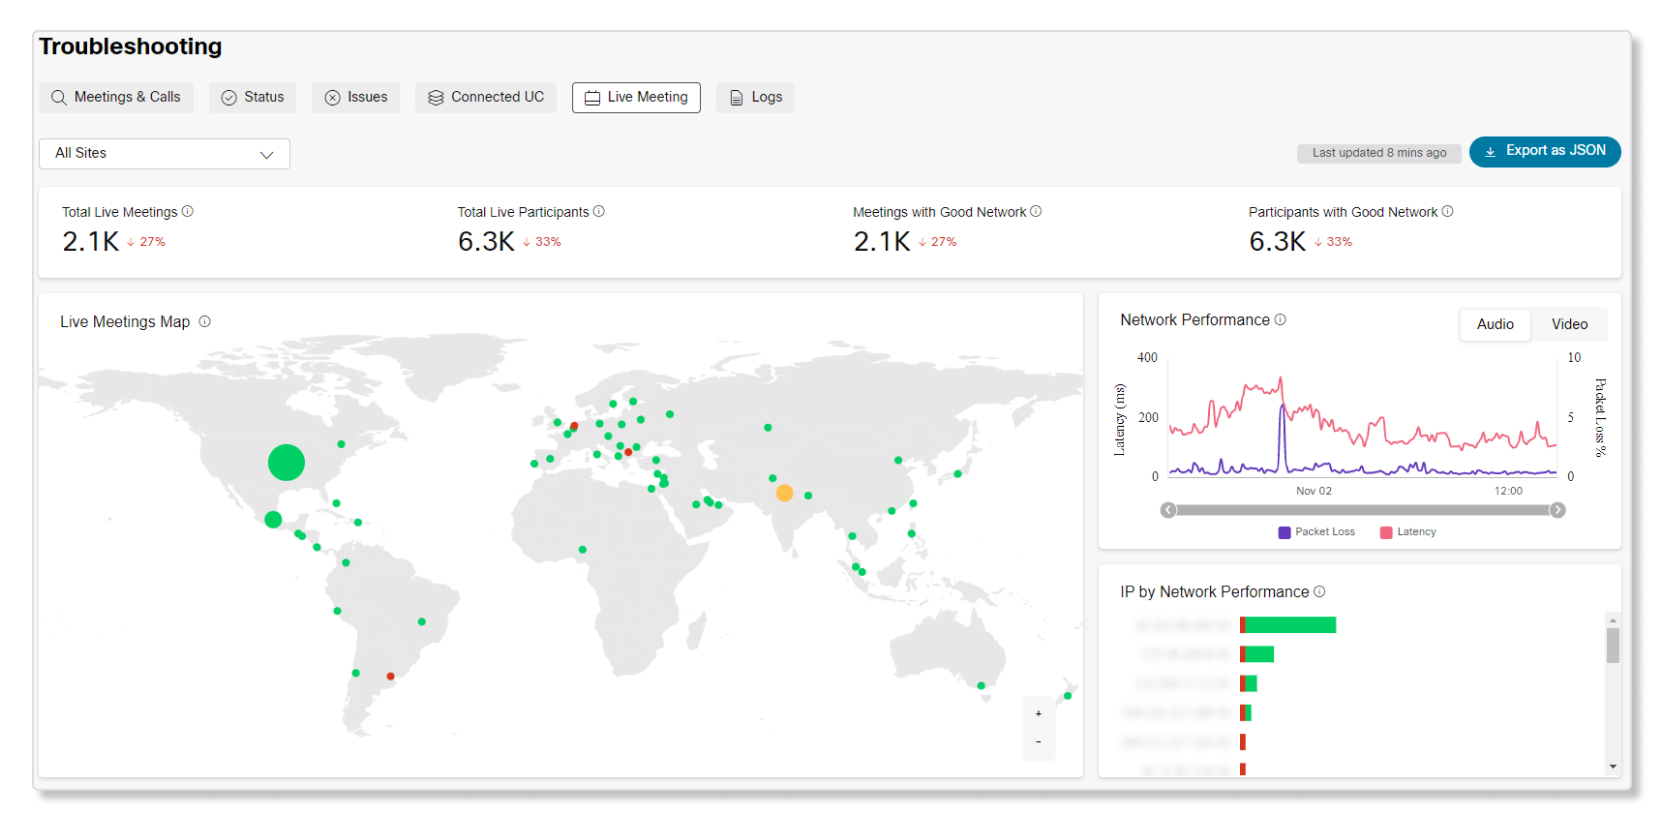
The Live Meetings tab shows all the meetings that are currently in progress in your organization. You can use the information here to proactively catch network issues before they become widespread, or to help diagnose the cause for any network issues. Data automatically updates every 10 minutes. You can see when the last time the data was updated next to the Export as JSON button.
By default, the page shows you the live meetings for all the sites in your Control Hub organization. If you have multiple sites, you can use the drop-down menu to select a specific site.
Key performance indicators (KPIs)
KPIs are available at the top of the page to show you the number of live meetings and how many meetings and participants are experiencing good network. You can use these KPIs as measurable data to see if any network issues have been happening recently. The KPIs available are:
-
Total Live Meetings—The number of meetings that are in progress.
-
Total Live Participants—The number of participants that are currently in meetings.
-
Meetings with Good Network—The number of meetings that are at or above the good network quality threshold. Quality is counted as good if packet loss was less than or equal to 5% and latency was less than or equal to 400ms. Meetings are counted as poor quality if at least one participant had poor audio or video quality in the last 15 minutes.
-
Participants with Good Network—The number of participants that are at or above the good network quality threshold. Quality is counted as good if packet loss was less than or equal to 5% and latency was less than or equal to 400ms. Participants are counted as poor quality if they had three consecutive minutes or five accumulated minutes of poor audio or video quality during a meeting.

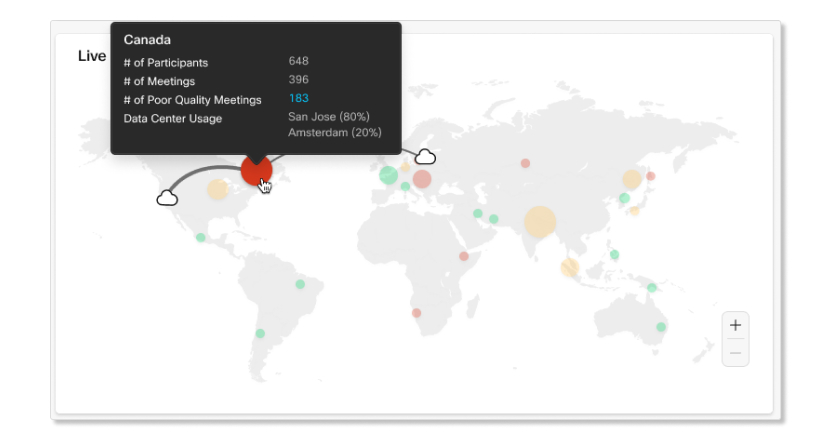
Live meetings map
This map shows the overall geographic distribution of live meetings. You can hover over each circle to see more data about a location, such as the number of participants, meetings, and poor quality meetings. You can also select the data centers to which the participants in a location are connected. The names for the data centers are abbreviated. The size of the circle is based on how many participants there are, and the color is based on how many poor-quality meetings a location is experiencing.
If you have the Advanced Troubleshooting role, you can click on the number next to poor-quality meetings when you hover over a location to filter the live meetings table by poor-quality meetings from that location.
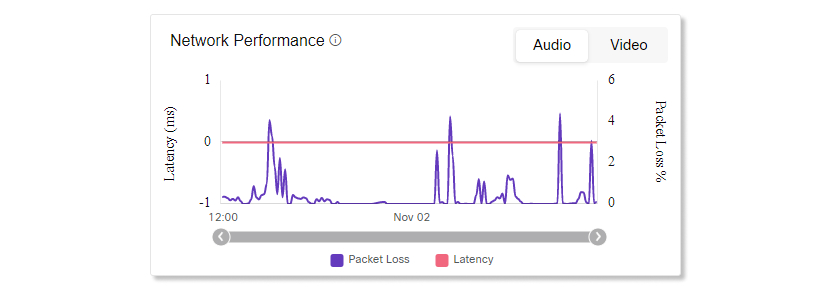
Network performance
This chart shows a trend of the latency and packet loss experienced by participants during meetings that are in progress. You can switch between data for audio and video. You can also adjust the sliding bar to see what the 95th percentile was between a 24-hour period.
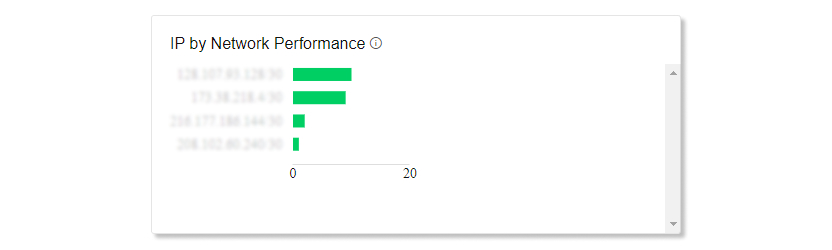
IP by network performance
This chart shows a breakdown of IP addresses and the network quality of participants who connected to those IP addresses. IP addresses are partially masked to preserve the personal identity of users. You can use this chart to see if a specific location or service provider has a higher number of poor-quality meetings than average, and start troubleshooting from there.
Hover over the red bar to see the number, percentage, and location of poor-quality meetings from that IP address. Hover over the green bar to see the same breakdown of good-quality meetings from that IP address.
Live meetings search table
If you're a full administrator, read-only administrator, or support administrator with the Advanced Troubleshooting Access role, you have access to a table that shows all the meetings that are in progress. Use the search bar to search for specific meetings or quickly filter participants by interacting with the other charts.
For example, if you notice a location with lots of poor-quality meetings in the Live Meetings Map, you can hover over that location and click on the number next to # of Poor Quality Meetings. This will filter the table to only show the meetings that those participants are in.
Another example is in the IP by Network Performance chart. If you hover hover a red bar and click the number of poor connections, this will filter the table to only show the meetings where participants connected to that IP address.
Selected filters show before the search box, which you can remove by clicking the X.