
Thanks for your feedback.
Analytics for Your Webex Cloud-Connected UC
 Feedback?
View Analytics
The Cloud-Connected UC cloud sends the data that it collects to the Analytics UI. You can view the analytics data for your on-premises applications and devices in the Control Hub.
-
The charts show data in Greenwich Mean Time (GMT).
-
The charts related to endpoints may not show any data for Cisco Unified Communications Manager Session Management Edition (Unified CM-SME) clusters.
-
If the Cisco Unified Communications Manager version is upgraded from version X to version Y, then both of the versions are displayed in the Analytics charts. The latest data is shown under Unified CM Version against the latest upgraded version. However, the calls that are counted against the previous version continue to show for the selected duration.
-
When you change the Unified CM Cluster ID, the Analytics Cluster drop-down list shows the updated cluster name from next day onwards. The detailed view charts in both service experience and asset usage Unified CM Cluster chart shows the latest cluster name. The older cluster name continues to show and represent the previously processed call count.
-
Analytics now supports user filters.
-
You can use the user filters such as the User ID, URI, and Phone Number to filter the various charts in Analytics. If the Data Collection Agreement hasn't been accepted yet through any other service, clicking on these filters would provide you an option to review and accept the agreement.
-
This information is also available in downloaded data for the Service Experience and Asset Usage charts.
-
Analytics now supports Calling Number and Called Number charts as well.
-
-
If you face any issues while viewing the Analytics charts, see the Analytics User Interface Issues section in Troubleshoot Webex Cloud-Connected UC.
Before you begin
You must enable Analytics service on the Service Management page for the desired cluster. For more information, see Enable Cloud-Connected UC Services in Control Hub.
| 1 |
From the customer view in Control Hub, go to . The Analytics page appears. |
| 2 |
(Optional) To view the analytics for Mobile Remote Access data, enable the Mobile and Remote Access data only toggle. |
| 3 |
(Optional) Choose a cluster from the cluster selection drop-down list in the top right. The default setting is All Clusters. |
| 4 |
To filter the data in the charts based on the time period, choose a value from the time period selection drop-down list in the top right. The supported time ranges are:
You can view the charts for the period you've selected. The default time range is Last 30 Days. If you select Yesterday from the drop-down list, the UP and DOWN trends are based on the data that is compared with the two days before the previous day. Similarly, if you select Last 7 Days, then the % UP or DOWN trends are calculated based on the comparison between data for the previous 7 days with the data for the previous fortnight. |
The Service Experience dashboard helps you to analyze the service quality distribution and traffic trends based on number of calls, location, or call duration.
The CMR must provide Severely Concealed Seconds (SCS) values. This is required for grading the quality of the calls.
Data Source
The device details for this are collected from the Cisco Unified Communications Manager and the call quality details are derived from the CMR and graded at CDR level.
View the Details About Call Volume Status
View the Details About Call Volume Status
| 1 |
From the customer view in Control Hub, go to . The Analytics page appears. |
| 2 |
Click the Call Volume Status card to view the information about call completion in terms of attempted, successful, failed, and dropped calls. On the page that appears, you can select various filters to visualize charts based on your selection. For more information, see Charts on the Details Page for Call Volume Status. If you face any issues while viewing the charts, see the Analytics User Interface Issues section in Troubleshoot Webex Cloud-Connected UC. |
Key Performance Indices for Call Volume Status
The metrics pane at the top of the details page shows the Key Performance Indicators (KPIs). These help you to better understand the utilization of Cloud-Connected UC in your organization.
The following table describes the KPIs for Call Volume Status.
|
Field Title |
Description |
|---|---|
|
Total attempted calls |
All calls, including the completed and failed. |
|
Successful calls |
All the successful calls made from that endpoint model. |
|
Failed calls |
All calls that failed. |
|
Dropped Calls |
Non zero duration failed calls. |
Charts on the Details Page for Call Volume Status
The following table describes the information that is displayed on the various charts.
|
Card Title |
Description |
|---|---|
|
Call Status Distribution |
This card displays the trend of all the attempted, successful, failed, and dropped calls. It also provides the count and a percentage of calls in comparison with the total attempted calls. |
|
Call Status Trend |
This card depicts the deployment trend of all the attempted, successful, failed, and dropped calls that are made and received in a network. It also provides the count of the successful, failed, and dropped calls for a particular day.
To display only the trend of successful calls, on the legend, click failed to unselect and the chart is updated accordingly. |
|
Endpoint Media Capability |
This card depicts the distribution of the attempted, successful, failed, and dropped that are made or received using audio and video endpoints. By default, in the pie chart, the media capability and the corresponding call volume count are displayed. |
|
Call Media Type |
This card depicts the distribution of all the attempted, successful, failed, and dropped in a network based on the call media (audio or video) type. By default, in the pie chart, the call media type and the corresponding call volume count are displayed. You can select a call media type (audio or video) on the pie-chart, and the rest of the Call Volume Status cards are updated accordingly based on this filter. |
|
Endpoint Series |
This card depicts all the attempted, successful, failed, and dropped calls that are made and received in a network based on the endpoint series. It also provides the count of call volume for each endpoint series. |
|
Unified CM Cluster |
This card depicts the distribution of all the attempted, successful, failed, and dropped calls that are made and received in a network based on Unified CM cluster. By default, in the pie chart, all the clusters and the corresponding call volume count is displayed. You can select a cluster on the pie-chart, and the rest of the Call Volume Status cards are updated accordingly based on this filter. You can select or unselect a cluster on the legend by clicking on it, and the chart is updated accordingly. |
|
Distribution by Time |
This card depicts all the attempted, successful, failed, and dropped calls that are made and received in a network at different time intervals in a day. It is based on the originating timestamp of the CDR. The calls are distributed into six time slots of 4-hour intervals. It also provides the count of the calls and the percentage of failed calls in comparison with the attempted calls for a particular time interval in a day. This chart is currently not filterable. |
|
Headsets by Model |
This card depicts all the attempted, successful, failed, and dropped calls that are made and received in a network based on the Headset Model type. Calls by headset are determined by the CMR received from the endpoint where the headset was connected and part of the call.
|
|
Device Pool |
This card depicts all the attempted, successful, failed, and dropped calls that are made and received in a network based on the device pool name. |
|
Unified CM Version |
This card depicts the distribution of all the attempted, successful, failed, and dropped calls that are made and received in a network based on the Unified CM version. By default, in the pie chart, all the Unified CM versions and the corresponding call volume count is displayed. You can select a Unified CM version on the pie-chart, and the rest of the Call Volume Status cards are updated accordingly based on this filter. You can select or unselect a Unified CM version on the legend by clicking on it, and the chart is updated accordingly. |
|
Call Security Status |
This card depicts the distribution of all the attempted, successful, failed, and dropped calls that are made and received by all endpoints based on call security status. If a call is authenticated or encrypted, then it is classified as Secure. Else it is classified as Non-Secure. By default, the pie chart for the Call Security Status and the corresponding count of calls are displayed. You can select the security profile type on the pie-chart, and the rest of the Call Volume Status cards are updated accordingly based on this filter. You can select or unselect a security profile type on the legend by clicking on it, and the chart is updated accordingly. |
|
CAC Location |
This card depicts the distribution of all the attempted, successful, failed, and dropped calls that are made and received in a network based on the associated Call Admission Control (CAC) location. By default, in the pie chart, all the CAC locations and the corresponding call volume count is displayed. |
|
Physical Location |
This card depicts the distribution of all the attempted, successful, failed, and dropped calls that are made and received in a network based on the associated physical location. By default, in the pie chart, all the Physical Locations and the corresponding call volume count is displayed. If a Unified CM Deployment doesn't have physical location configured for endpoints, then it does not display any data. |
|
Call Failure Analysis |
This card depicts the distribution of the calls according to the Call Termination Cause Codes for failed or dropped calls. By default, in the pie chart, the Call Termination Cause Codes and the corresponding call volume count are displayed.
|
|
Codec |
This card depicts the distribution of all the attempted, successful, failed, and dropped calls that are made and received in a network based on the call codec type. By default, the pie charts for both video and audio codecs and the corresponding call volume count is displayed. You can select a codec on the pie-chart, and the rest of the Call Volume Status cards are updated accordingly based on this filter. |
|
Call Classification |
This card depicts the distribution of all the attempted, successful, failed, and dropped calls that are made and received in a network based on call classification type. If an origin or destination endpoint in a call is a trunk or gateway, it is classified either as On-net or Off-net (depending on the Call Classification settings of the respective trunk or gateway configuration in Unified CM) else it is classified as Internal. By default, the pie chart for the call classification type (On-net, Off-net, and Internal) and the corresponding call volume count is displayed. You can select a Call Classification type on the pie-chart, and the rest of the Call Volume Status cards are updated accordingly based on this filter. You can select or unselect a Call Classification type on the legend by clicking on it, and the chart is updated accordingly. |
|
Calling Number |
This card displays the top five calling numbers in an organization. |
|
Called Number |
This card displays the top five called numbers in an organization. |
-
If the endpoint model Cisco IP Phone 7900 Series makes a call to Cisco IP Phone 8800 Series, then it will be counted against both the models. If both endpoint models are same, it will be counted once.
-
If phone A in San Jose CAC location makes a call to Phone B in New York CAC Location, then call is counted against both the CAC Locations.
-
If both the origin and destination endpoints belong to the same CAC location then it will be counted as one call. The same calculation formula applies to Device Pool, Physical Location and Codec charts.
-
If both the origin and destination endpoints use headset of different models and the respective CMR includes the headset information, then the call will be counted against both the headset model. If both the headset models are same then it will be counted as one.
Filters on the Details Page for Call Volume Status
The filter pane at the top of the details page shows the drop-down list to filter out data and generate charts based on your choice. The available options in the drop-down list are as follows:
-
Mobile and Remote Access
-
User ID
-
URI
-
Phone Number
-
Call Status Distribution
-
Endpoint Media Capability
-
Call Media Type
-
Endpoint Series
-
Unified CM Cluster
-
Headsets by Model
-
Device Pool
-
Unified CM Version
-
Call Security Status
-
CAC Location
-
Physical Location
-
Call Failure Analysis
-
Codec
-
Call Classification
View the Details About Call Audio Quality
View the Details About Call Audio Quality
| 1 |
From the customer view in Control Hub, go to . The Analytics page appears. |
| 2 |
Click the Call Audio Quality card to view the information about call quality. On the page that appears, you can select various filters to visualize charts based on your selection. For more information, see Charts on the Details Page for Call Audio Quality. If you face any issues while viewing the charts, see the Analytics User Interface Issues section in Troubleshoot Webex Cloud-Connected UC. |
Key Performance Indices for Call Audio Quality
The metrics pane at the top of the details page shows the Key Performance Indicators (KPIs). These help you to better understand the utilization of CCUC in your organization.
Calls are graded based on the Severely Concealed Seconds Ratio (SCSR) percentage. For details on how a call is graded, see Unified CM Call Quality Grades. The following table describes the KPIs for Call Audio Quality.
|
Field Title |
Description |
|---|---|
|
Total calls |
The total number of good, acceptable, and poor calls that are made and received on a network. |
|
Good calls |
The number of calls for which the SCSR value falls below the long call or short call SCSR threshold. |
|
Poor calls |
The number of calls for which the SCSR value exceeds the long call and short call SCSR threshold. |
|
Acceptable calls |
The number of calls for which the SCSR value exceeds the long call threshold but falls below the short call SCSR threshold. |
Charts on the Details Page for Call Audio Quality
The following table describes the information that is displayed on the various charts. Graded calls consist of good, acceptable, poor calls.
Calls that are not graded are not included in any of the Call Audio Quality charts.
|
Card Title |
Description |
|---|---|
|
Call Audio Quality (CAQ) Distribution |
This card depicts the distribution of all the graded calls that are made and received on a network. By default, the pie chart for the CAQ grades (good and poor) and the corresponding count of calls are displayed. You can select a CAQ grade on the pie-chart, and the rest of the Call Audio Quality cards are updated accordingly based on this filter. Only those calls that have CMR with SCS metrics are graded. To display only the distribution of good calls, on the legend, click Poor to unselect and the chart is updated accordingly. |
|
CAQ Trend |
This card depicts the trend of all the graded calls in a network. By default, the daily trends and the corresponding count of the graded calls are displayed. You can select or unselect the call grade type on the legend by clicking on it, and the chart is updated accordingly. |
|
Endpoint Media Capability |
This card depicts the distribution of the number of graded calls where audio and video endpoints are involved. By default, in the pie chart, the media capability (audio and video), and the corresponding count of endpoints that are involved with graded calls are displayed. |
|
Call Media Type |
This card depicts distribution of all the graded calls in a network based on the call media (audio/video) type. By default, in the pie chart, the call media types (audio and video), and the corresponding count of graded calls are displayed. You can select a call media type (audio or video) on the pie-chart, and the rest of the Call Audio Quality cards are updated accordingly based on this filter. You can select or unselect audio or video on the legend by clicking on it, and the chart is updated accordingly. |
|
Endpoint Series |
This card depicts the trend of graded calls that are made and received in a network based on the endpoint series. By default, the daily trends of the endpoint series and the corresponding count of the graded calls are displayed. |
|
Unified CM Cluster |
This card depicts distribution of all the graded calls that are made and received in a network based on the Unified CM cluster. By default, in the pie chart, all the Unified CM clusters and the corresponding count of graded calls are displayed. You can select a cluster on the pie-chart, and the rest of the Call Audio Quality cards are updated accordingly based on this filter. You can select or unselect a cluster on the legend by clicking on it, and the chart is updated accordingly. |
|
Distribution by Time |
This card depicts the trend of graded calls that are made and received in a network at different time intervals in a day. It is based on the originating timestamp of the CDR. The calls are distributed into six time slots of 4-hour intervals. The card also provides you the count of the calls that are made and received in a network at a particular time internal in a day. This chart is currently not filterable. |
|
Device Pool |
This card depicts a trend of graded calls that are made and received in a network based on the device pool name. |
|
Unified CM Version |
This card depicts distribution of graded calls that are made and received in a network based on the Unified CM version. By default, in the pie chart the Unified CM versions and the corresponding count of graded calls are displayed. You can select a Unified CM Version on the pie-chart, and the rest of the Call Audio Quality cards are updated accordingly based on this filter.. You can select or unselect a Unified CM Version on the legend by clicking on it, and the chart is updated accordingly. |
|
Call Security Status |
This card depicts distribution of graded calls that are made and received by all the endpoints in a network based on call security status. If a call is authenticated or encrypted, then it is classified as Secure. Else it is classified as Non-Secure. By default, the pie chart for Call Security Status and the corresponding count of graded calls are displayed. You can select a security profile type on the pie-chart, and the rest of the Call Audio Quality cards are updated accordingly based on this filter. You can select or unselect a security profile type on the legend by clicking on it, and the chart is updated accordingly. |
|
CAC Location |
This card depicts distribution of graded calls, made and received in a network based on the associated Call Admission Control (CAC) location. By default, in the pie chart the CAC Location and the corresponding count of the associated graded calls are displayed. |
|
Physical Location |
This card depicts distribution of graded calls, made and received in a network based on the associated physical location. By default, in the pie chart, the physical location, and the corresponding count of graded calls are displayed. If a Unified CM Deployment doesn't have physical location configured for endpoints, then it does not display any data. |
|
Codec |
This card depicts distribution of graded calls, made and received in a network based on the call codec type. By default, in the pie chart both audio and video codec types and the corresponding count of graded calls are displayed. |
|
Call Classification |
This card depicts graded calls, made and received in a network based on call classification type. If an origin or destination endpoint in a call is a trunk or gateway, it is classified either as On-net or Off-net (depending on the Call Classification settings of the respective trunk or gateway configuration in Unified CM) else it is classified as Internal. By default, in the pie chart, the call classification type (On-net, Off-net, and Internal), and the corresponding count of graded calls are displayed. You can select a call classification type (On-net, Off-net, and Internal) on the pie-chart, and the rest of the Call Audio Quality cards are updated accordingly based on this filter. You can select a call classification type (On-net, Off-net, and Internal) on the legend by clicking on it, and the chart is updated accordingly. |
| Calling Number |
This card displays the top five calling numbers in an organization. |
| Called Number |
This card displays the top five called numbers in an organization. |
-
If the endpoint model Cisco IP Phone 7900 Series is used to call a Cisco IP Phone 8800 Series and the call is graded as good, then it counted against both the models. If both endpoint models are same, it is counted once.
-
If phone A in San Jose CAC location is used to call to phone B in New York CAC location, then the graded call is counted against both the CAC locations. If both the origin and destination endpoints belong to the same CAC location, then it counted as one call. The same calculation formula applies to Device Pool, Physical Location, and Codec.
Filters on the Details Page for Call Audio Quality
The filter pane at the top of the details page shows the drop-down list to filter out data and generate charts based on your choice. The available options in the drop-down list are as follows:
-
Mobile and Remote Access
-
User ID
-
URI
-
Phone Number
-
Call Audio Quality (CAQ) Distribution
-
Endpoint Media Capability
-
Call Media Type
-
Endpoint Series
-
Unified CM Cluster
-
Device Pool
-
Unified CM Version
-
Call Security Status
-
CAC Location
-
Physical Location
-
Codec
-
Call Classification
The Unified CM system generates Call Management Records (CMRs) and Call Detail Records (CDRs). Call quality grading can be done only for endpoints that support CMRs. The information in a CDR is used to grade a call as good, acceptable, or poor.
The following terms are used to grade calls:
-
Concealment—Voice, and all other data, travels in packets over IP networks with fixed maximum capacity. This system may be more prone to data loss in the presence of congestion. Concealment is the endpoint created audio that is used to mask the effect of packet loss in a voice packet stream.
-
Severely Concealed Seconds (SCS)—The number of seconds during which a significant amount of concealment (greater than 50 milliseconds) is observed. If the concealment that is observed is greater than 50 milliseconds or approximately 5 percent, then the audio quality may be degraded.
-
Severely Concealed Seconds Ratio (SCSR)—The ratio of SCS to total call duration.
SCSR(%)=(SCS/duration)*100
-
Long call—A call that lasts 20 seconds or longer.
-
Short call—A call that lasts less than 20 seconds.
Calls are graded based on the SCSR percentage. The SCSR percentage for a long call and a short call have different threshold values. The following table provides details about call grades based on the SCSR percentage ranges.
|
Grade |
SCSR Threshold Values | |
|---|---|---|
|
Long Call SCSR Ranges |
Short Call SCSR Ranges | |
|
Good |
Less than 3% |
Less than 20% |
|
Acceptable |
3%-7% |
20%-30% |
|
Poor |
Greater than 7% |
Greater than 30% |
If the SCSR for a call of 10-second duration is 10%, then it's of good quality.
If the SCSR for a call of 120-second duration is 8%, then it's of poor quality.
What to do next
For information about CCUC Analytics, see Analytics for Your Cisco Webex Cloud-Connected UC.
The Asset Usage dashboard displays the charts for the usage of assets (endpoints and headsets) in your organization.
Data Source
The CDRs, CMRs, and device details for this are collected from the Cisco Unified Communications Manager.
Calls that aren't made using an endpoint are neither shown nor included in the asset usage charts. For example, trunk to trunk or conference bridge, and so on. Hence, Asset Usage charts do not show any data for SME type of Unified CM clusters.
View the Details About Call Count Trend
View the Details About Call Count Trend
| 1 |
From the customer view in Control Hub, go to . The Analytics page appears. |
| 2 |
Click the Call Count Trend card to view the charts related to the endpoints from the selected Unified CM cluster. On the page that appears, you can select various filters to visualize charts based on your selection. For more information, see Charts on the Details Page for Call Count Trend. If you face any issues while viewing the charts, see the Analytics User Interface Issues section in Troubleshoot Webex Cloud-Connected UC. |
Key Performance Indices for Call Count Trend
The following table describes the Key Performance Indices (KPIs) for Call Count Trend.
|
Field Title |
Description |
|---|---|
|
Endpoints call count |
Number of times during which has at least one endpoint is involved in a call. |
|
Headsets call count |
Number of times during which has at least one headset is involved in a call. |
|
Total Number of Endpoints in Calls |
Number of times endpoints participate in calls. One endpoint could participate in multiple calls. |
|
Total Number of Headsets in Calls |
Number of times headsets participate in calls. |
Charts on the Details Page for Call Count Trend
The following table describes the information that is shown on each card. Call where one end is an endpoint and other end isn’t an endpoint (for example, Trunk or Gateway or Conference Bridge, and so on) then the attributes like Device Pool, CAC Location, Physical Location, Codecs, Video Resolution aren’t considered from the non-endpoint entities in the Call Count detailed view charts.
|
Card Title |
Description |
|---|---|
|
Calls Distribution by Asset |
This card depicts the distribution of all the calls that are made and received using assets (endpoints and the headsets that are connected to the endpoints) in a network. This chart is currently not filterable. |
|
Call Count Trend |
This card depicts a trend of all the calls that are made and received using assets (endpoints and the headsets that are connected to the endpoints) in a network. This chart is currently not filterable. |
|
Endpoint Media Capability |
This card displays the total number of calls made and received by the assets in a network based on the endpoint media capability (audio or video) type. |
|
Call Media Type |
This card displays the total number of calls made and received by the assets in a network based on the call media (audio or video) type. You can select a call media type on the pie-chart, and the rest of the Call Count cards are updated accordingly based on this filter. You can select or unselect a call media type on the legend by clicking on it, and the chart is updated accordingly. |
|
Endpoint Series |
This card depicts the trend of all the calls that are made and received by the assets in a network based on the endpoint series. |
|
Unified CM Cluster |
This card depicts the distribution of all the calls that are made and received by the assets in a network based on the Unified CM Cluster. By default, the pie chart for the Unified CM cluster and the corresponding call count is displayed. You can select a Unified CM cluster on the pie-chart, and the rest of the Call Count cards are updated accordingly based on this filter. You can select or unselect a Unified CM cluster on the legend by clicking on it, and the chart is updated accordingly. |
|
Distribution by Time |
This card depicts the trend of all the calls that are made and received by the assets in a network at different time intervals in a day. It’s based on the originating timestamp of the CDR. The calls are distributed into six time slots of 4-hour intervals. It also provides the count of the calls for a particular time interval in a day. This chart is currently not filterable. |
|
Headsets by Model |
This card depicts the trend of all the calls that are made and received by the assets in a network based on the Headset Model type. Calls by headset are determined by the CMR received from the endpoint where the headset was connected and part of the call. It also provides the daily count of the calls based on the HS Model type.
|
|
Device Pool |
This card depicts the trend of all the calls that are made and received by the assets in a network based on the device pool. |
|
Unified CM Version |
This card depicts the of all the calls that are made and received by the assets in a network based on the Unfied CM version. By default, the pie chart for the Unified CM Version and the corresponding call count is displayed. You can select a Unified CM Version on the pie-chart, and the rest of the Call Count cards are updated accordingly based on this filter. You can select or unselect Unified CM Version type on the legend by clicking on it, and the chart is updated accordingly. |
|
Call Security Status |
This card depicts the distribution of all the calls that are made and received by all the endpoints in a network categorized based on the security profile. By default, the pie chart for the security profile (secure and non-secure) and the corresponding call count is displayed. You can select a security profile on the pie-chart, and the rest of the Call Count cards are updated accordingly based on this filter. You can select or unselect a security profile type on the legend by clicking on it, and the chart is updated accordingly. |
|
Video Resolution |
This card depicts the distribution of all the video calls made by all the assets categorized based on the video resolution type. By default, the pie chart for the Video resolution type and the corresponding call count is displayed. You can select a video resolution type on the pie-chart, and the rest of the Call Count cards are updated accordingly based on this filter. You can select or unselect a video resolution type on the legend by clicking on it, and the chart is updated accordingly. |
|
Video Content Type |
This card depicts the distribution of all the video calls made by all the assets categorized based on the video content type. By default, the pie chart for the video content type and the corresponding call count is displayed. You can select a video content type on the pie-chart, and the rest of the Call Count cards are updated accordingly based on this filter. You can select or unselect a video content type on the legend by clicking on it, and the chart is updated accordingly. |
|
Codec |
This card depicts the distribution of all the calls made and received by all the assets categorized based the call codec type. By default, the pie chart for the call codec type and the corresponding call count is displayed. You can select a Call Codec type on the pie-chart, and the rest of the Call Count cards are updated accordingly based on this filter. You can select or unselect a codec type on the legend by clicking on it, and the chart is updated accordingly. |
|
CAC Location |
This card depicts the distribution of all the calls that are made and received by all the assets categorized based on the Call Admission Control (CAC) location. By default, the pie chart for the Call Admission Control (CAC) location and the corresponding call count is displayed. You can select a Call Admission Control (CAC) location on the pie-chart, and the rest of the Call Count cards are updated accordingly based on this filter. You can select or unselect a CAC location on the legend by clicking on it, and the chart is updated accordingly. |
|
Physical Location |
This card depicts the distribution of all the calls that are made and received by all the assets categorized based on the associated physical location. By default, the pie chart for all the physical location and the corresponding call count is displayed. You can select a Physical Location on the pie-chart, and the rest of the Call Count cards are updated accordingly based on this filter. If the Unified CM deployment doesn't have any physical location that is configured for the endpoints, then the chart does not display any data. If a Unified CM Deployment doesn't have physical locations configured for the endpoints, then this chart does not display any data. |
|
Call Classification |
This card depicts the distribution of all the calls that are made and received using assets (endpoints and the headsets that are connected to the endpoints) categorized based on the call classification type (On-net and Off-net). If an origin or destination endpoint in a call is a trunk or gateway, it’s classified either as On-net or Off-net (depending on the Call Classification settings of the respective trunk or gateway configuration in Unified CM) else it’s classified as Internal. By default, the pie chart for the call classification type (On-net, Off-net, and Internal) and the corresponding call count is displayed. You can select a Call Classification type on the pie-chart, and the rest of the Call Count cards are updated accordingly based on this filter. You can also select or unselect a Call Classification type on the legend by clicking on it, and the chart is updated accordingly. |
|
Calling Number |
This card displays the top five calling numbers in an organization. |
|
Called Number |
This card displays the top five called numbers in an organization. |
-
If endpoint model Cisco IP Phone 7900 Series makes a call to Cisco IP Phone 8800 Series, then the call is counted against both the endpoint models. If both endpoint models are same, then also, the call is counted twice as it’s about the usage of the asset.
-
If phone A in San Jose CAC location makes a call to Phone B in New York CAC Location, then the call is counted against both the CAC Locations. If both the origin and destination endpoints belong to the same CAC location, then it’s counted as one call.
-
The same calculation formula applies to Device Pool, Physical Location and Codec charts. If both origin and destination endpoints use headset of different models and the respective CMR includes the headset information, then the call is counted against both the headset model.
-
If both the headset models are same, then also the call is counted against both of the headset models as it’s primarily the usage of the asset.
View the Details About Call Duration
View the Details About Call Duration
| 1 |
From the customer view in Control Hub, go to . The Analytics page appears. |
| 2 |
Click the Call Duration card to view the charts that provide information about duration of calls where endpoints and headsets have been involved. On the page that appears, you can select various filters to visualize charts based on your selection. For more information, see Charts on the Details Page for Call Duration Trend. If you face any issues while viewing the charts, see the Analytics User Interface Issues section in Troubleshoot Webex Cloud-Connected UC. |
Key Performance Indices for Call Duration Trend
The following table describes the Key Performance Indices (KPIs) for Call Duration Trend.
|
Field Title |
Description |
|---|---|
|
Total call minutes |
Total duration of all the calls (minutes) that are made using the assets. |
|
Audio call minutes |
Total duration of all the audio calls (minutes) that are made using the assets. |
|
Video call minutes |
Total duration of all the video calls (minutes) that are made using the assets. |
Charts on the Details Page for Call Duration Trend
The following table describes the information that is shown on each card. For calls where one end is an endpoint and other end is not an endpoint (for example, Trunk or Gateway or Conference Bridge, and so on) then the attributes like Device Pool, CAC Location, Physical Location, Codecs, Video Resolution are not considered from the non-endpoint entities in the Call Duration detailed view charts
|
Card Title |
Description |
|---|---|
|
Distribution by Asset |
This card depicts a trend of the duration in call minutes for calls that are made and received using assets (endpoints and the headsets that are connected to the endpoints) in a network. |
|
Call Duration Trend |
This card depicts a trend of all the total duration (minutes) of all the calls that are made using assets (endpoints and the headsets that are connected to the endpoints) in a network. It also provides the total duration of the calls for a particular day. This chart is currently not filterable. |
|
Endpoint Media Capability |
This card depicts the distribution of the call minutes that are made or received using audio and video endpoints.. By default, the pie chart for the count of the audio and video endpoints and the corresponding call duration is displayed. You can select a media capability type on the pie-chart, and the rest of the Call Duration cards are updated accordingly based on this filter. You can select or unselect a media capability type on the legend by clicking on it, and the chart is updated accordingly. |
|
Call Media Type |
This card depicts the distribution of the total duration of all the calls (minutes) made by the assets categorized based on the call media (audio/video) type. By default, the pie chart for the call media type (audio/video) and the corresponding call duration is displayed. You can select a call media type on the pie-chart, and the rest of the Call Duration cards are updated accordingly based on this filter. You can select or unselect a call media type on the legend by clicking on it, and the chart is updated accordingly. |
|
Endpoint Series |
This card depicts the trend of the total duration of all the calls (minutes) made by the assets categorized based on the endpoint series. It also provides a count of the total duration of the calls for a particular endpoint series. |
|
Unified CM Cluster |
This card depicts the distribution of the total duration of all the calls (minutes) made by the assets categorized based on the Unified CM cluster. By default, the pie chart for the Unified CM cluster and the corresponding call duration is displayed. You can select a Unified CM cluster on the pie-chart, and the rest of the Call Duration cards are updated accordingly based on this filter. You can select or unselect a Unified CM cluster on the legend by clicking on it, and the chart is updated accordingly. |
|
Distribution by Time |
This card depicts the trend of the total duration (minutes) of all the calls that are made by the assets at different time intervals in a day. It is based on the originating timestamp of the CDR. The calls are distributed into six time slots of 4-hour intervals. It also provides the average count of the call duration for a particular time interval in a day. This chart is currently not filterable. |
|
Call Classification |
This card depicts the distribution of the total duration (minutes) of all the calls that are made by the assets categorized based on call classification type. If an origin or destination endpoint in a call is a trunk or gateway, it is classified either as On-net or Off-net (depending on the Call Classification settings of the respective trunk or gateway configuration in Unified CM) else it is classified as Internal. By default, the pie chart for the call classification type (On-net, Off-net, and Internal) and the corresponding call duration is displayed. You can select a Call Classification type on the pie-chart, and the rest of the Call Duration cards are updated accordingly based on this filter. You can also select or unselect a Call Classification type on the legend by clicking on it, and the chart is updated accordingly. |
|
Headsets by Model |
This card depicts the trend total duration (minutes) of all the calls that are made by the assets in a network categorized based on the headset model type. Calls by headset are determined by the CMR received from the endpoint where the headset was connected and part of the call. It also provides the daily count of the call duration based on the headset model type.
|
|
Device Pool |
This card depicts of the total duration (minutes) of all the calls that are made by the assets in a network categorized based on the device pool name. It also provides a count of the total duration of the calls for a particular device pool. |
|
Unified CM version |
This card depicts the distribution of the total duration (minutes) of all the calls that are made by the assets categorized based on the Unified CM version. By default, the pie chart for the Unified CM Version and the corresponding call duration is displayed. You can select a Unified CM Version on the pie-chart, and the rest of the Call Duration cards are updated accordingly based on this filter. You can select or unselect a Unified CM Version type on the legend by clicking on it, and the chart is updated accordingly. |
|
Call Security Status |
This card depicts the distribution of the total duration (minutes) of all the calls that are made by the endpoints categorized based on the security profile. By default, the pie chart for the security profile (secure and non-secure) and the corresponding call duration is displayed. You can select a security profile on the pie-chart, and the rest of the Call Duration cards are updated accordingly based on this filter. You can select or unselect a security profile type on the legend by clicking on it, and the chart is updated accordingly. |
|
Video Resolution |
This card depicts the distribution of the total duration (minutes) of all the calls that are made by the assets categorized based on the video resolution type. By default, the pie chart for the Video resolution type and the corresponding call duration is displayed. You can select a video resolution type on the pie-chart, and the rest of the Call Duration cards are updated accordingly based on this filter. You can select or unselect a Video Resolution on the legend by clicking on it, and the chart is updated accordingly. |
|
Video Content Type |
This card depicts the distribution of the total duration (minutes) of all the calls that are made by the assets categorized based on the video content type. By default, the pie chart for the Video content type and the corresponding call duration is displayed. You can select a video content type on the pie-chart, and the rest of the Call Duration cards are updated accordingly based on this filter. You can select or unselect a Video Content type on the legend by clicking on it, and the chart is updated accordingly. |
|
Codec |
This card depicts the distribution of the total duration (minutes) of all the calls that are made by the assets categorized based on the call codec type. By default, the pie chart for the call codec type and the corresponding call duration is displayed. You can select a Call Codec type on the pie-chart, and the rest of the Call Duration cards are updated accordingly based on this filter. You can select or unselect a codec type on the legend by clicking on it, and the chart is updated accordingly. |
|
CAC Location |
This card depicts the distribution of the total duration (minutes) of all the calls that are made by the assets categorized based on the associated Call Admission Control (CAC) location. By default, the pie chart for the Call Admission Control (CAC) location and the corresponding call duration is displayed. You can select a Call Admission Control (CAC) location on the pie-chart, and the rest of the Call Duration cards are updated accordingly based on this filter. |
|
Physical Location |
This card depicts distribution of the total duration of all the calls (minutes) made by the assets in use categorized based on the endpoint Physical Location. By default, the pie chart of all the Physical Locations and the corresponding total call duration is displayed. You can select a Physical Location type on the pie-chart, and the rest of the Call Duration cards are updated accordingly based on this filter. If the Unified CM deployment doesn't have any physical location that is configured for the endpoints, then the chart does not display any data. If a Unified CM Deployment doesn't have physical locations configured for the endpoints, then this chart does not display any data. |
|
Calling Number |
This card displays the top five calling numbers in an organization, calculated based on the duration of the calls. |
|
Called Number |
This card displays the top five called numbers in an organization, calculated based on the duration of the calls. |
-
If endpoint model Cisco IP Phone 7900 Serie makes a call to Cisco IP Phone 8800 Series then call duration will be counted against both the endpoint models. If both endpoint models are same then the call duration will be considered for both the endpoint models as it is primarily the usage of the assets.
-
If phone A in San Jose CAC location makes a call to Phone B in New York CAC Location then call duration is considered against both the CAC Locations. If both the origin and destination endpoints belong to the same CAC location, then the duration is considered once agains the CAC Location.
-
The same calculation formula applies to Device Pool, Physical Location and Codec charts. If both origin and destination endpoints use headset of different models and the respective CMR includes the headset information, then the call is counted against both the headset model.
-
If both the headset models are same, then also it will be counted against both of the headset models as it is primarily the usage of the asset.
Filters on the Details Page for Call Duration Trend
The filter pane at the top of the details page shows the drop-down list to filter out data and generate charts based on your choice. The available options in the drop-down list are as follows:
-
Mobile and Remote Access
-
User ID
-
URI
-
Phone Number
-
Endpoint Media Capability
-
Call Media Type
-
Endpoint Series
-
Unified CM Cluster
-
Call Classification
-
Headsets by Model
-
Device Pool
-
Unified CM Version
-
CAC Location
-
Physical Location
View the Details About Endpoint Adoption
View the Details About Endpoint Adoption
| 1 |
From the customer view in Control Hub, go to . The Analytics page appears. |
| 2 |
Click the Endpoint Adoption card to view the charts related to the endpoints in the selected Unified CM cluster. On the page that appears, you can select various filters to visualize charts based on your selection. For more information, see Charts on the Details Page for Endpoint Adoption.
|
Key Performance Indices for Endpoint Adoption
For a given duration, the list of all endpoints and the corresponding calls made or received by each endpoint are taken as the input and run through a percentile analytical function. Based on the value returned by this function, the endpoints are classified as described by the Key Performance Indices (KPIs) for Endpoint Adoption in the following table.
|
Field Title |
Description |
|---|---|
|
Configured Endpoints |
Number of endpoints that have been configured for the selected duration. |
|
Unregistered Endpoints |
Number of endpoints that haven’t been registered at least once for the selected duration. |
|
Registered (0% calls) |
Number of endpoints that have been registered for the selected duration, but weren’t used to make any calls. |
|
Registered (25% calls) |
Number of endpoints that have been registered for the selected duration, and were involved in less than or equal to 25 percentile of the calls. |
|
Registered (50% calls) |
Number of endpoints that have been registered for the selected duration, and were involved in 25–50 percentile of the calls. |
|
Registered (75% calls) |
Number of endpoints that have been registered for the selected duration, and were involved in 50–75 percentile of the calls. |
|
Registered (100% calls) |
Number of endpoints that have been registered for the selected duration, and were involved in 75–100 percentile of the calls. |
Percentile Calculation for Endpoint Adoption
For all calls that involve endpoints, 0th, 25th, 50th, 75th and 100th percentile values are calculated. After this value is available, each endpoint is marked by any one of these percentile values. This depends on the number of calls during which the endpoint is involved for the selected duration. After all the endpoints are tagged to the corresponding percentile values, the number of endpoints belonging to each group of percentile value is summed up and shown as counts in the KPI.
The percentile calculation is described in the following table.
|
Calls Made by Endpoints |
Capture Call Duration |
Percentile Calculation for Endpoint Calls |
Examples of Percentile Values |
|---|---|---|---|
|
Endpoint A = 20 calls |
Calls connected with Endpoints assigns a value. | > 0 to 25 percentile calls > 25 to 50 percentile calls > 25 to 50 percentile calls > 50 to 75 percentile calls > 75 to 100 percentile calls |
Endpoint A = 75 percentile |
|
Endpoint B = 2 calls |
Endpoint B = 25 percentile | ||
|
Endpoint C = 7 calls |
Endpoint C = 50 percentile | ||
|
Endpoint D = 1 call |
Endpoint D = 0 percentile | ||
|
Endpoint E = 34 calls |
Endpoint E = 100 percentile |
Charts on the Details Page for Endpoint Adoption
The following table describes the information that is shown on each card. For calls where one end is an endpoint and other end isn’t an endpoint (for example, Trunk or Gateway or Conference Bridge, and so on), the attributes like Device Pool, CAC Location, Physical Location, Codecs, Video Resolution aren’t considered from the non-endpoint entities in the Endpoint Adoption detailed view charts.
By default, all the charts display analytics data for configured endpoints for the selected duration. Choose the appropriate filters to view data for unregistered endpoints and for the registered endpoints (categorized on percentile call involvement).
|
Card Title |
Description |
|---|---|
|
Endpoint Adoption |
This card displays a distribution of the configured endpoints, endpoints that aren’t registered, and the various amounts of call usage of registered endpoints for the selected duration in an organization. |
|
Call Media Type |
This card displays a distribution of the registered endpoints based on the call media type (audio and video). You can select or unselect a Call Media Type on the legend by clicking on it, and the chart is updated accordingly. |
|
Unified CM Cluster |
This card displays a distribution of the configured endpoints based on the Unified CM cluster. You can select or unselect a Unified CM cluster on the legend by clicking on it, and the chart is updated accordingly. |
|
Call Classification |
This card displays of the registered endpoints based on the call classification type (on-net, off-net, and internal). If an origin or destination endpoint in a call is a trunk or gateway, it’s classified either as On-net or Off-net (depending on the Call Classification settings of the respective trunk or gateway configuration in Unified CM) else it’s classified as Internal. You can select or unselect a Call Classification type on the legend by clicking on it, and the chart is updated accordingly. |
|
Device Pool |
This card displays a distribution of the configured endpoints based on the device pool name. You can select or unselect a Device Pool on the legend by clicking on it, and the chart is updated accordingly. |
|
CAC Location |
This card displays a distribution of the configured endpoints based on the associated Call Admission Control (CAC) location. You can select or unselect a CAC Location on the legend by clicking on it, and the chart is updated accordingly. |
|
Physical Location |
This card displays a distribution of the configured endpoints based on the associated Physical Location. If a Unified CM Deployment doesn't have physical locations configured for the endpoints, then this chart doesn’t display any data. You can select or unselect a Physical Location on the legend by clicking on it, and the chart is updated accordingly. |
|
Endpoint Media Capability |
This card displays a distribution of the configured endpoints based on the endpoint media capability (hard audio, hard video, and soft video) type. Based on the media capability, endpoints are categorized as follows:
You can select or unselect an Endpoint Media Capability on the legend by clicking on it, and the chart is updated accordingly. |
|
Endpoint Series |
This card depicts a trend of the configured endpoints, endpoints based on the endpoint series. |
Filters on the Details Page for Endpoint Adoption
The filter pane at the top of the details page shows the drop-down list to filter out data and generate charts based on your choice. The available options in the drop-down list are as follows:
-
Mobile and Remote Access
-
Phone Number
-
URI
-
User ID
-
Endpoint Adoption
-
Call Media Type
-
Unified CM Cluster
-
Call Classification
-
Device Pool
-
CAC Location
-
Physical Location
-
Endpoint Media Capability
-
Endpoint Series
View the Details About Headset Adoption
View the Details About Headset Adoption
| 1 |
From the customer view in Control Hub, go to . The Analytics page appears. |
| 2 |
Click the Headset Adoption card to view the charts related to the headsets configured for the endpoints in the selected Unified CM cluster. On the page that appears, you can select various filters to visualize charts based on your selection. For more information, see Charts on the Details Page for Headset Adoption.
|
Key Performance Indices for Headset Adoption
For a given duration, the list of all headsets and the corresponding calls involving connected headsets are taken as input and run through a percentile analytical function. Based on the value returned by this function, the headsets are classified as described by the Key Performance Indices (KPIs) for Headset Adoption in the following table.
|
Field Title |
Description |
|---|---|
|
Configured Headsets |
Number of headsets that have been configured for the selected duration. |
|
Disconnected Headsets |
Number of headsets that haven’t been connected to endpoints involved in calls during the selected duration. |
|
Connected (0% calls) |
Number of headsets that have been connected to endpoints not involved in any calls during the selected duration. |
|
Connected (25% calls) |
Number of headsets that have been connected to endpoints involved in less than or equal to 25 percentile of the calls during the selected duration. |
|
Connected (50% calls) |
Number of headsets that have been connected to endpoints involved in 25–50 percentile of the calls during the selected duration. |
|
Connected (75% calls) |
Number of headsets that have been connected to endpoints involved in 50–75 percentile of the calls during the selected duration. |
|
Connected (100% calls) |
Number of headsets that have been connected to endpoints involved in 75–100 percentile of the calls during the selected duration. |
Percentile Calculation for Headset Adoption
For all calls that involve headsets, 0th, 25th, 50th, 75th and 100th percentile values are calculated. After this value is available, each headset is marked by any one of these percentile values. This depends on the number of calls during which the headset is involved for the selected duration. After all the headsets are tagged to the corresponding percentile values, the number of headsets belonging to each group of percentile value is summed up and shown as counts in the KPI.
The percentile calculation described in the following table.
|
Calls with Headsets Connected |
Capture Call Duration |
Percentile Calculation for Calls with Headsets Connected |
Examples of Percentile Values |
|---|---|---|---|
|
Headset A = 20 calls |
Calls connected with headsets assigns a value. |
> 0 to 25 percentile calls > 25 to 50 percentile calls > 25 to 50 percentile calls > 50 to 75 percentile calls > 75 to 100 percentile calls |
Headset A = 75 percentile |
|
Headset B = 2 calls |
Headset B = 25 percentile | ||
|
Headset C = 7 calls |
Headset C = 50 percentile | ||
|
Headset D = 1 call |
Headset D = 0 percentile | ||
|
Headset E = 34 calls |
Headset E = 100 percentile |
Charts on the Details Page for Headset Adoption
The following table describes the information that is shown on each card. For calls where one end is an endpoint and other end isn’t an endpoint (for example, Trunk or Gateway or Conference Bridge, and so on), the attributes like Device Pool, CAC Location, Physical Location, Codecs, Video Resolution aren’t considered from the non-endpoint entities in the Headset Adoption detailed view charts.
By default, all the charts display analytics data for configured headsets for the selected duration. Choose the appropriate filters to view data for not connected headsets and for the connected headsets (categorized on percentile call involvement).
|
Card Title |
Description |
|---|---|
|
Unified CM Cluster |
This card displays a distribution of the configured headsets based on the Unified CM cluster. You can select or unselect a Unified CM cluster on the legend by clicking on it, and the chart is updated accordingly. |
|
Physical Location |
This card displays a distribution of the configured headsets based on the associated Physical Location. If a Unified CM Deployment doesn't have physical locations configured for the endpoints, then this chart doesn’t display any data. You can select or unselect a Physical Location on the legend by clicking on it, and the chart is updated accordingly. |
|
Headset Adoption |
This card displays a distribution of the configured headsets, not connected headsets, and the various amounts of usage of connected headsets for the selected duration in an organization. |
|
Call Media Type |
This card displays a distribution of the headsets connected to registered endpoints based on the call media type (audio and video). You can select or unselect a call media type on the legend by clicking on it, and the chart is updated accordingly. |
|
CAC Location |
This card displays a distribution of the configured headsets based on the associated Call Admission Control (CAC) location. You can select or unselect a CAC Location on the legend by clicking on it, and the chart is updated accordingly. |
|
Call Classification |
This card displays a distribution of the headsets connected to registered endpoints based on the call classification type (on-net, off-net, and internal). If an origin or destination endpoint in a call is a trunk or gateway, it’s classified either as On-net or Off-net (depending on the Call Classification settings of the respective trunk or gateway configuration in Unified CM) else it’s classified as Internal. You can select or unselect a Call Classification type on the legend by clicking on it, and the chart is updated accordingly. |
|
Device Pool |
This card displays a distribution of the configured headsets based on the device pool name. You can select or unselect a Device Pool on the legend by clicking on it, and the chart is updated accordingly. |
|
Endpoint Media Capability |
This card displays a distribution of the configured headsets (hard audio, hard video, and soft video) type. You can select or unselect an Endpoint Media Capability on the legend by clicking on it, and the chart is updated accordingly. |
|
Endpoint Series |
This card displays a distribution of the configured headsets, not connected headsets, and the various amounts of usage of connected headsets based on the endpoint series. |
|
Headset Model Series |
This card displays a distribution of the configured headsets, not connected headsets, and the various amounts of usage of connected headsets for the selected duration in an organization based on the headset model. |
Filters on the Details Page for Headset Adoption
The filter pane at the top of the details page shows the drop-down list to filter out data and generate charts based on your choice. The available options in the drop-down list are as follows:
-
Mobile and Remote Access
-
User ID
-
URI
-
Phone Number
-
Unified CM Cluster
-
Physical Location
-
Headset Adoption
-
Call Media Type
-
CAC Location
-
Call Classification
-
Device Pool
-
Endpoint Media Capability
-
Endpoint Series
-
Headset Model Series
The Traffic Analysis dashboard displays the charts that are related to Call Traffic Locations, and Call Traffic Analysis.
The Call Traffic Locations charts display the distribution of calls that are handled by assets and are categorized based on Call Admission Control (CAC) location.
The Call Traffic Analysis charts display the distribution of calls that are handled by assets and are categorized based on different call types.
View the Details About Call Traffic Locations
View the Details About Call Traffic Locations
| 1 |
From the customer view in Control Hub, go to . The Analytics appears. |
| 2 |
Click the Call Traffic Locations card to view the distribution of calls that are handled by assets, categorized based on CAC location. On the page that appears, you can select various filters to visualize charts based on your selection. For more information, see Filters on the Details Page for Call Traffic Locations. If you face any issues while viewing the charts, see the Analytics User Interface Issues section in Troubleshoot Webex Cloud-Connected UC. |
Key Performance Indices for Call Traffic Locations
The following table describes the Key Performance Indices (KPIs) for Call Traffic Locations.
|
Field Title |
Description |
|---|---|
|
Total Classified Call Count |
Total number of calls from all the locations and category. |
|
On-net Call Count |
Total number of On-net calls. On-net calls are non-PSTN calls. |
|
Off-net Call Count |
Total number of Off-net calls. Off-net calls are PSTN calls. |
|
Internal Call Count |
Total number of calls made within the organization. Internal calls are intra-company calls. |
Charts on the Details Page for Call Traffic Locations
The following table describes the information that is displayed on the various charts.
|
Card Title |
Description |
|---|---|
|
Call Traffic Locations |
This card displays a trend of calls for the top five locations. Also known as CAC Locations. They're configured within a Call Manager aimed at limiting the number of simultaneous calls to or from a remote site. |
|
Call Traffic Locations Distribution |
This card displays the distribution of calls for the top five locations. Also known as CAC Locations Distribution. They're configured within a Call Manager aimed at limiting the number of simultaneous calls to or from a remote site. |
|
Call Classification |
This card depicts the distribution of all the attempted, successful, failed, and dropped calls that are made and received in a network based on call classification type. If an origin or destination endpoint in a call is a trunk or gateway, it is classified either as On-net or Off-net (depending on the Call Classification settings of the respective trunk or gateway configuration in Unified CM) else it is classified as Internal. By default, the pie chart for the call classification type (On-net, Off-net, and Internal) and the corresponding call volume count is displayed. You can select a Call Classification type on the pie-chart, and the rest of the Call Traffic Locations cards are updated accordingly based on this filter. You can select or unselect a Call Classification type on the legend by clicking on it, and the chart is updated accordingly. |
|
Call Media Type |
This card depicts the distribution of all the attempted, successful, failed, and dropped in a network based on the call media (audio or video) type. By default, in the pie chart, the call media type and the corresponding call volume count are displayed. You can select a call media type (audio or video) on the pie-chart, and the rest of the Call Traffic Locations cards are updated accordingly based on this filter. |
|
Call Direction |
This card depicts a distribution of all incoming and outgoing calls for all Successful, Dropped, and Failed calls. |
|
Call Distribution By Time |
This card depicts a trend of all Successful, Dropped, and Failed calls made at different time intervals in a day. |
|
Calling Number |
This card displays the top five calling numbers in an organization. |
|
Called Number |
This card displays the top five called numbers in an organization. |
Filters on the Details Page for Call Traffic Locations
The filter pane at the top of the details page shows the drop-down list to filter out data and generate charts based on your choice. The available options in the drop-down list are as follows:
-
Mobile and Remote Access
-
User ID
-
URI
-
Phone Number
-
Call Traffic Location Distribution
-
Call Classification
-
Call Media Type
-
Call Direction
View the Details About Call Traffic Analysis
View the Details About Call Traffic Analysis
| 1 |
From the customer view in Control Hub, go to . The Analytics page appears. |
| 2 |
Click the Call Traffic Analysis card to view the information about call distribution analysis based on call types. The supported call types are P2P, ICT, SIP Trunk, Conference, MGCP, Voice Mail, Hunt Group, Webex Meeting, and Hybrid Calls.
On the page that appears, you can select various filters to visualize charts based on your selection. For more information, see Filters on the Details Page for Call Traffic Analysis. |
Key Performance Indices for Call Traffic Analysis
The following table describes the Key Performance Indices (KPIs) for Call Traffic Analysis.
|
Field Title |
Description |
|---|---|
|
Total Call Count |
Total number of calls. |
|
On-net Call Count |
Total number of On-net calls. On-net calls are non-PSTN calls. |
|
Off-net Call Count |
Total number of Off-net calls. Off-net calls are PSTN calls. |
|
Internal Call Count |
Total number of calls made within the organization. Internal calls are intracompany calls. |
Charts on the Details Page for Call Traffic Analysis
The following table describes the information that is displayed on the various charts.
|
Card Title |
Description |
|---|---|
|
Call Traffic Analysis |
This card depicts the distribution of calls based on the volume of the traffic that is received for the top five call types. |
|
Call Traffic Analysis Distribution |
This card depicts the call trend based on the volume of the traffic that is received for the top five call types. |
|
Call Classification |
This card depicts the distribution of all the attempted, successful, failed, and dropped calls that are made and received in a network based on call classification type. If an origin or destination endpoint in a call is a trunk or gateway, it is classified either as On-net or Off-net (depending on the Call Classification settings of the respective trunk or gateway configuration in Unified CM) else it is classified as Internal. By default, the pie chart for the call classification type (On-net, Off-net, and Internal) and the corresponding call volume count is displayed. You can select a Call Classification type on the pie-chart, and the rest of the Call Traffic Analysis cards are updated accordingly based on this filter. You can select or unselect a Call Classification type on the legend by clicking on it, and the chart is updated accordingly. |
|
Call Media Type |
This card depicts the distribution of all the attempted, successful, failed, and dropped in a network based on the call media (audio or video) type. By default, in the pie chart, the call media type and the corresponding call volume count are displayed. You can select a call media type (audio or video) on the pie-chart, and the rest of the Call Traffic Analysis cards are updated accordingly based on this filter. |
|
Call Security Status |
This card depicts the distribution of calls for all the call types, based on the security profile, made and received by all the endpoints in a network. |
|
Call Distribution By Time |
This card depicts a trend of all all Successful, Dropped, and Failed calls made at different time intervals in a day. |
|
Call Status |
This card depicts the distribution of all successful, dropped, and failed calls. |
|
OTT Calls |
This card depicts the distribution of all successful, dropped, and failed OTT calls. These calls are also referred to as Mobile and Remote Access Calls. |
|
Device Pool |
This card depicts all the attempted, successful, failed, and dropped calls that are made and received in a network based on the device pool name. |
|
CAC Location |
This card depicts distribution of graded calls, made and received in a network based on the associated Call Admission Control (CAC) location. By default, in the pie chart the CAC Location and the corresponding count of the associated graded calls are displayed. |
|
Unified CM Cluster |
You can select or unselect a cluster on the legend by clicking on it, and the chart is updated accordingly. This card depicts the distribution of all the attempted, successful, failed, and dropped calls that are made and received in a network based on Unified CM cluster. By default, in the pie chart, all the clusters and the corresponding call volume count is displayed. You can select a cluster on the pie-chart, and the rest of the Call Volume Status cards are updated accordingly based on this filter. |
|
Call Audio Quality (CAQ) Distribution |
This card depicts the distribution of all the graded calls that are made and received on a network. By default, the pie chart for the CAQ grades (good and poor) and the corresponding count of calls are displayed. You can select a CAQ grade on the pie-chart, and the rest of the Call Traffic Analysis cards are updated accordingly based on this filter. Only those calls that have CMR with SCS metrics are graded. To display only the distribution of good calls, on the legend, click Poor to unselect and the chart is updated accordingly. |
|
Calling Number |
This card displays the top five calling numbers in an organization. |
|
Called Number |
This card displays the top five called numbers in an organization. |
Filters on the Details Page for Call Traffic Analysis
The filter pane at the top of the details page shows the drop-down list to filter out data and generate charts based on your choice. The available options in the drop-down list are as follows:
-
Mobile and Remote Access
-
User ID
-
URI
-
Phone Number
-
Call Traffic Analysis Distribution
-
Call Classification
-
Call Media Type
-
Call Security Status
-
Call Status
-
OTT calls
-
Device Pool
-
CAC Location
-
Unified CM Cluster
-
Call Audio Quality (CAQ) Distribution
The Capacity Analysis dashboard displays the analytics charts related to Trunk Usage.
The Trunk Usage analytics chart displays information about Trunk Usage for the top five trunks from all the Trunk types that are configured within Unified CM.
View the Details About Trunk Usage
View the Details About Trunk Usage
| 1 |
From the customer view in Control Hub, go to . The Analytics appears. | ||||||||||||||||||||
| 2 |
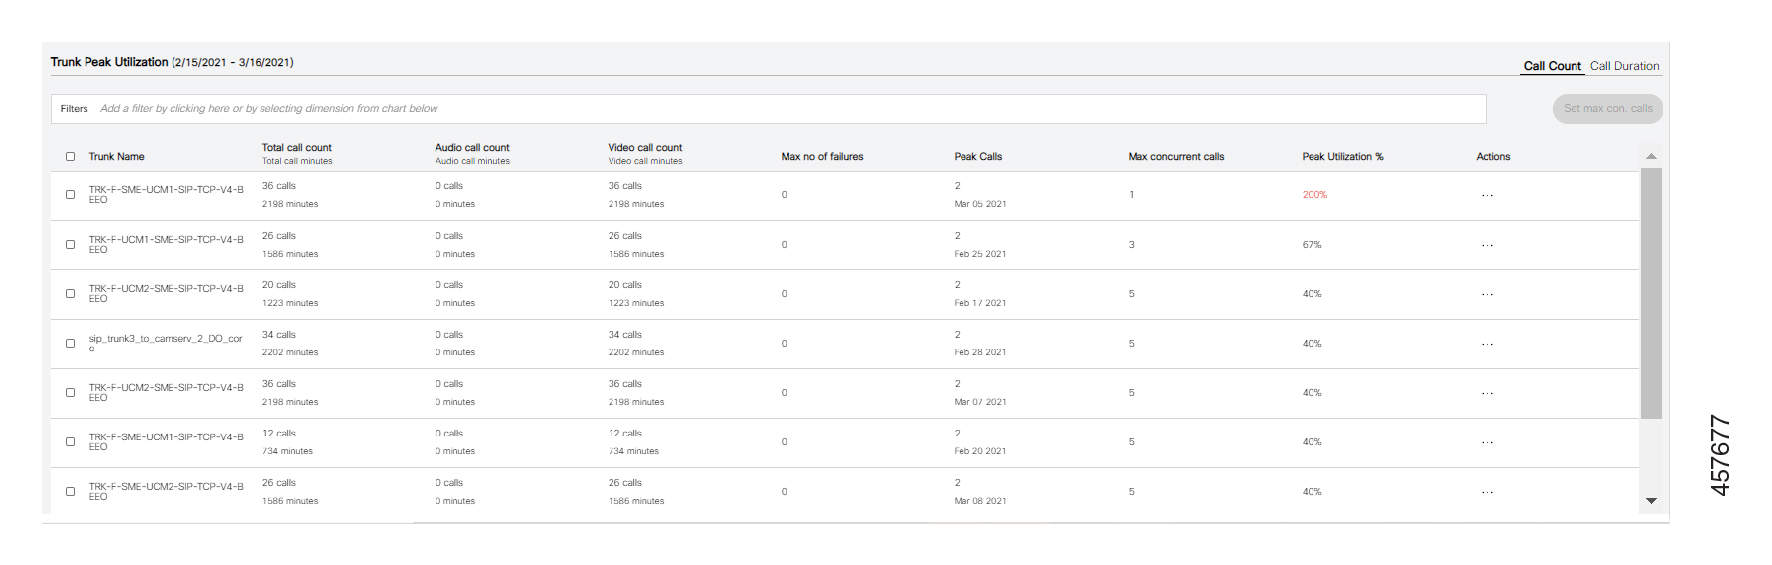
Click the Trunk Usage card to view the information about Trunk Usage for all the Trunk types configured within a Call Manager. On the page that appears, you can select various filters to visualize charts based on your selection. For more information, see Filters on the Details Page of Capacity Analysis Trunk Types. . The Trunk Usage also displays the Trunk Peak Utilization table as per the Call Count and Call Duration. You can select a trunk and click Set max con. calls to set maximum concurrent calls.
You can set max concurrent calls for a particular trunk and multiple trunks. To set max concurrent calls for a particular trunk, click ... that represent the option menu in the Actions allowed for that trunk. To set max concurrent calls for multiple trunks, select the trunks and click Set max con. calls to set the value for all the selected trunks. The following are a few of the use cases for setting max concurrent calls for trunks:
The Trunk Peak Utilization table displays the following details:
If you face any issues while viewing the charts, see the Analytics User Interface Issues section in Troubleshoot Webex Cloud-Connected UC. |
Key Performance Indices for Capacity Analysis Trunk Types
The following table describes the Key Performance Indices (KPIs) for Capacity Analysis.
|
Field Title |
Description |
|---|---|
|
Total Call Count |
Total number of calls. |
|
SIP |
Total number of calls from SIP trunk. |
|
MGCP |
Total number of calls from MGCP trunk. |
|
ICT |
Total number of calls from ICT trunk. |
Charts on the Details Page of Capacity Analysis Trunk Types
The following table describes the information that is displayed on the various charts.
|
Card Title |
Description |
|---|---|
|
Trunk Usage Distribution |
This card displays the trunk usage distribution for the top five trunks that are configured within a CallManager. |
|
Trunk Usage Trend |
This card displays the trunk usage trend for the top five trunks that are configured within a CallManager. |
|
Trunk Type Distribution |
This card displays the trunk usage distribution across trunk types that are configured within a CallManager. |
|
Trunk Type Trend |
This card displays the trunk usage trend across trunk types that are configured within a CallManager. |
|
Call Media Type |
This card depicts the distribution of all the attempted, successful, failed, and dropped in a network based on the call media (audio or video) type. By default, in the pie chart, the call media type and the corresponding call volume count are displayed. You can select a call media type (audio or video) on the pie-chart, and the rest of the Call Volume Status cards are updated accordingly based on this filter. |
|
Call Direction |
This card depicts the distribution of all incoming and outgoing successful, failed, and dropped calls. |
|
Calling Number |
This card displays the top five calling numbers in an organization from the calls involving a trunk or gateway. |
|
Called Number |
This card displays the top five called numbers in an organization from the calls involving a trunk or gateway. |
Filters on the Details Page of Capacity Analysis Trunk Types
The filter pane at the top of the details page shows the drop-down list to filter out data and generate charts based on your choice. The available options in the drop-down list are as follows:
-
Mobile and Remote Access
-
User ID
-
URI
-
Phone Number
-
Trunk Usage Distribution
-
Trunk Type Distribution
-
Call Media Type
-
Call Direction
Mobile and Remote Access allows endpoints to have their registration, call control, provisioning, messaging, and presence services that are provided by Cisco Unified Communications Manager (Unified CM) when the endpoint is outside the enterprise network.
In Cloud-Connected UC, Mobile and Remote Access endpoints are determined from CUCM based on the analysis of registered Mobile and Remote Access-supported endpoint IP address. For more information on how to view the analytics for such endpoints, see View Analytics.
You can export the data that is displayed in the charts into an Excel file using the Download button.
For Service Experience charts, the following table lists the columns in the downloaded reports that correspond to the CDR Field Names.
|
Field Name in Downloaded Report |
CDR Field Name |
|---|---|
|
Caller User ID |
callingPartyUnicodeLoginUserID |
|
Called User ID |
finalCalledPartyUnicodeLoginUserID |
|
Caller URI |
callingPartyNumber_uri |
|
Called URI |
finalCalledPartyNumber_uri |
|
Caller Number |
callingPartyNumber |
|
Called Number |
finalCalledPartyNumber |
-
For the Asset Usage charts, the following table lists the columns in the downloaded reports. The report contains User ID, URI, and Dir Number columns that are based on the Unified CM configuration. The maximum number of values for the columns in the report is limited to 10.
-
The User ID field in the Asst Usage download report would be blank for the devices that are configured with owner as Anonymous (Public/Shared Space) in Unified CM and no end user is associated with this device.
|
Field Name in Downloaded Report |
Source Field Name |
|---|---|
|
User ID |
Source field names are as per the configuration on the Unified CM server. |
|
URI | |
|
Dir Number |
| 1 |
From the customer view in Cisco Webex Control Hub, go to . The Connected UC page appears. |
| 2 |
(Optional) To view the analytics for MRA data, enable the MRA data only toggle. |
| 3 |
(Optional) Choose a cluster from the cluster selection drop-down list in the top left. The default setting is All Clusters. |
| 4 |
To filter the data in the charts based on the time period, click the drop-down list in the top right. Supported time ranges are yesterday, last 7 days, last 30 days, last 90 days, and last 12 months. You can view the charts for the period you've selected. The default time range is Last 30 Days. |
| 5 |
Click the card for which you want to download reports. The Details page for the selected category of chart appears. |
| 6 |
On the page that appears, click Download shown at the top-right. Webex client sends the encrypted MAC address of the PC. So, in the download report for Service Experience charts, you can't view the real MAC address of the PC. |
Sometimes due to loss of some telemetry data, the Analytics charts show incomplete data. If any chart has missing data, it’s indicated by a lightning icon shown on the right-hand side of the time period selection drop-down list on the Analytics page. This helps you to know if there’s any mismatch with regards to the data shown on the charts.
If there’s no loss of data during the past seven days, the lightning icon isn’t displayed.
| 1 |
From the customer view in Control Hub, go to . The Analytics appears. |
| 2 |
Click The Missing Data Event window appears. The window lists the Event Created Time, Cluster Name, Node Name, and Details. The number on the icon is the count of the missing data notifications since your last login. This count is reset after you check the notifications. |
| 3 |
If you want to search for specific missing data events, use the search box at the top left of the window. You can perform a search based on Event Created Time, Cluster Name, Node Name, and Details. |
On the Analytics page, you can change the sequence of the charts that belong to the same category. This enables you to personalize your view of the cards.
-
You can shuffle the sequence of the charts on both the overview and details pages.
-
The preferences that you set are saved for all future sessions with your login credentials and across different browsers.
| 1 |
From the customer view in Control Hub, go to . The Analytics page appears. |
| 2 |
Click the card containing the chart that you want to move. Then, drag and drop the card to the location where you want to see it displayed. If you drag the card outside the boundaries of the page, you can’t reorder it. |
On the Analytics page, you can hide a chart that isn't relevant to you. You can also unhide a chart that was previously hidden by you. This enables you to personalize your view of the cards.
-
The preferences that you set are saved for all future sessions with your login credentials and across different browsers.
-
When you hide a chart, it disappears from the Filters drop-down list.
| 1 |
From the customer view in Control Hub, go to . The Analytics page appears. |
| 2 |
To hide a chart, click … on the card and select Remove Card. |
| 3 |
To unhide a chart, click |
| 4 |
In the Add Charts window, select the charts that you want to unhide and click Add Charts. You can select multiple cards from different categories in one go and unhide them. |


