
Thanks for your feedback.
 Feedback?
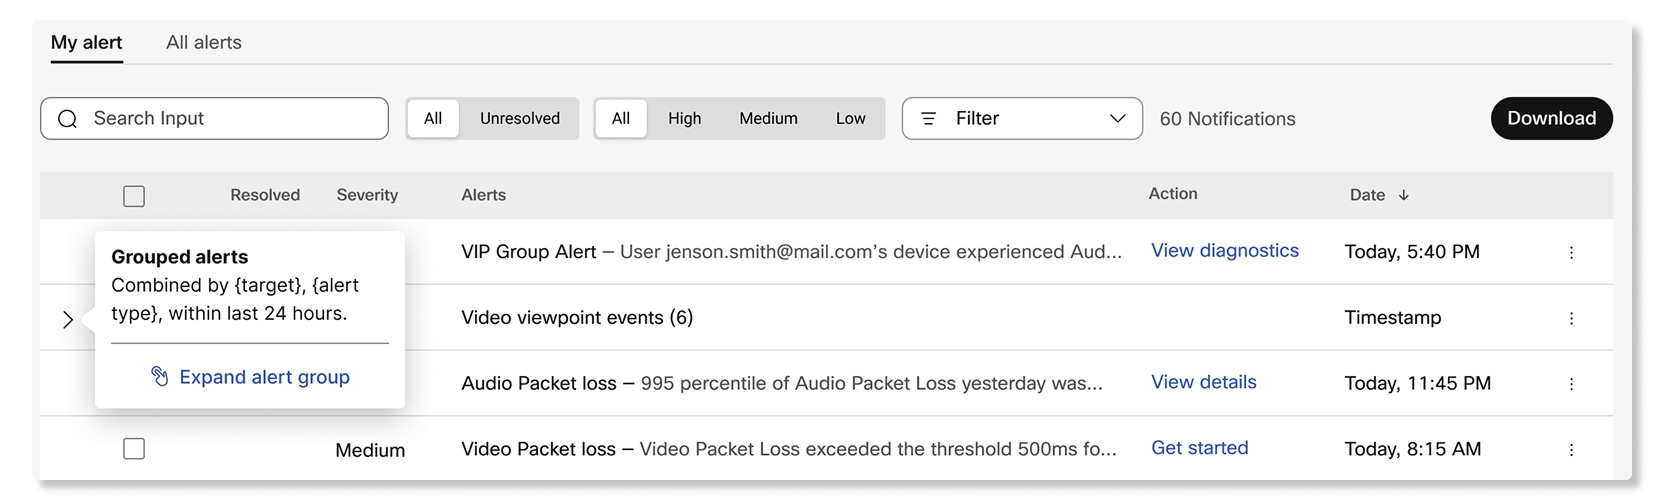
Notifications in Control Hub is a central place to manage alerts for your Webex deployment. Administrators can configure alerts to be delivered through email, webhooks, PagerDuty, or in a Webex App space. Regardless of the delivery channel configured, all alerts will always appear in Control Hub.
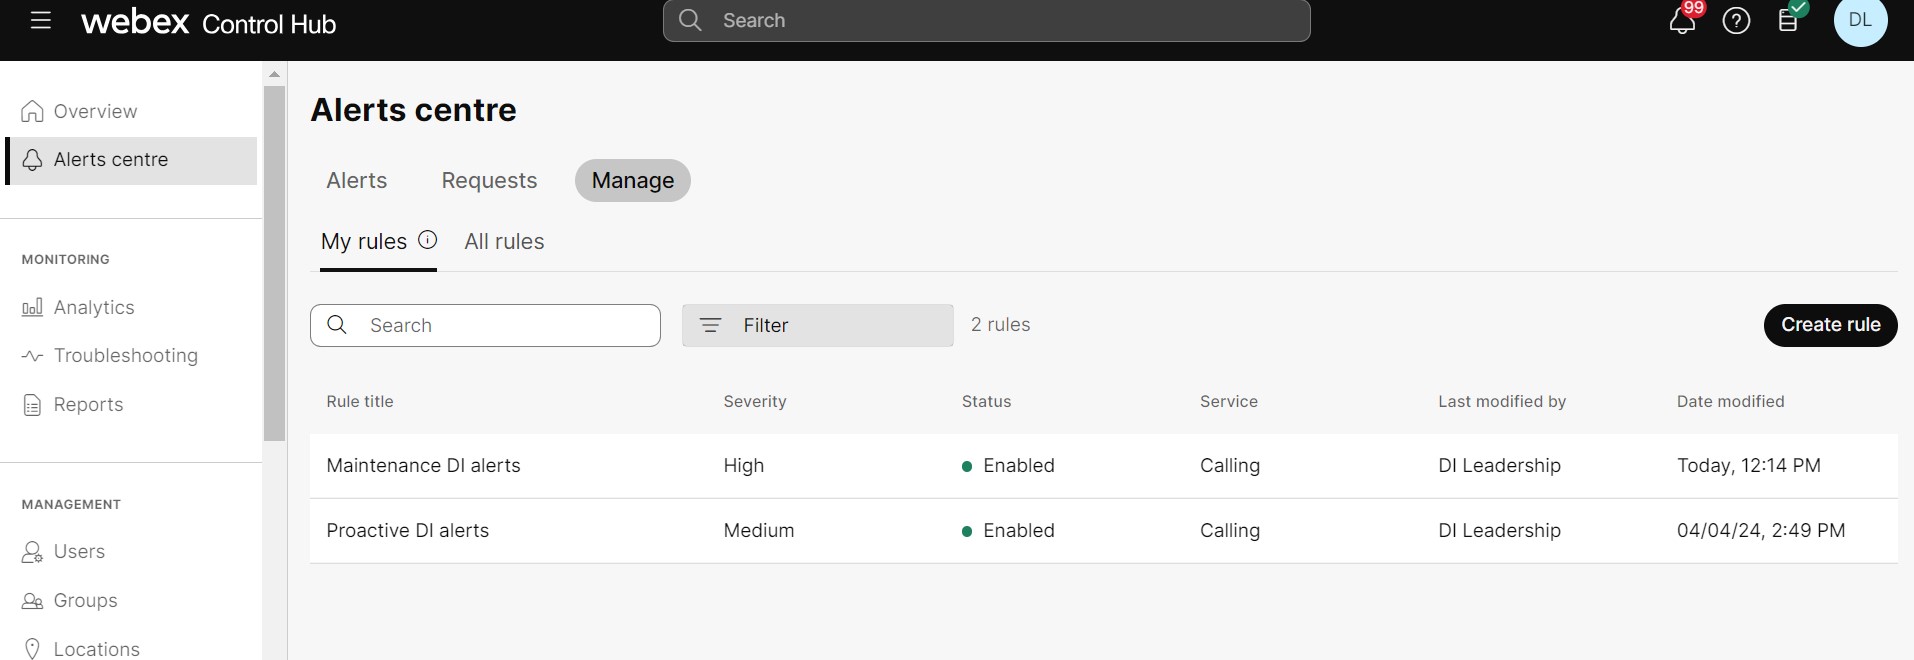
Each administrator has their own set of alerts and rules that they can create and view in My alerts and My rules tabs, and they can view all alerts and rules from other administrators in the organization in the All alerts and All rules tabs.
Alerts for the last 14 days will appear in the Alerts section. You can export historical alerts for the last 30 days in a CSV format by clicking on the export button.
Every 24 hours, alerts of the same severity, type, and target are grouped together in a collapsible drop-down menu to make it easier for you to view and navigate. You can hover over the expand button to see how the alerts were combined.
There are two categories of alerts: Threshold-based and Service-generated.
Threshold-based alerts
Administrators can create a rule to monitor for specific events by specifying specific thresholds, such as participants who reach more than 300ms of latency or a packet loss of more than 8%. These alerts are only triggered if the administrators configure them by creating a rule.
Administrators can further configure how these alerts are delivered by choosing the delivery channel for them:
- Email—You can add up to 30 email addresses as recipients to receive the alerts.
- Webex App—You can receive the alert in a new space, an existing
space, or in a 1:1 space.
If an existing space gets renamed, the alert will still be delivered to the same space.
- Webhook—The alerts will be delivered to the webhook URL configured in Control Hub.
- PagerDuty—You can input a service key to deliver the alerts to a related service using PagerDuty.
Service-generated alerts
These alerts are created automatically by Webex services. Most of these alerts are critical in nature that the administrator should pay attention to. Administrators can manage how these alerts are delivered by choosing the delivery channel for them similar to threshold-based alerts. The delivery channels include email, Webex App, webhook, and PagerDuty.
View alerts and rules
| 1 |
Sign in to Control Hub and go to Notifications. |
| 2 |
Select one of the following:
|
For Webex Meetings, you can create rules to get alerts for:
- Live meeting monitoring—Use this alert to find out when participants are experiencing media quality issues during meetings that are in progress. You can create up to 10 of these alerts.
- Device live meeting monitoring—Use this alert to find out when devices are experiencing media quality issues during meetings that are in progress. You can create up to 25 of these alerts.
- Historical meeting quality trend—Use this alert to find out when a percentage of participants in specific Webex sites and locations reach the media quality thresholds that are set automatically based on the past performance of meetings within the last seven days. You can create up to 10 of these alerts.
- Historical meeting quality monitoring—Similar to the history meeting quality trend alert, you can use this alert to set your own thresholds on when to receive an alert when a percentage of participants in specific Webex sites and locations reach any of the media quality thresholds. You can create up to 10 of these alerts.
Meeting alerts only trigger for participants who attend meetings through Webex Meetings and Webex App. The minimum app versions that participants must use for alerts to trigger are:
-
Webex Meetings desktop app version 39.6.5 or higher
-
Webex Meetings mobile app for Android and iOS version 39.11 or higher
-
Webex App desktop version 3.0.12427.0 or higher
-
Webex App mobile Android version 4.1.6 or higher
-
Webex App mobile iOS version 4.3 or higher
Alerts don't trigger for audio-only meetings, Webex Events, and Webex Training sessions.
You can enable up to 10 live meeting monitoring alerts per organization. Each alert can monitor up to either 30 user email addresses or 30 devices.
If the Monitor all participants check box is checked, then the alert only triggers for meetings with fewer than 50 participants.
| 1 |
Sign in to Control Hub and go to Notifications > My rules. |
| 2 |
Click Create rule. |
| 3 |
Select Live meeting monitoring next to Type, and enter the name for the alert next to Title. |
| 4 |
Toggle the Status switch to on to receive notifications for the alert. |
| 5 |
Select User email(s) or Device name(s) and enter up to 30 user email addresses or devices. |
| 6 |
Check the Monitor all participants check box to receive alerts for all of the participants that are in the same meetings as the users or devices in the list. |
| 7 |
In the Rules section, set the following thresholds:
|
| 8 |
Set the Accumulated and Consecutive duration for the alert to trigger. |
| 9 |
In the Delivery channel section, check the Email check box and enter the email addresses of who will receive the alerts. |
| 10 |
Check the Webex space check box and enter the name of the space if you want to receive messages in that space whenever a threshold is reached. |
| 11 |
Click Save. |
You can enable up to 25 device live meeting monitoring alerts per organization.
| 1 |
Sign in to Control Hub and go to Notifications > My rules. |
| 2 |
Click Create rule. |
| 3 |
Select Device live meeting monitoring next to Type, and enter the name for the alert next to Title. |
| 4 |
Toggle the Enabled switch to on to receive notifications for the alert. |
| 5 |
Choose to monitor:
|
| 6 |
In the Rules section, set the following audio and video thresholds:
|
| 7 |
Set the Accumulated and Consecutive duration for the alert to trigger. |
| 8 |
In the Delivery channel section, you can:
|
| 9 |
Click Save. |
You can add up to 10 historical meeting quality trend alerts per organization.
| 1 |
Sign in to Control Hub and go to Notifications > My rules. |
| 2 |
Click Create rule. |
| 3 |
Select Historical meeting quality trend next to Type, and enter the name for the alert next to Title. |
| 4 |
Toggle the Status switch to on to receive notifications for the alert. |
| 5 |
Select which Webex site and participant locations to receive alerts for. |
| 6 |
In the Delivery channel section, check the Email check box and enter the email addresses of who will receive the alerts. |
| 7 |
Check the Webex space check box and enter the name of the space if you want to receive messages in that space whenever a threshold is reached. |
| 8 |
Click Save. |
You can enable up to 10 historical meeting quality monitoring alerts per organization.
| 1 |
Sign in to Control Hub and go to Notifications > My rules. |
| 2 |
Click Create rule. |
| 3 |
Select Historical meeting quality monitoring next to Type, and enter the name for the alert next to Title. |
| 4 |
Toggle the Status switch to on to receive notifications for the alert. |
| 5 |
Select which Webex site and participant locations to receive alerts for. |
| 6 |
In the Rules section, set the following thresholds:
|
| 7 |
In the Trigger section, select a duration to monitor and enter the percentage of participants that must reach one of the thresholds to trigger the alert. |
| 8 |
In the Delivery channel section, check the Email check box and enter the email addresses of who will receive the alerts. |
| 9 |
Check the Webex space check box and enter the name of the space if you want to receive messages in that space whenever a threshold is reached. |
| 10 |
Click Save. |
For Webex Calling, you can configure the following alerts:
Add a call quality drop alert
Use this alert to find out when the call quality at specific locations or a user's media session drops to poor quality.
Call quality is calculated as:
- Good—Both video and audio stream had jitter below 150ms, latency below 400ms, and packet loss below 5%.
- Poor—Both video and audio stream had jitter above 150ms, latency above 400ms, and packet loss above 5%.
Alerts are sent out when a call ends. When you receive the alert, you can click Troubleshoot Call to take you straight to the call in Troubleshooting if the alert is monitoring specific users. If the alert is monitoring locations, you can click View Analytics to take you to the Media Quality tab in Calling Analytics.
You can create up to 10 Call Quality Drop alerts per organization.
Alerts are not triggered on Dedicated Instance (DI) based trunks.
| 1 |
Sign in to Control Hub. |
| 2 |
Go to Notifications > My rules. |
| 3 |
Click Create rule. |
| 4 |
From the Service drop-down list, select Calling. 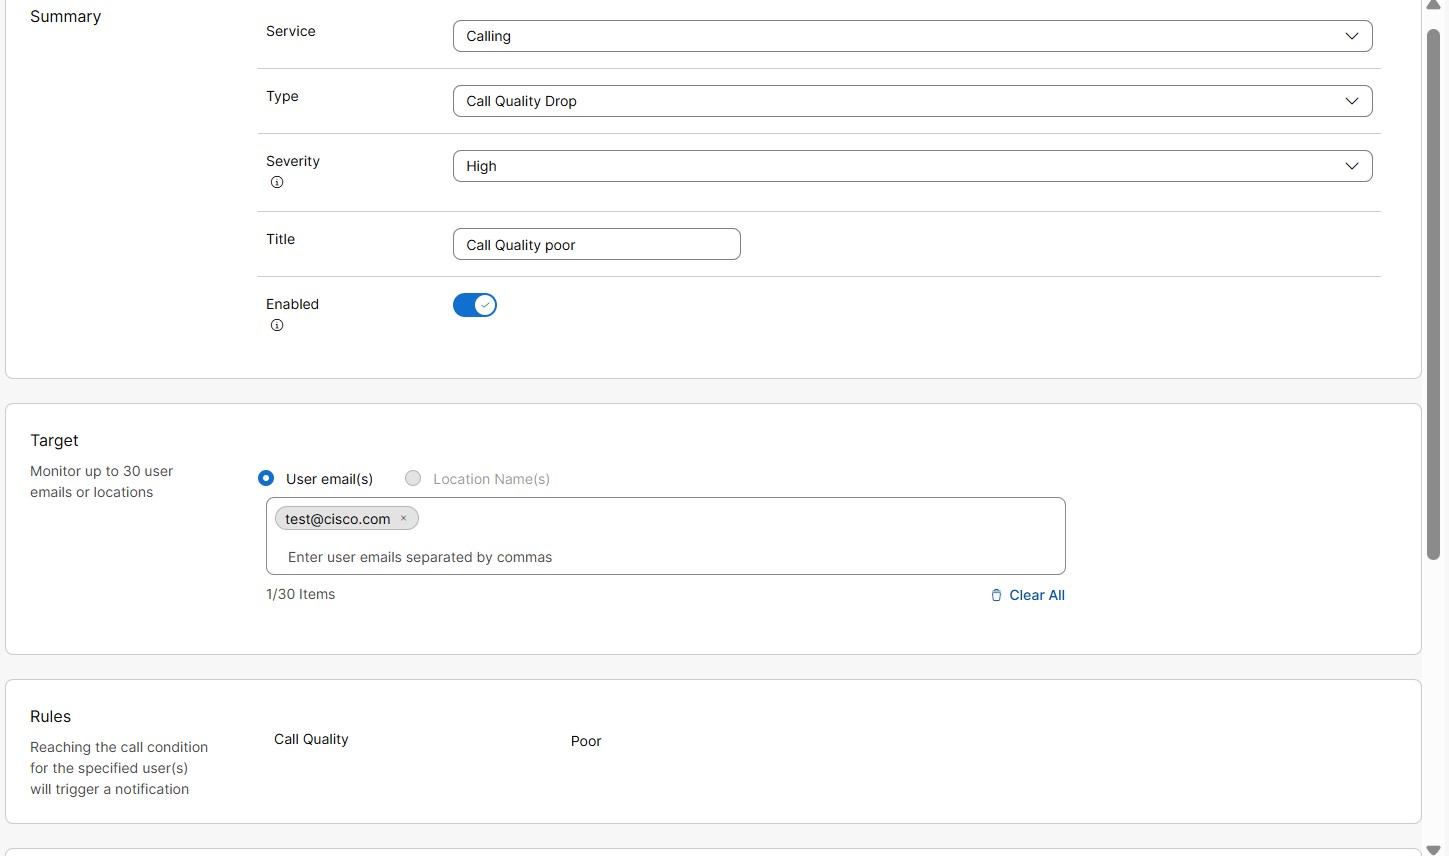
|
| 5 |
From the Type drop-down list, select Call Quality Drop. |
| 6 |
From the Severity drop-down list. This field shows how severe or important an alert is. You can choose severity level as
High, Medium, or Low.
|
| 7 |
Enter a Title. |
| 8 |
Toggle on Enabled to receive notifications for the alert. |
| 9 |
In Target section, select User email(s) or Location name(s). You can enter up to 30 user email addresses or locations to monitor.
|
| 10 |
In the Delivery channel section, choose how to receive the alerts: 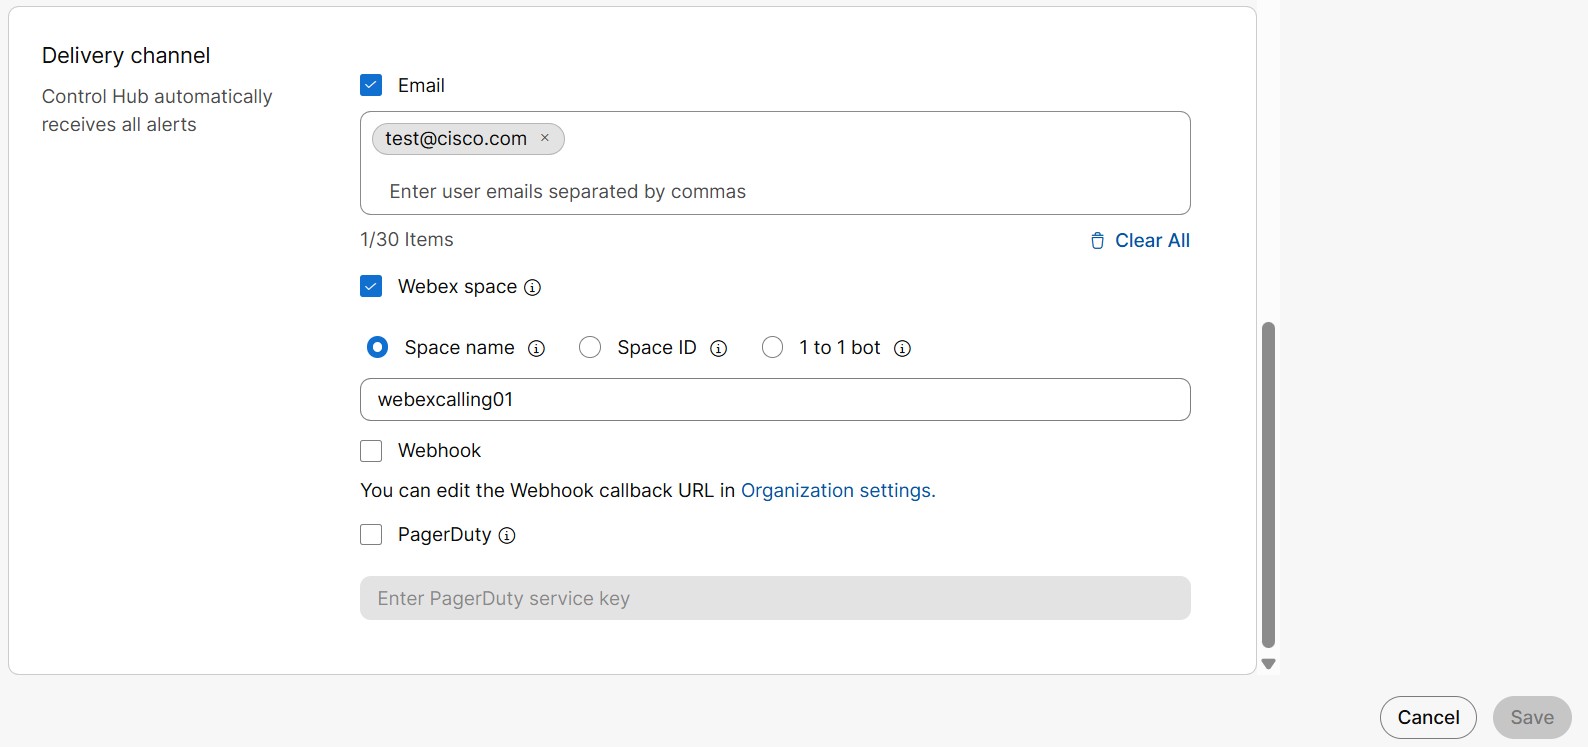
|
| 11 |
Click Save. |
Add a trunk status change alert
An alert is sent out when the status of the monitored trunk changes. The available trunk statuses are online, offline, and impaired. You can configure which status change should trigger an alert.
The following are the different trunk status:
-
Online—Successful registration of Local Gateway to Webex Calling.
-
Offline—Unsuccessful registration of Local Gateway to Webex Calling.
-
Impaired—Unsuccessful connection between at least one Webex Calling Edge proxy and Local Gateway.
-
Unknown—In the process of establishing a connection between Webex Calling and the Local Gateway that is recently added.
To know more about various status error changes, refer to help center article Local Gateway Troubleshooting section.
| 1 |
Sign in to Control Hub. |
| 2 |
Go to Notifications > My rules. |
| 3 |
Click Create rule. |
| 4 |
From the Service drop-down list, select Calling. 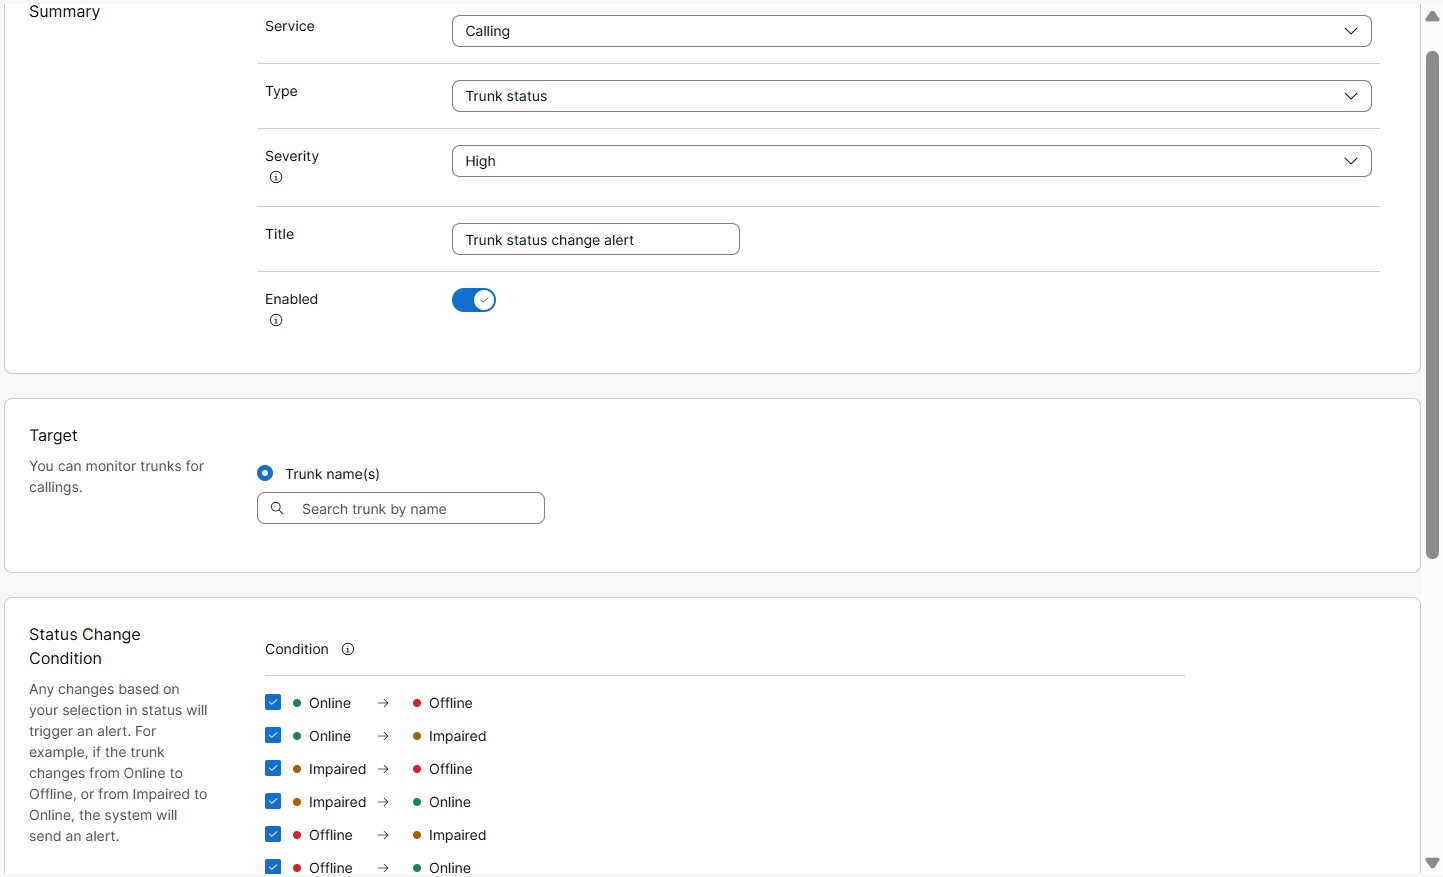
|
| 5 |
From the Type drop-down list, select Trunk status. |
| 6 |
From the Severity drop-down list. This field shows how severe or important an alert is. You can choose severity level as
High, Medium, or Low.
|
| 7 |
Enter a Title. |
| 8 |
Toggle on Enabled to receive notifications for the alert |
| 9 |
In Target section, select Trunk name(s). You can enter up to 30 trunks to monitor.
Alerts are not triggered on Dedicated Instance (DI) based trunks. |
| 10 |
In the Rule definition section, you can define the rule for when alert needs to be triggered. You can select all or choose from the following status changes:
|
| 11 |
In the Delivery channel section, choose how to receive the alerts:
|
| 12 |
Click Save. |
Add a trunk concurrent call limit alert
An alert is sent out when threshold limit of concurrent calls on trunk is reached. This alert helps to identify the busy hour or day when trunk capacity is reached to handle concurrent calls.
Consecutive alerts are triggered at the selected time interval, if the configured threshold continues to breach.
| 1 |
Sign in to Control Hub. |
| 2 |
Go to Notifications > My rules. |
| 3 |
Click Create rule. |
| 4 |
From the Service drop-down list, select Calling. 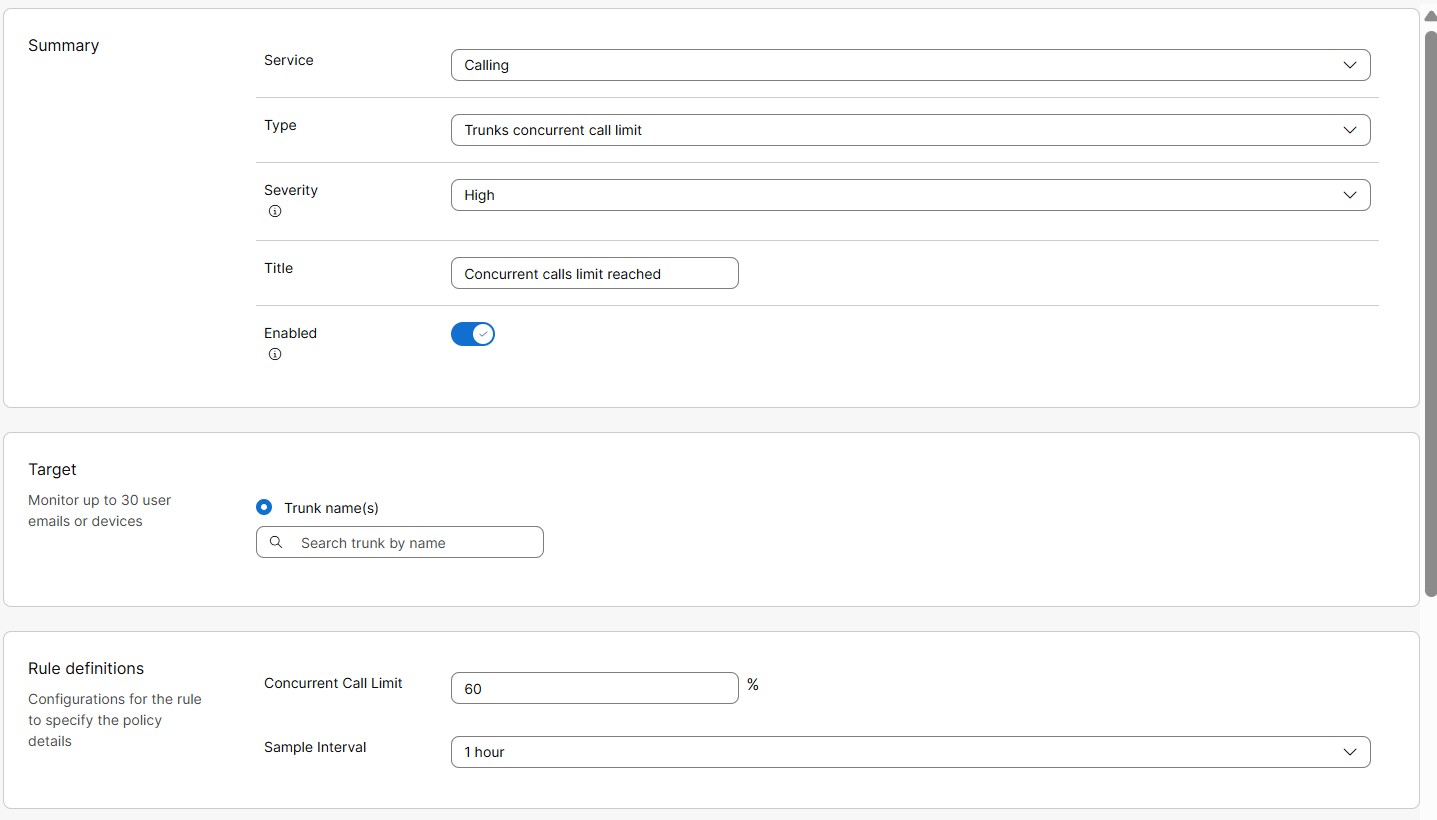
|
| 5 |
From the Type drop-down list, select Trunk concurrent call limit. |
| 6 |
From the Severity drop-down list. This field shows how severe or important an alert is. You can choose severity level as
High, Medium, or Low.
|
| 7 |
Enter a Title. |
| 8 |
Toggle on Enabled to receive notifications for the alert. |
| 9 |
In the Target section, select Trunk name(s). You can enter up to 30 trunks to monitor.
Alerts are not triggered on Dedicated Instance (DI) based trunks. |
| 10 |
In the Rule definitions section, you can define the rule for when alert needs to be triggered. Enter the following values for Concurrent call limit threshold condition: |
| 11 |
In the Delivery channel section, choose how to receive the alerts:
|
| 12 |
Click Save. |
Trunk certificate expiry alert
An alert is sent out when the certificate of a certificate-based trunk is about to expire or has expired. This is a system-generated alert, enabled by default for organizations with certificate-based trunks.
Before the certificate expires, automatic alerts are sent out on predefined days, such as on 60th day, 30th day, 15th day, and 7th day before expiry. After the certificate expires, an alert is sent out immediately and only once. No consecutive alerts are sent.
Alerts are not triggered on Dedicated Instance (DI) based trunks.
Route List calls blocked alert
When the number of concurrent calls exceeds the Route List Calls license limit, up to 20% additional capacity (bursting) is allowed. When the off-net (PSTN) call volume exceeds 20% bursting limits, they are blocked. An alert is sent to the user about Route List calls are blocked.
Before you begin
| 1 |
Sign in to Control Hub. |
| 2 |
Go to Notifications > All rules. List of all rules is displayed.
|
| 3 |
Select Route List Calls Blocked alert. Route List Calls Blocked alert is a system-generated alert. Therefore you can only edit few of its details as mentioned in next steps. 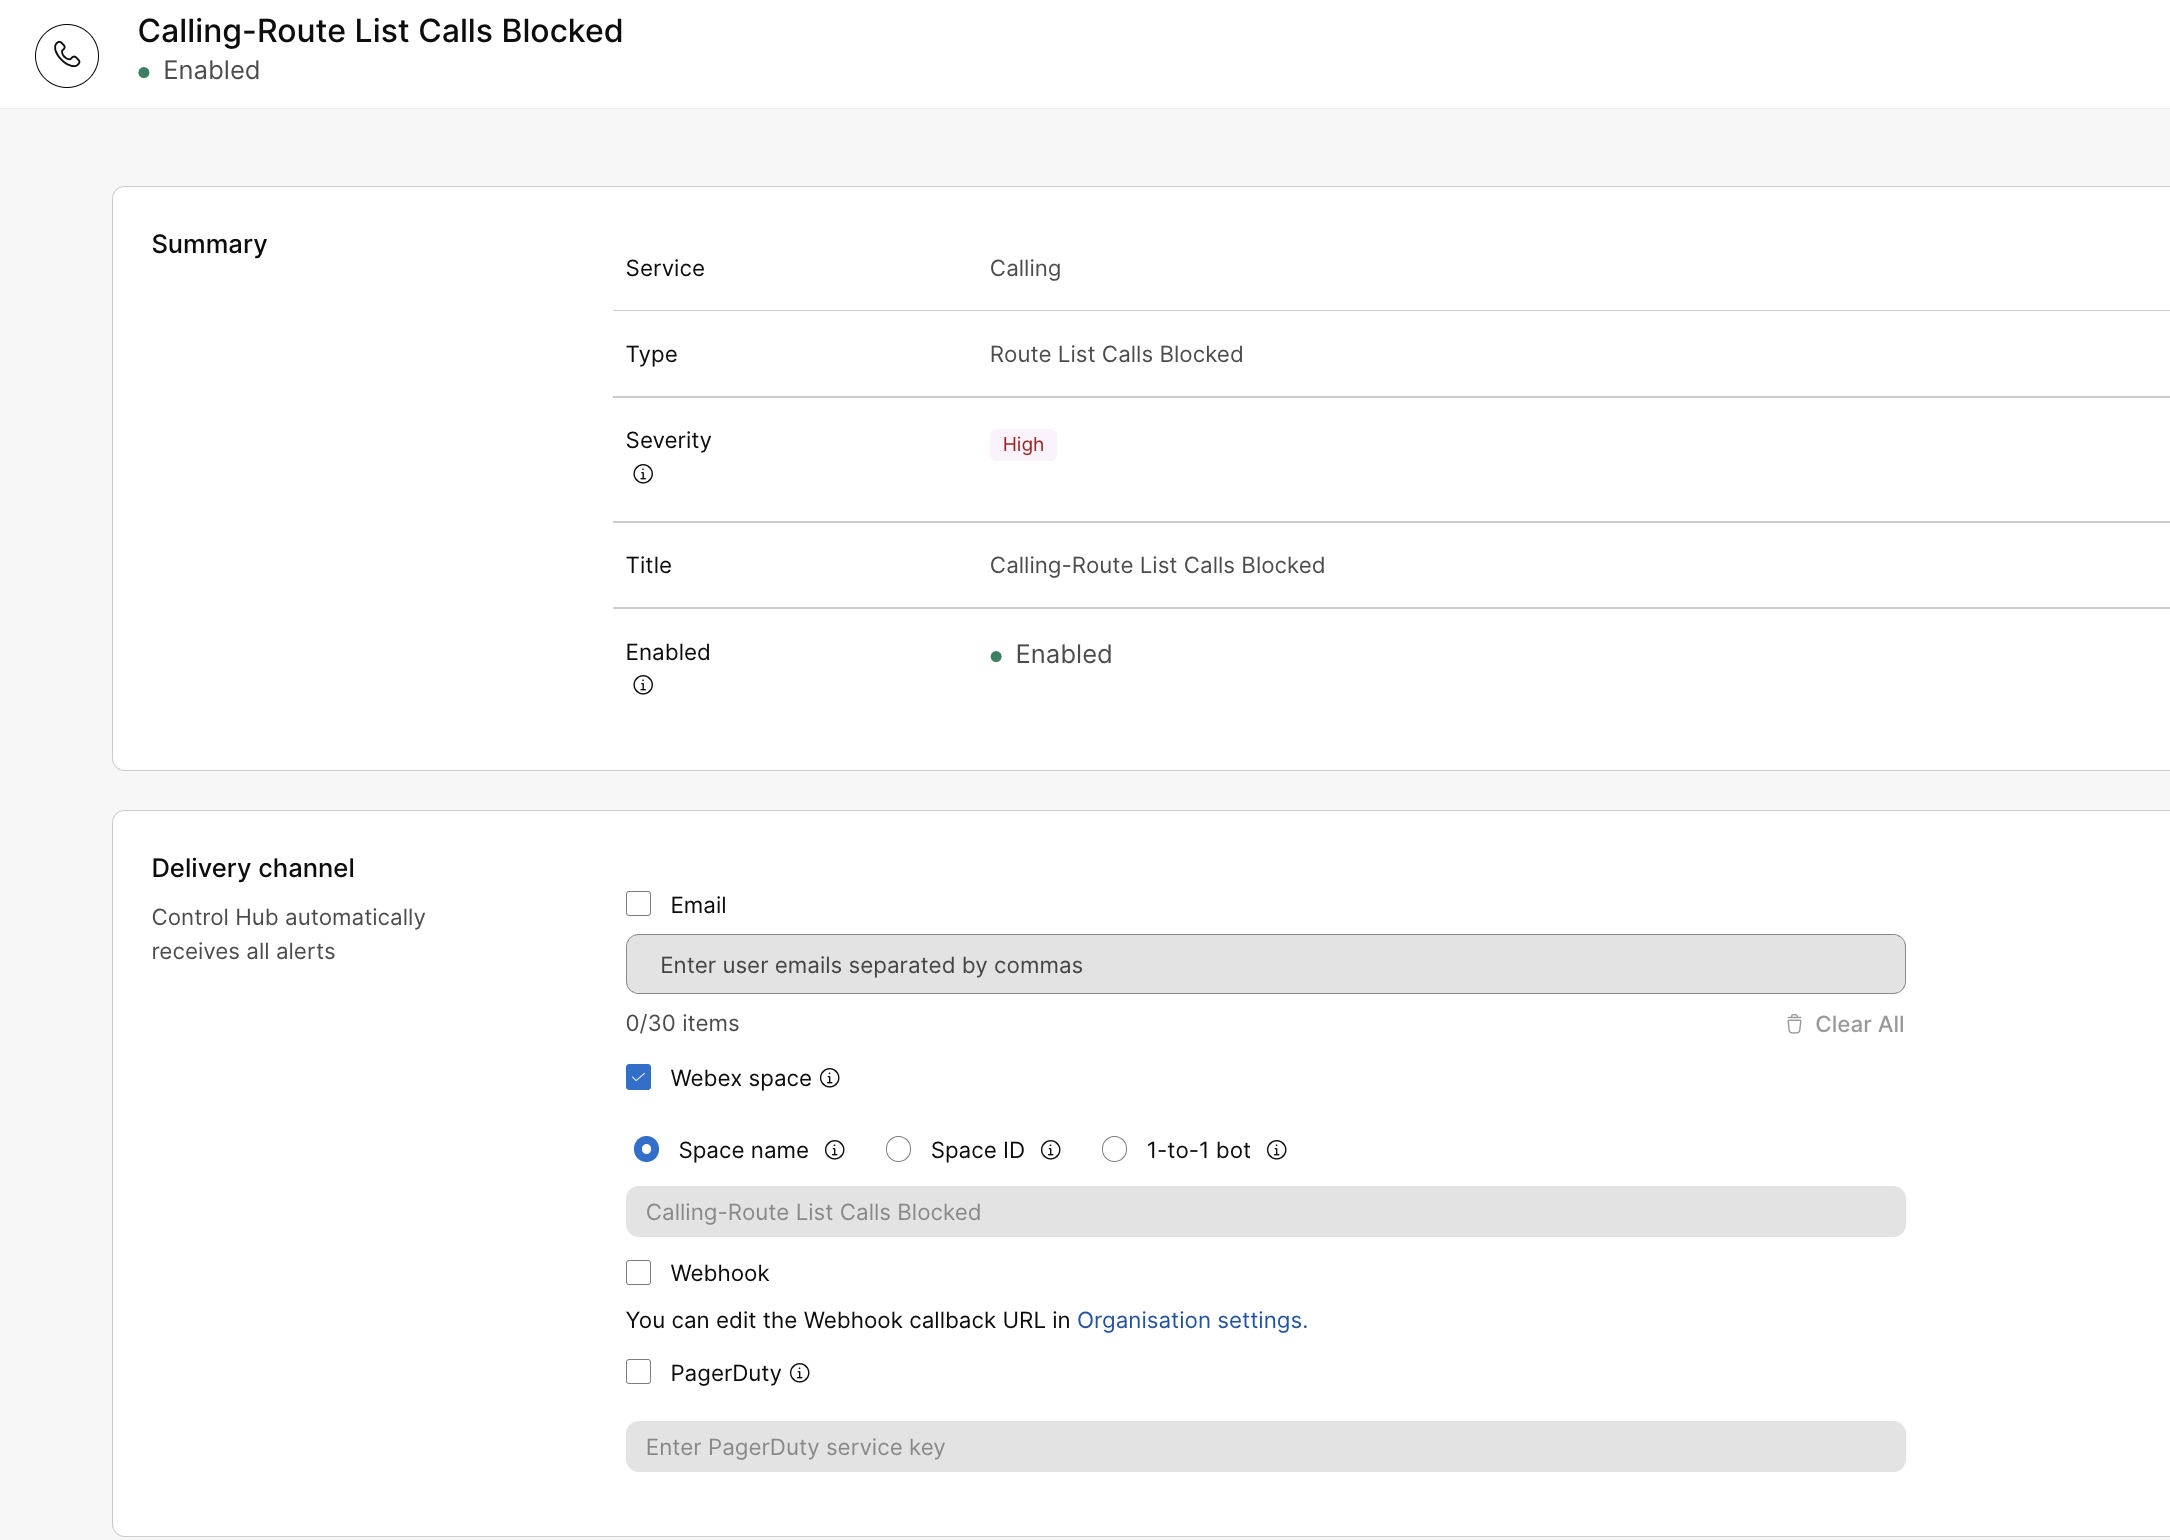
|
| 4 |
In the Delivery channel section, choose how to receive the alerts:
|
| 5 |
Click Save. |
There are two categories of service alerts for Dedicated Instance: Maintenance alerts and Proactive alerts.
Maintenance alerts
The system enables maintenance alerts by default. Partner or customer administrators should verify or configure the delivery channel to receive notifications via email and/or Webex space. Maintenance alerts are used to send notifications about maintenance, outages, and incident communication.
To add delivery channel information to receive maintenance alerts:
- Sign in to Control Hub and go to Notifications > All rules.
- Click Calling-Maintenance and Outage Alerts and scroll down to Delivery Channel.
- Select either or both of the Email or Webex spaces check boxes to receive notification on the preferred channel.
You can add upto 30 email IDs.
To receive notifications in a Webex space, you must have a Messaging license. If bot access is enabled in Apps/Bots and you're allowed to be a member of the organization room, you’ll get the notifications. Otherwise, contact your organization administrator to resolve the issue.
You can select Webhooks if you have Webhooks enabled at the organizational level. For more information, see Enable webhooks for alerts in Control Hub.
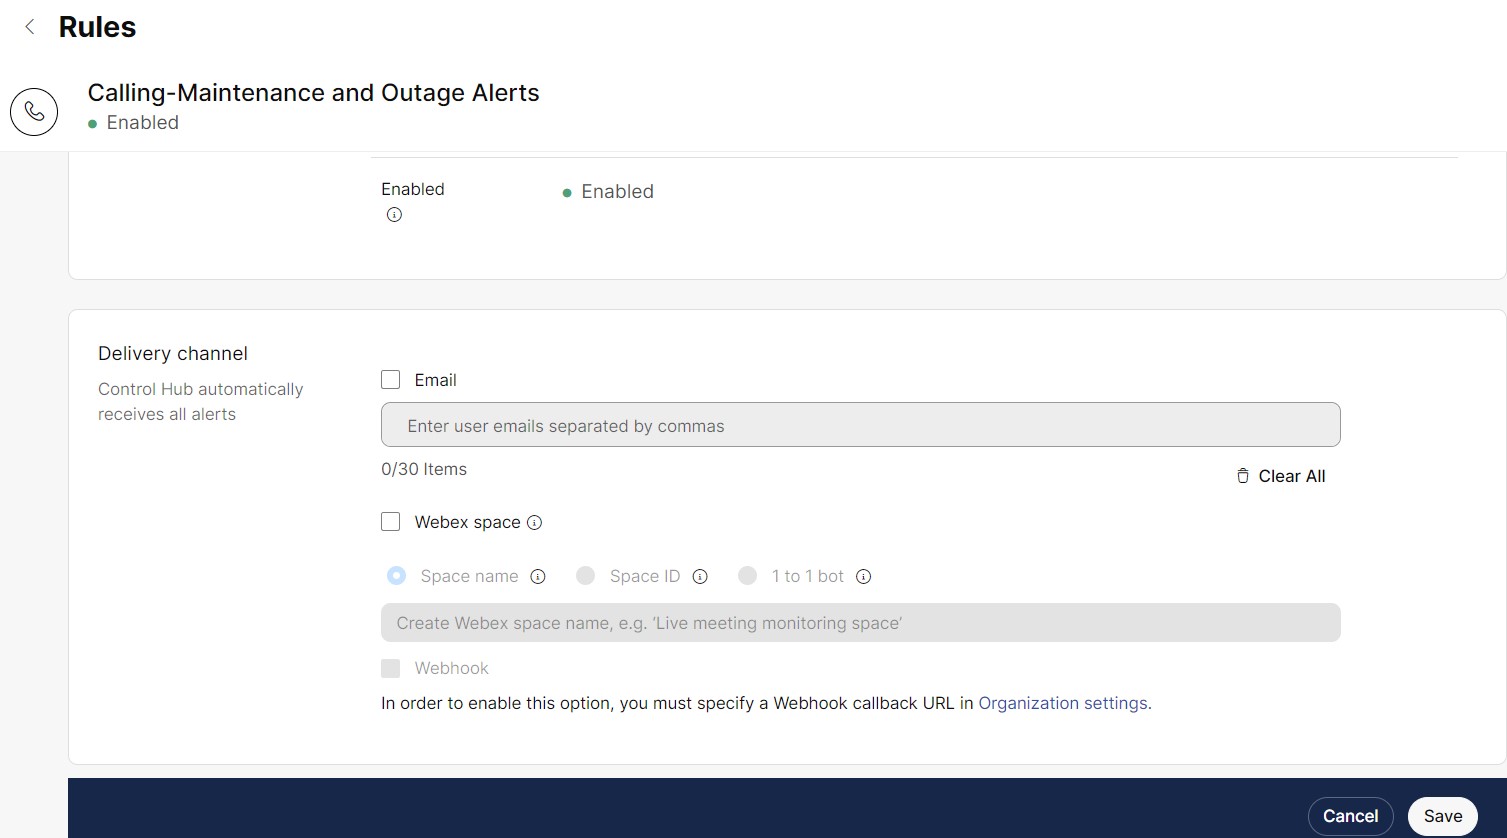
- Enter the Email and Webex space information and click Save to save the changes.
Whenever maintenance occurs, Control Hub automatically displays a banner with the cluster details, region, and the scheduled date and time.

Proactive alerts
Partner or customer administrators can subscribe to day two or day three proactive alerts and event notifications, and choose to have them delivered via email, Webex App spaces, or both by selecting the Delivery Channel when creating the alert.
For example: Unified CM Video Conf Bridge Out of Resource Count High, Unified CM MTP Out of Resource Count High.
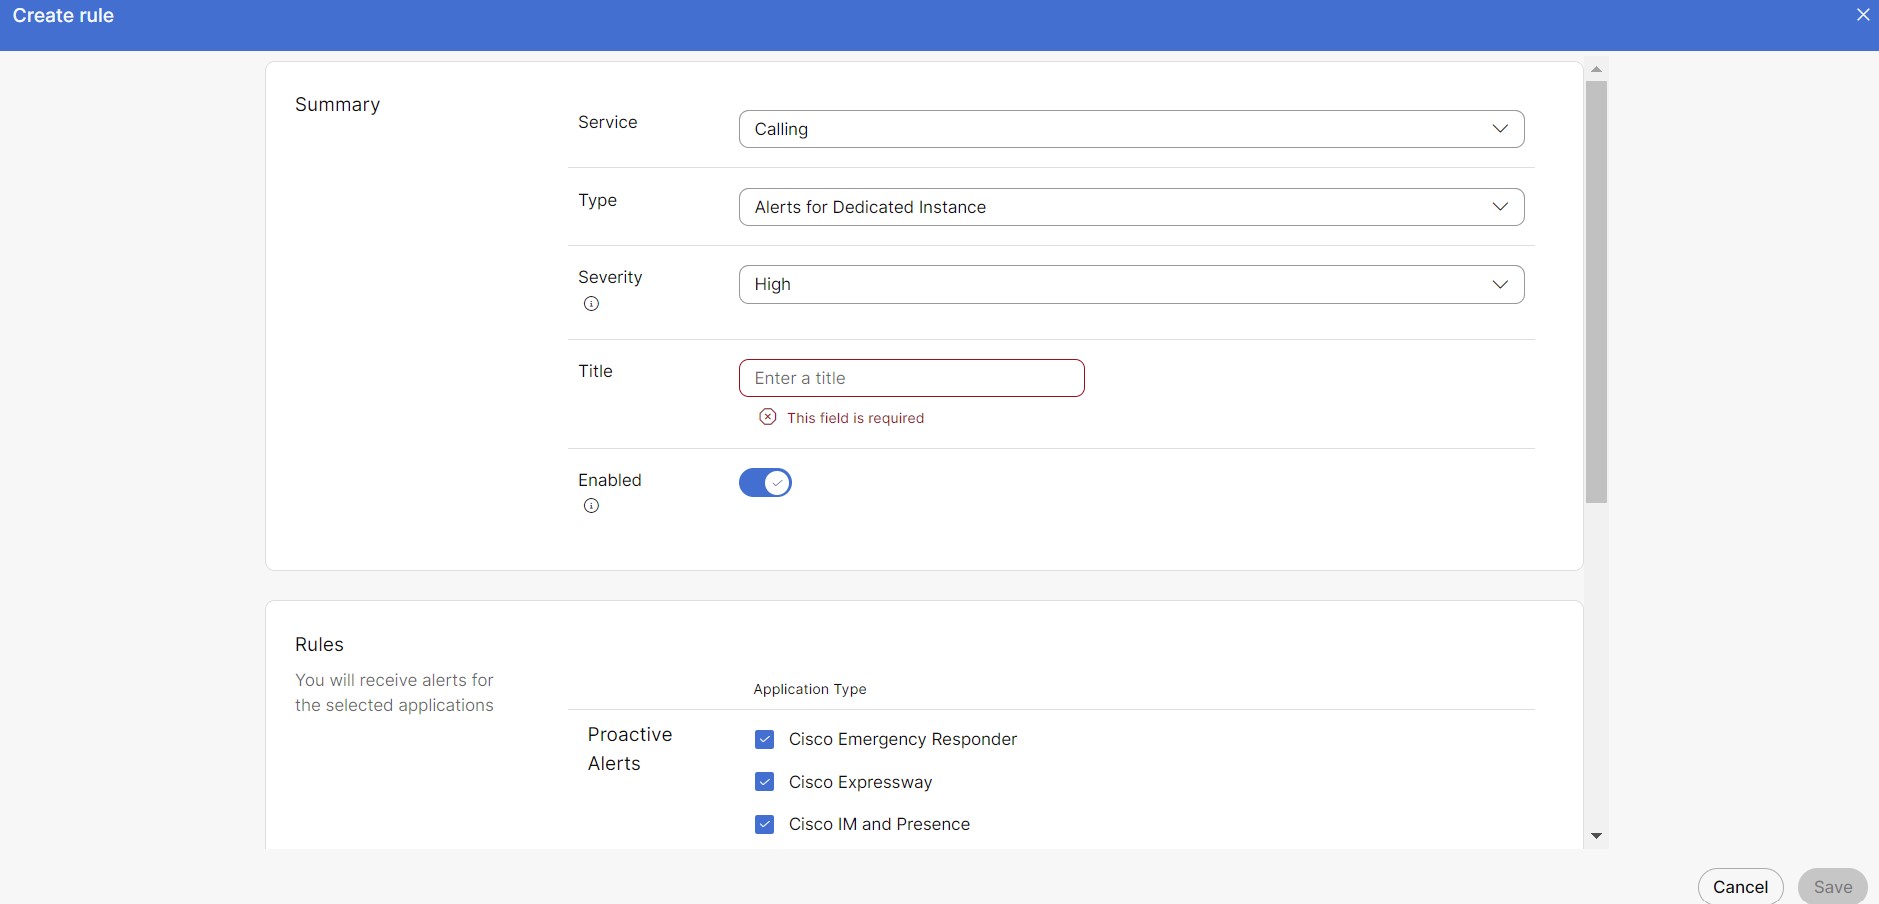
To create a proactive alert rule
Only partner or customer admin with full admin rights can create rules.
- Sign in to Control Hub and go to Notifications > My rules.
- Select Create rule.
- In the Summary section:
- Select Calling from the Service drop-down list.
- Select Alerts for Dedicated Instance from the Type drop-down list.
- Select the preferred Severity. By default the severity is High.
-
We recommend creating rules for proactive alerts with medium or low severity.
-
You receive alerts that match or exceed the severity level you selected when setting up the rule.
-
- Add Title for the new rule.
- All the check boxes in the Rules section are selected by default. Uncheck the ones based on your preferences.
- Select the Delivery Channel to receive the alert.
You can select Webhooks if you have Webhooks enabled at the organizational level. For more information, see Enable webhooks for alerts in Control Hub.
- Click Save.
Once the rules are created, it takes a maximum of 6 hours to start receiving the notifications.
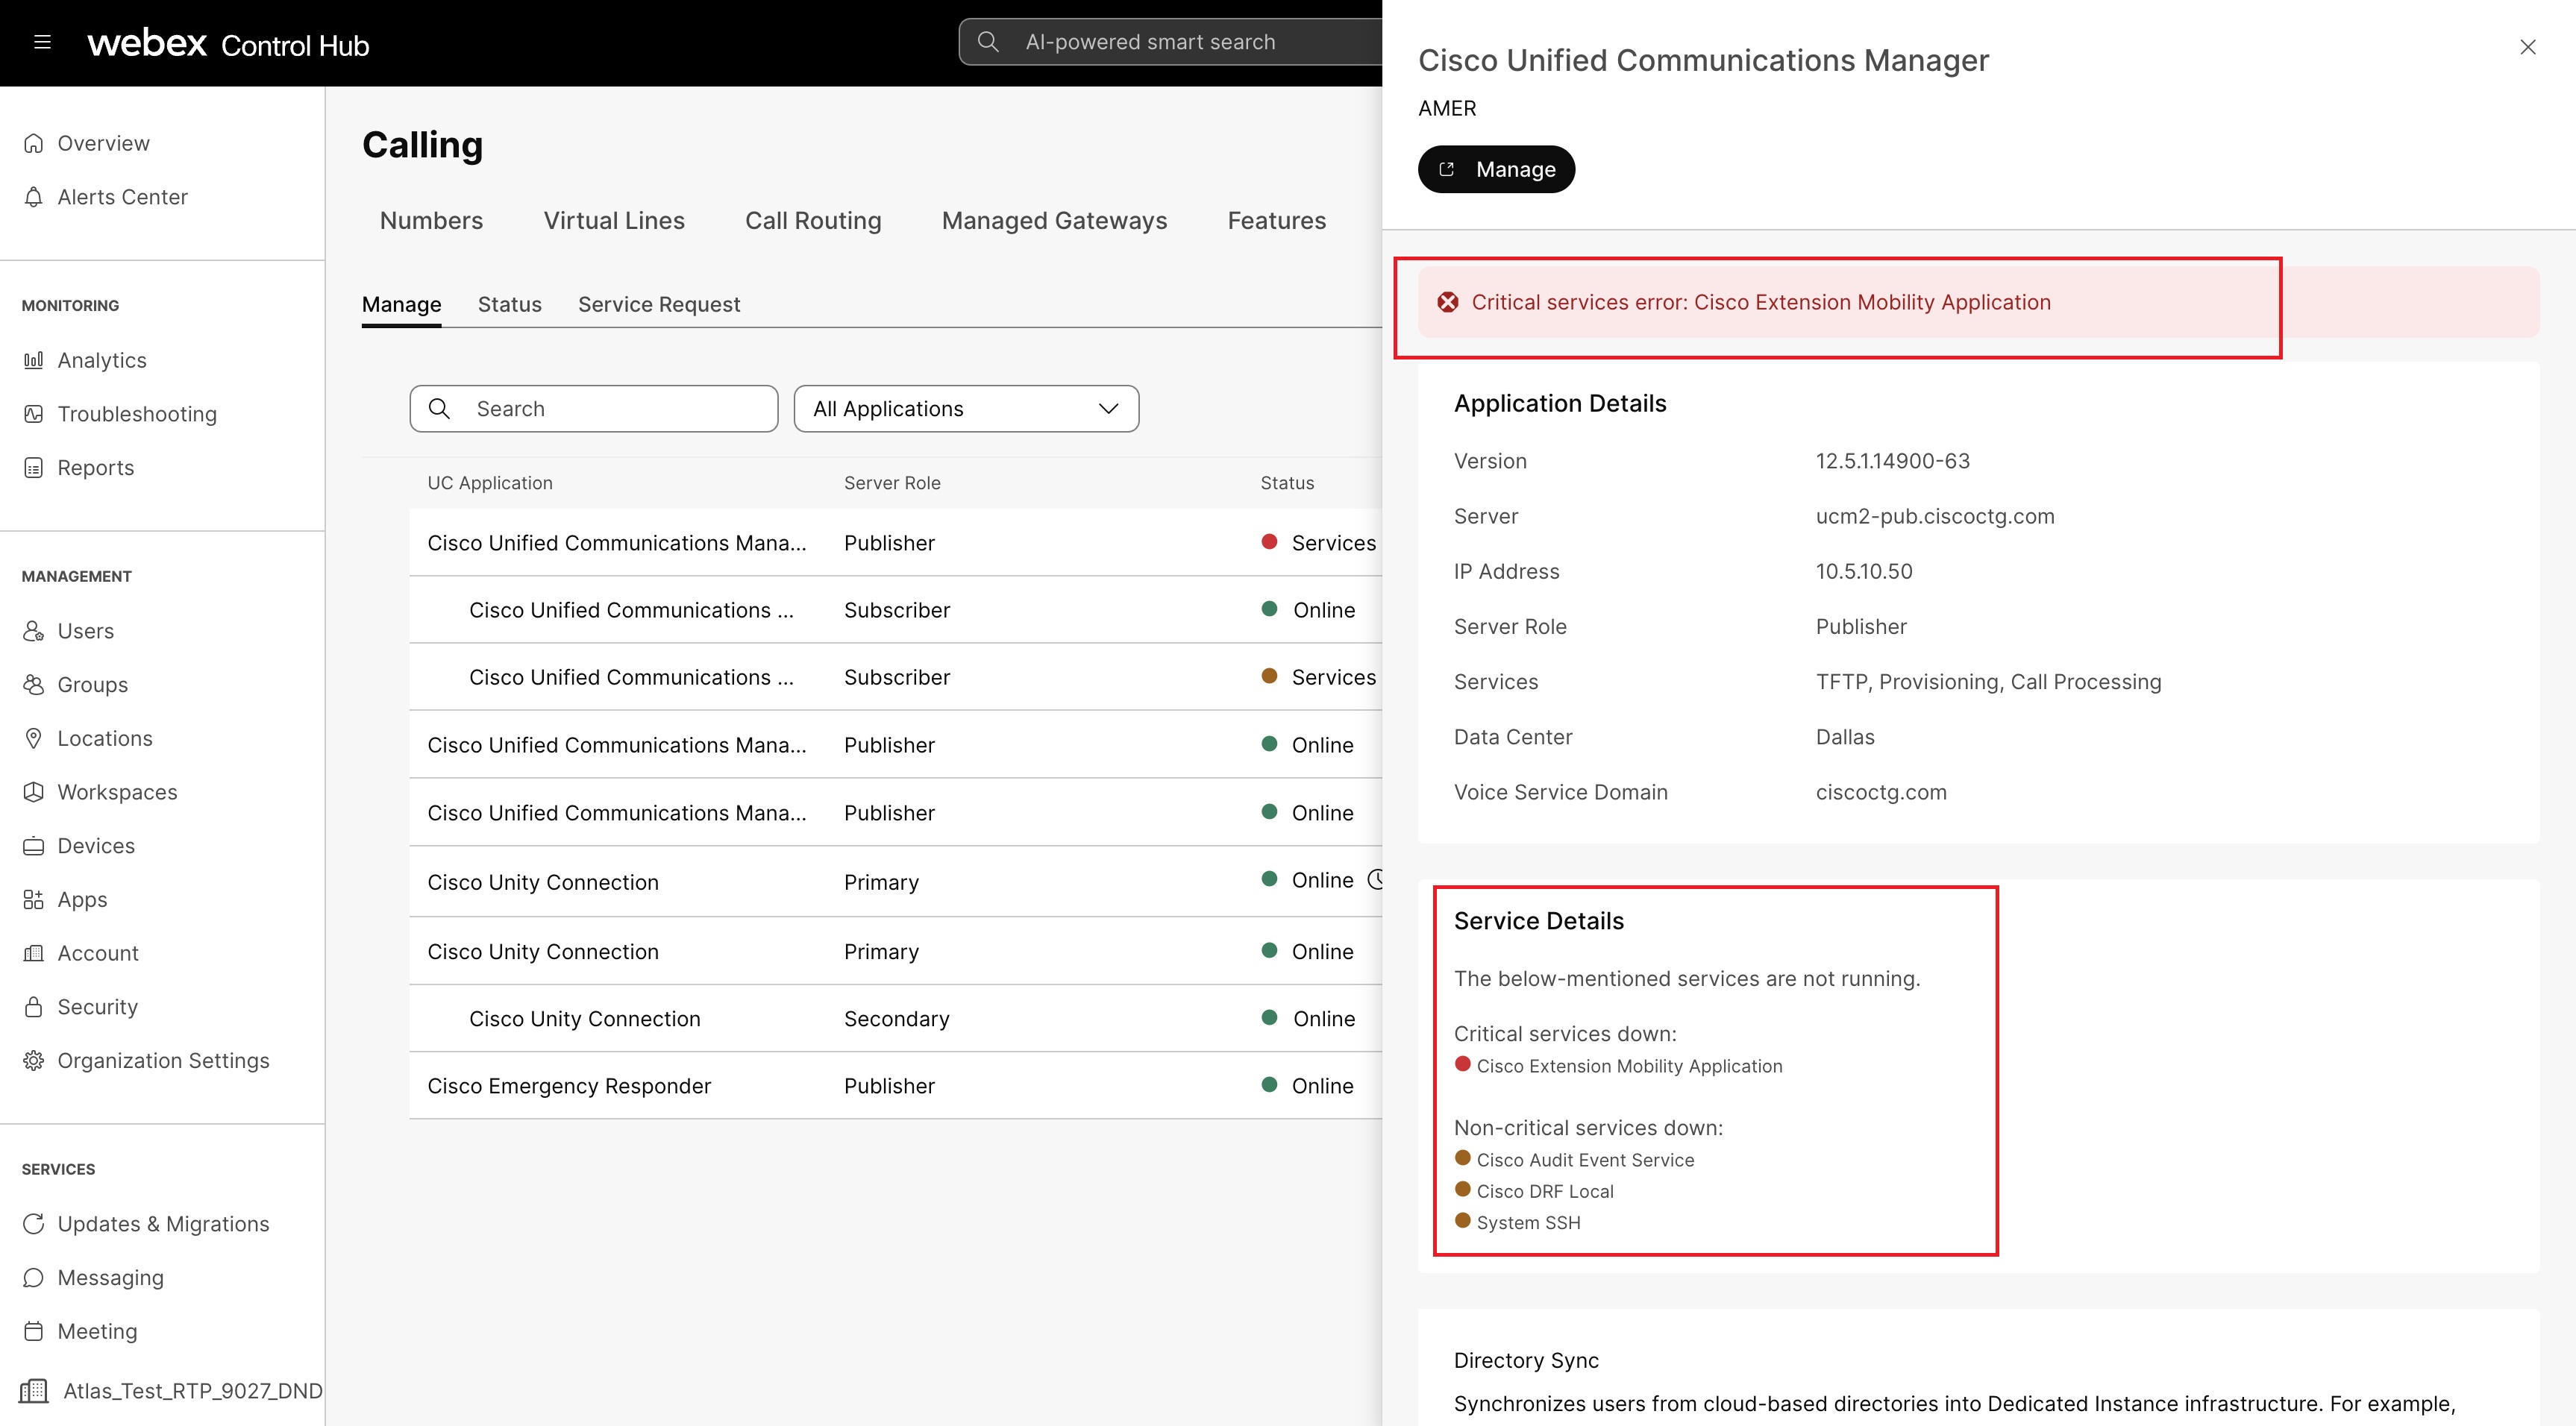
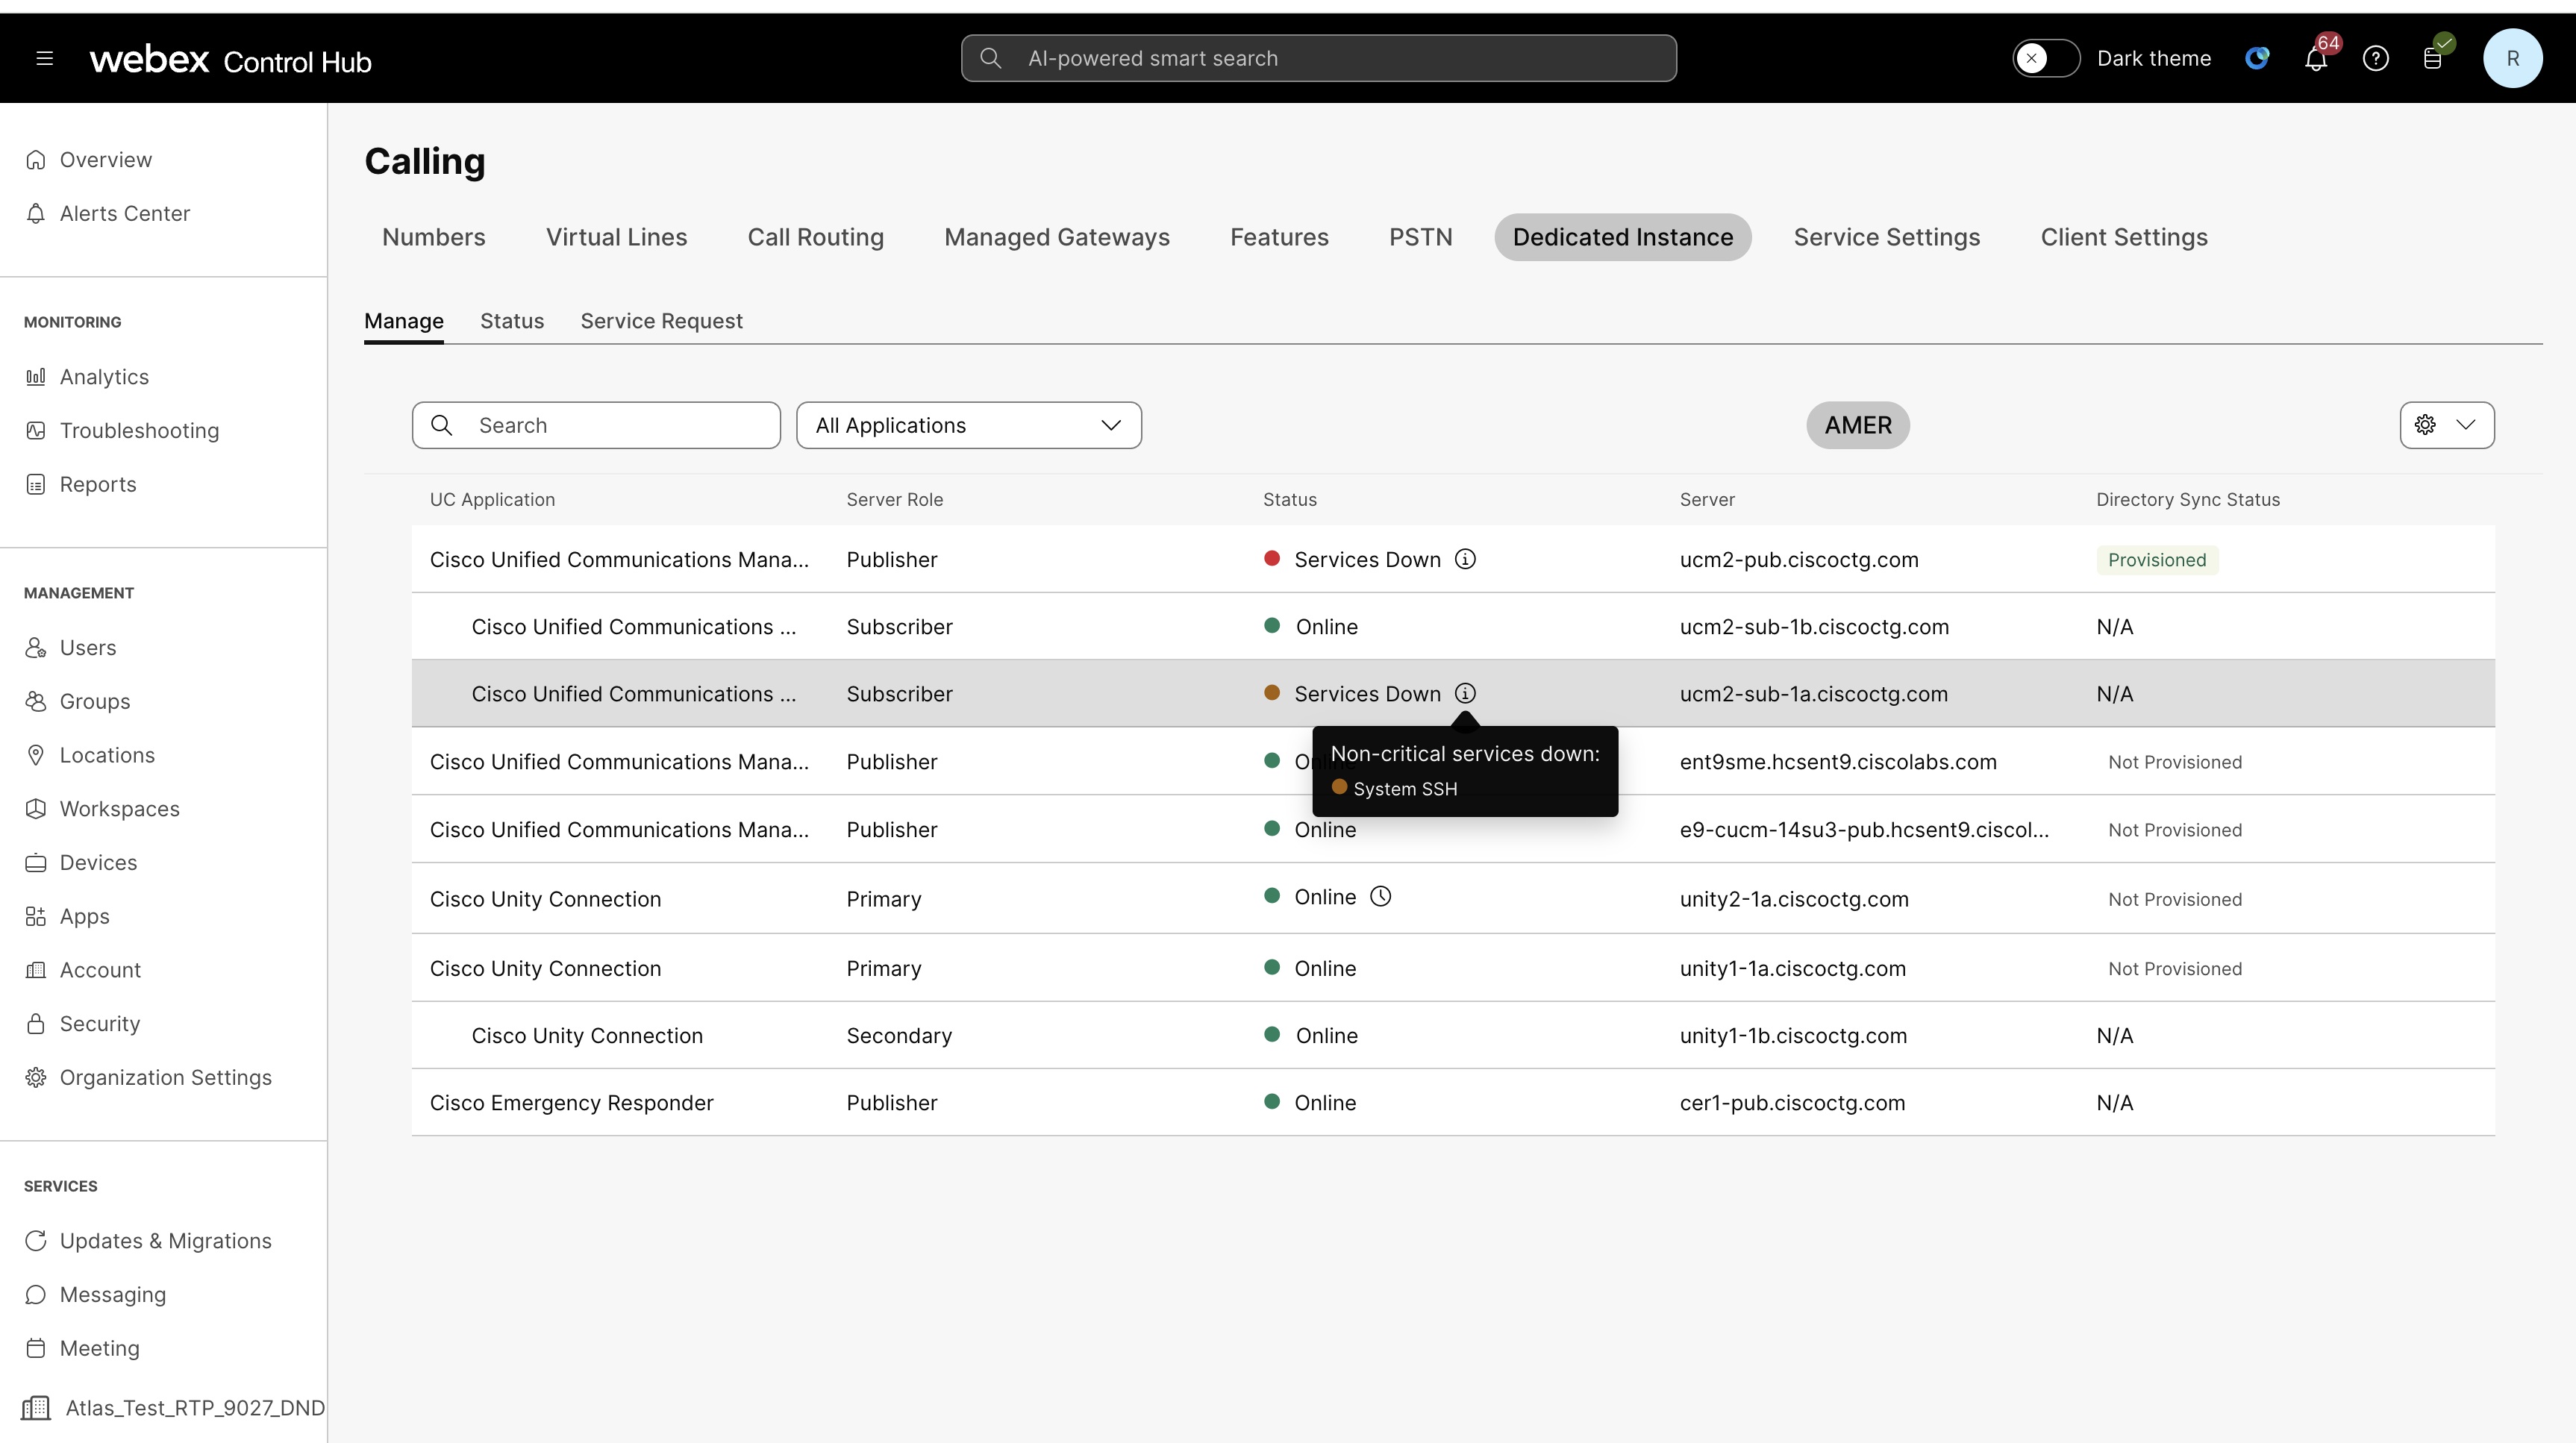
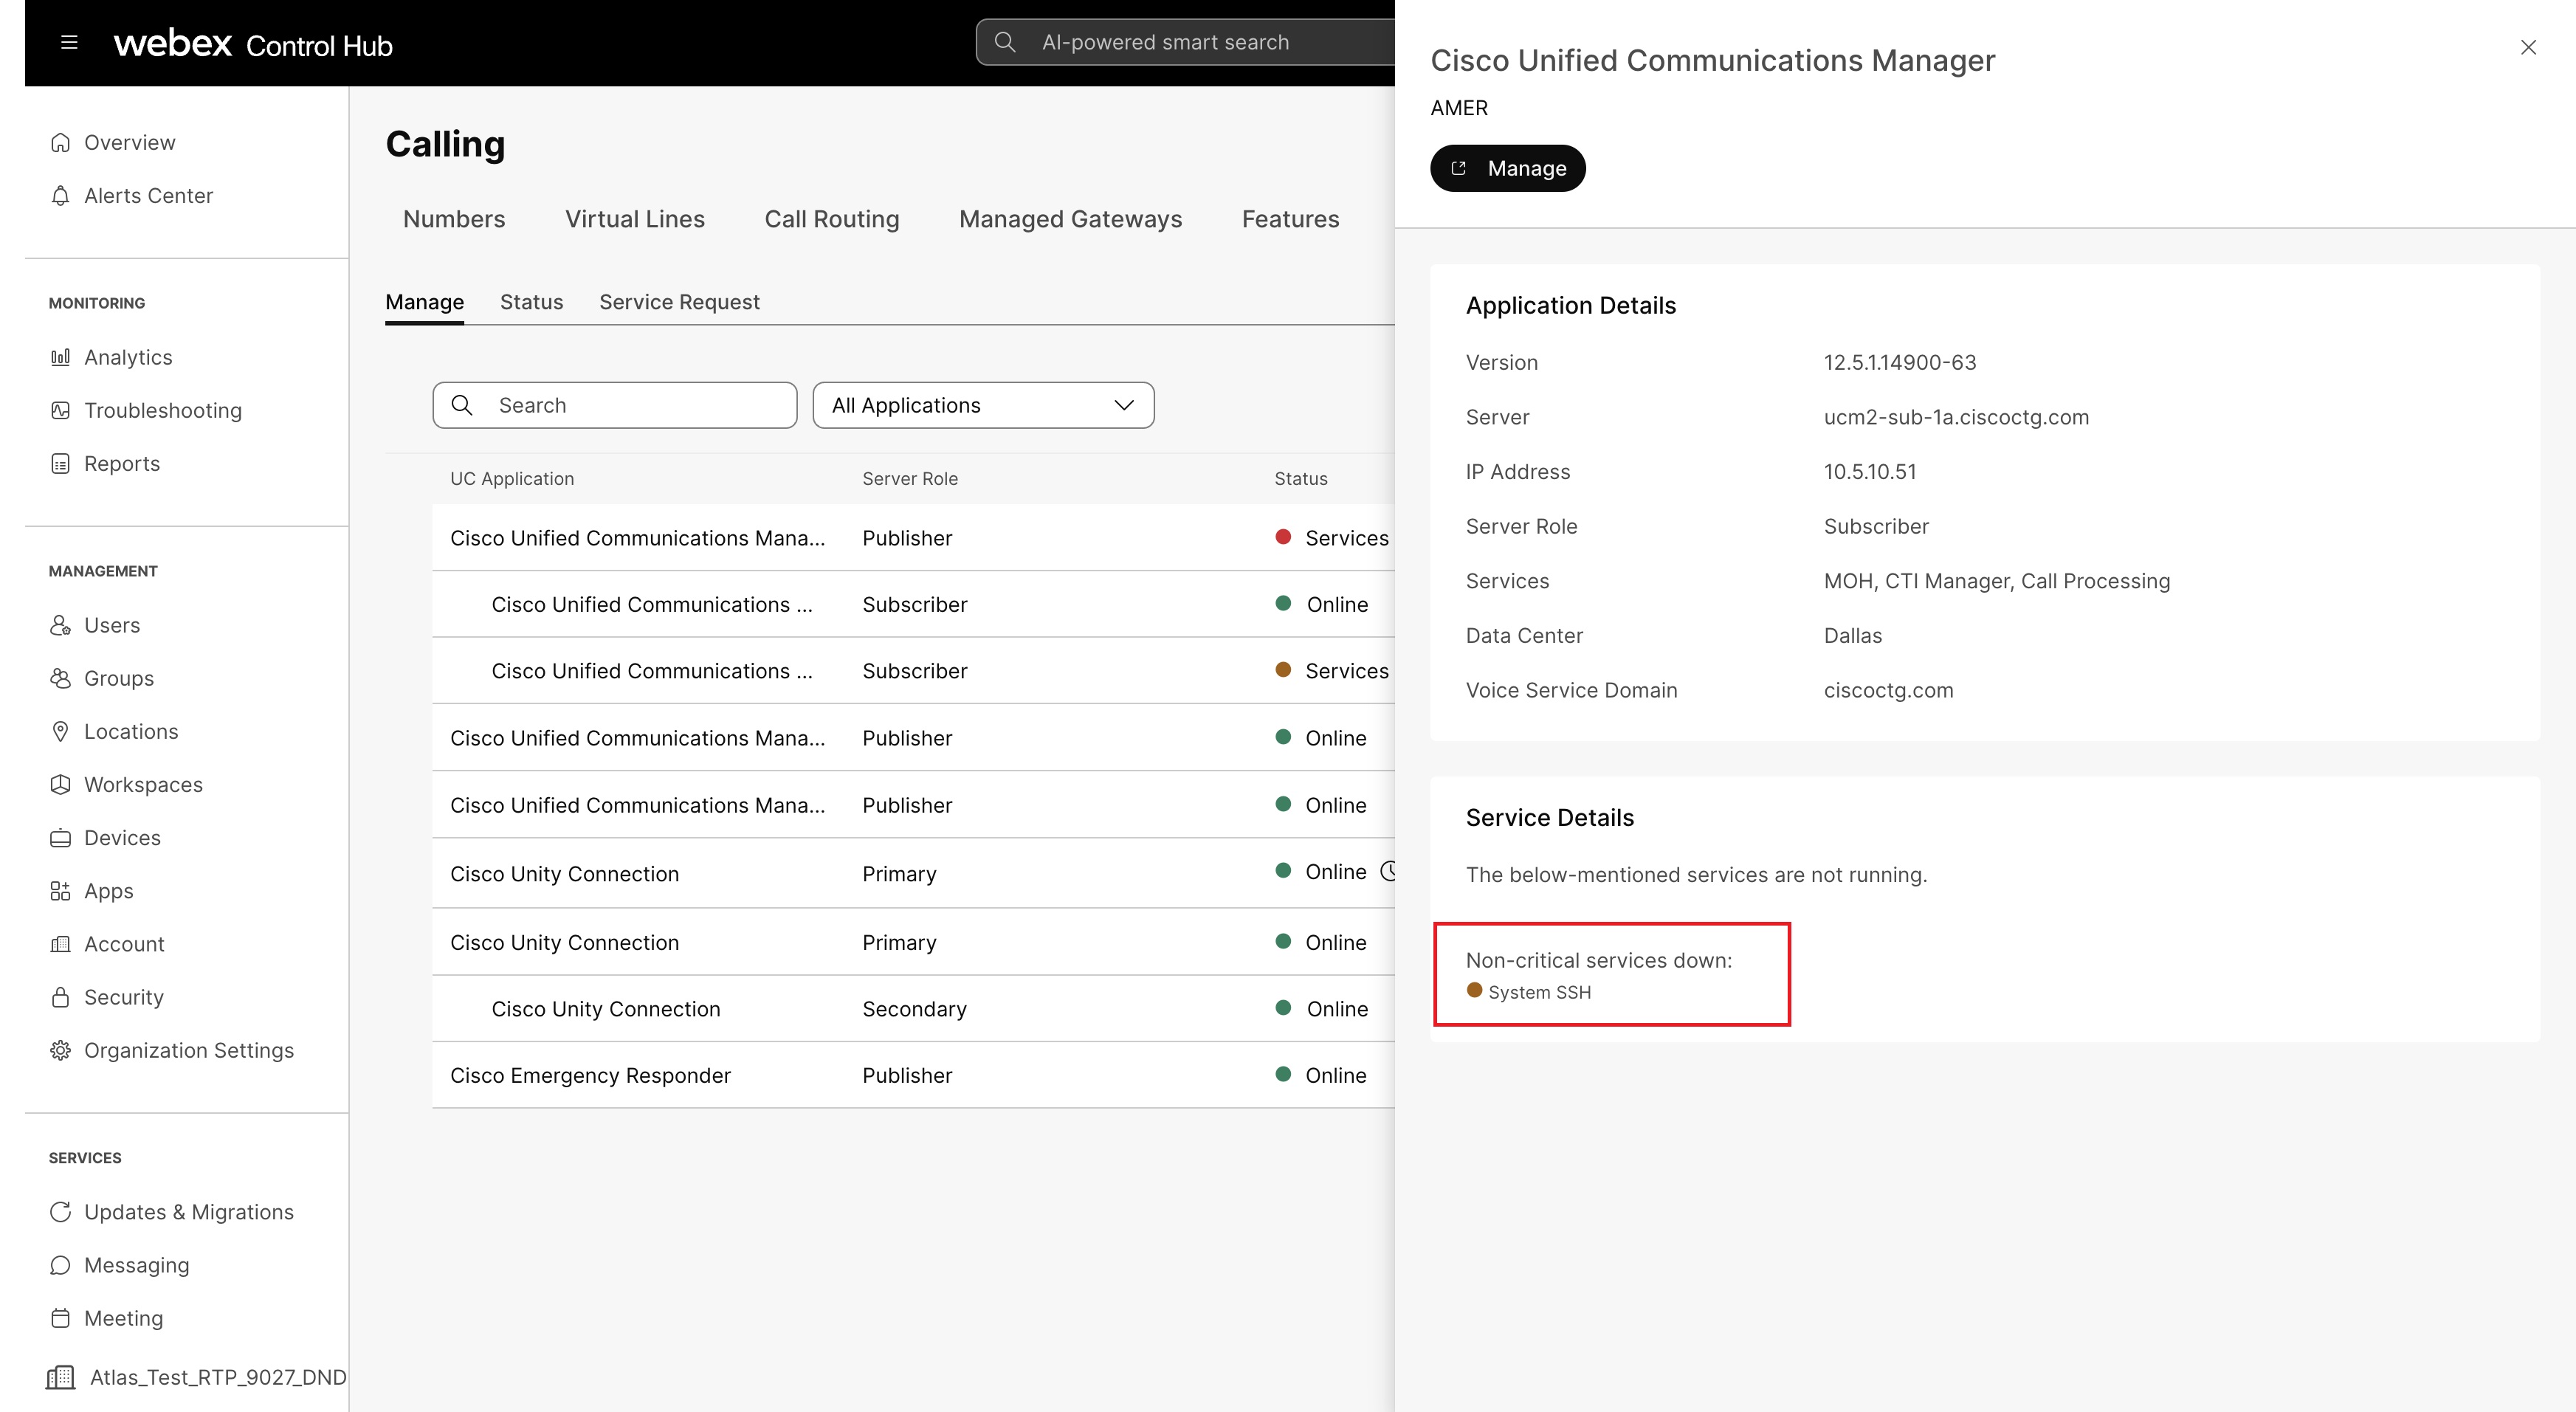
Alert status and their legends
Control Hub consolidates the statuses of multiple UC application services, agent statuses, and the maintenance status of each node.
Services status for each node is refreshed every 30 seconds.
|
Critical alerts |
|
|
|
|
Non-critical alerts |
|
|
All other UC services which is not listed above are considered as non-critical services. |
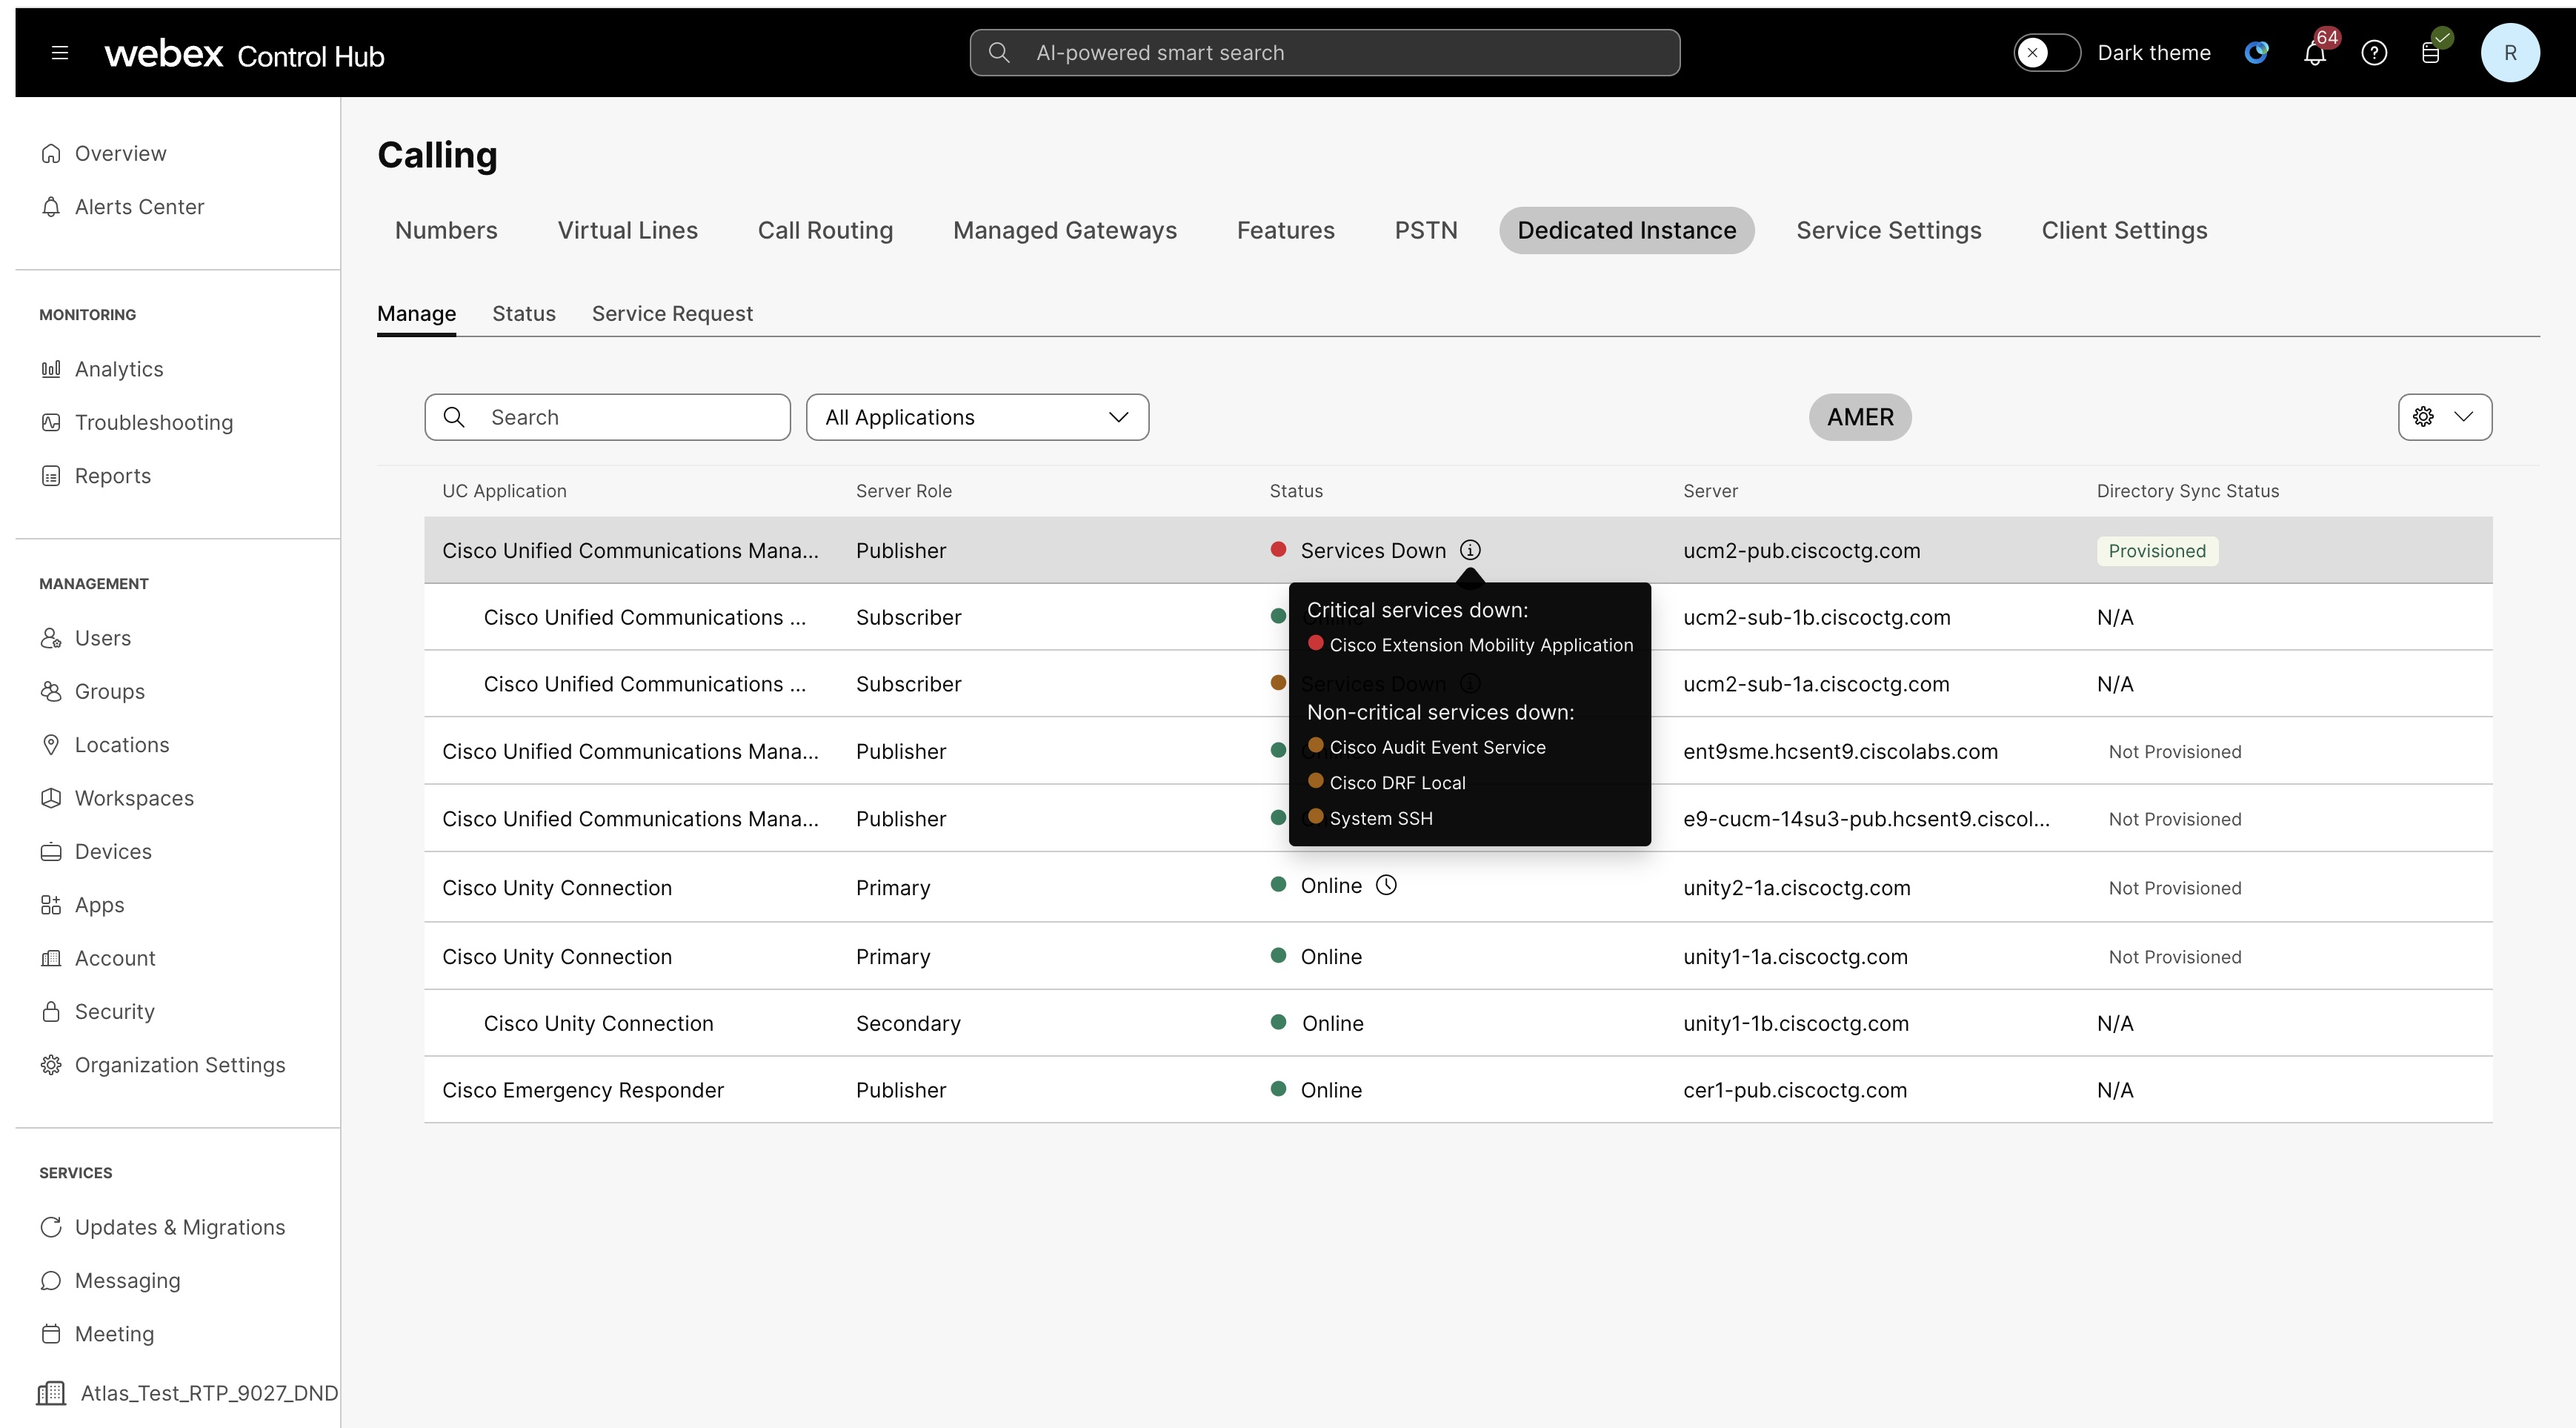
Alert legends
| Status | Color | Description |
| Online | Green | Indicates the node is functioning normally without any issues |
| Maintenance | Orange | Indicates the node is undergoing a maintenance |
| Services Down | Red | Indicates one or more critical services are down on the node |
| Services Down | Orange | Indicates one or more non-critical services are down on the node, or the agent is offline |
Certificate expiry alert
Control Hub sends certificate expiry alerts to customers 67 days before the expiration date and then every 12 days, until the certificate is renewed.
- Customer owned and managed certificates - A proactive alert is sent from Control Hub, and you’re responsible for renewing and managing the certificate.
- Cisco owned and managed certificates - A proactive alert is sent from Control Hub, and we’re responsible for renewing and managing the certificate.
Set up a proactive alert to receive a notification when a certificate expires.
Control Hub application status alarm definitions
For a list of available alarm definitions for Dedicated Instance, see Control Hub application status alarm definitions.
For devices, you can create rules to get alerts for:
- Offline and online events—An event is registered after a device has been offline for 10 minutes or has come back online 10 minutes ago. You can create up to 100 of these alerts.
- Issues that are detected or resolved events—You can select if you want to receive all alerts or mute the ones that you don't wish to receive. You can create up to 100 of these alerts.
- Software version expiry—An alert is sent out 14 days and 3 days before the software version expires for the device. You can create up to 10 of these alerts
See this article for more details on how to set up alerts for devices in your organization.
Alerts of PhoneOS Phones on Control Hub
As the administrator, you can check the status of phones that are registered to Webex Calling. If any issue occurs on the phone, you can see the details in the Issues & Information section under the Devices for diagnostics and troubleshooting.
Also, you can view all alerts that are reported by the phone in Notifications. For more information about Notifications, see Notifications in Control Hub.
Call protocol
| DisplayName | Code | Type | Message | Level |
|---|---|---|---|---|
| Limited service | wxclimitedservice | Limited service | SRST mode - this phone has limited service.
The message can also display on the phone screen. | Warning |
| Sip profile registration | SIPProfileRegistration | SIP registration failed | SIP registration failed | Error |
Network
| DisplayName | Code | Type | Message | Level |
|---|---|---|---|---|
| Packet loss detected | networkquality | Packet loss detected | During the last call we detected a level of packet loss that may have impacted the call quality. Packet loss is typically caused by network congestion. | Warning |
Action button
| DisplayName | Code | Type | Message | Level |
|---|---|---|---|---|
| Action button not configured | actionbuttonnotconfig | Action button not configured | The Action button is not configured. Configure it in All Configurations > Phone >Action Button. | Warning |
| Action button emergency service unavailable | emergencyunavailable | Action button emergency service unavailable | It's impossible to access the emergency service since no line is registered. Will fail to use the Action button or dial numbers to access the service. | Warning |
Security
| DisplayName | Code | Type | Message | Level |
|---|---|---|---|---|
| SCEP certificate enrollment failed | scepcertenrollmentfailed | SCEP certificate enrollment failed | SCEP certificate enrollment failed | Error |
Configuration
| DisplayName | Code | Type | Message | Level |
|---|---|---|---|---|
| Failed to apply configuration changes | wxcresyncfailed | Failed to apply configuration changes | The phone failed to apply configuration changes. The configurations may be out of date. | Error |
| Upgrade failed | wxcupgradefailed | Upgrade failed | The phone failed to update the firmware. Check that the device has a working network connection, that DNS is configured and it is not blocked by firewalls or proxies. | Error |
Use Agent Central notifications in Control Hub to review Agentic Apps server and capability changes that may affect access for your organization. Agent Central notifications appear when an enabled public or private Agentic Apps server changes in a way that requires administrator awareness or review.
You must be a Control Hub administrator with access to Notifications to view Agent Central alerts for Agentic Apps and manage the delivery rule for generated alerts.
In Control Hub, Agentic Apps alerts and generated rules appear with the Agent Central name. Search for Agent Central when you filter alerts or rules.
All Agent Central alerts for Agentic Apps appear in Control Hub. High severity blocked alerts can also be delivered by email or to a Webex App space when you configure delivery for the generated rule. Low severity warning alerts appear in Notifications only.
Repeated detection of the same unresolved change doesn't generate duplicate alerts. If the issue is cleared and the server changes again later, Control Hub creates a new alert for the new change.
View Agent Central alerts for Agentic Apps
You must be a Control Hub administrator with access to Notifications.
| 1 |
Sign in to Control Hub. |
| 2 |
Go to Notifications > Alerts. |
| 3 |
Select All alerts to view alerts for your organization, or My alerts to view alerts delivered to you. |
| 4 |
Use search or filters to find Agent Central alerts. |
| 5 |
Select the alert row to view alert details, or select Review server to open the affected Agentic Apps server. |
Agent Central alert types
Agent Central alerts for Agentic Apps tell you whether access can continue with a warning or is blocked until an administrator reviews the change.
| Alert type | Severity | What it means | What to do |
|---|---|---|---|
| Metadata communication warning | Low | The server name, description, or same-domain URL changed, and access can continue until review. | Review the server and re-approve the metadata, or disable the server if you don't trust the change. |
| Metadata communication blocked | High | A server-level change blocks access. This can include a new URL domain, a blocked metadata change, Agent Card security or interface changes, or an invalid server badge. | Review and re-approve the server, follow the server page guidance for badge issues, or disable the server. |
| Capability communication warning | Low | An enabled tool, prompt, resource, or skill changed, and your organization allows access to continue until review. | Review and re-approve the affected capability, or disable it. |
| Capability communication blocked | High | An enabled tool, prompt, resource, or skill changed and your organization doesn't allow access to continue, or an enabled item was removed or renamed. Access to the affected item is blocked. | Review and re-approve the affected capabilities, or disable the affected items. |
If the same refresh detects both warning and blocked capability changes, Control Hub shows one high severity blocked alert with both states listed in the alert details. For example, a blocked alert can include two tools with status Blocked and one prompt with status Warning.
Registered servers don't generate Agent Central alerts until they're approved and enabled for your organization. New tools, prompts, resources, or skills that haven't been enabled for your organization don't trigger Agent Central alerts.
Review and resolve Agent Central alerts
Use Review server from an alert to inspect the affected Agentic Apps server or capability.
| 1 |
Sign in to Control Hub. |
| 2 |
Go to Notifications > Alerts. |
| 3 |
Search for Agent Central. |
| 4 |
Open the alert that you want to review. |
| 5 |
Select Review server. |
| 6 |
Review the affected server metadata, tool, prompt, resource, or skill. |
| 7 |
Choose one of these actions:
|
Control Hub clears the active alert after the issue is corrected, disabled, or re-approved. Manually marking an Alert Center row as resolved doesn't approve metadata, restore a badge, or unblock an affected capability. If the underlying issue is still present, Control Hub may create a new alert when it detects the unresolved change again.
View Agent Central alert rules
Agent Central alert rules for Agentic Apps are automatically generated by Webex and appear under the General service. These generated rules are read-only for rule name, severity, service, and trigger conditions. For high severity blocked rules, you can configure delivery channels and recipients.
| 1 |
Sign in to Control Hub. |
| 2 |
Go to Notifications > Alerts. |
| 3 |
Select All rules. |
| 4 |
Search for Agent Central. |
Configure delivery for high severity Agent Central alerts
High severity blocked alerts can be delivered by email or to a Webex App space. Control Hub always receives the alert, even if you don't add an email or Webex App recipient.
| 1 |
Sign in to Control Hub. |
| 2 |
Go to Notifications > Alerts. |
| 3 |
Select All rules. |
| 4 |
Search for Agent Central. |
| 5 |
Open one of the high severity blocked rules: Agent Central metadata communication blocked or Agent Central capability communication blocked. |
| 6 |
In Delivery channel, select Email and add the email recipients. |
| 7 |
To deliver alerts in a Webex App space, select Webex space and choose the space delivery option. |
| 8 |
Save the rule. |
Notes and limitations for Agent Central notifications
Keep these notes and limitations in mind when you use Agent Central notifications for Agentic Apps.
- Agentic Apps alerts appear with the Agent Central name in Control Hub.
- Low severity warning alerts are Alert Center only.
- High severity blocked alerts can be delivered by email or Webex App space if delivery is configured on the generated rule.
- Registered but not enabled servers don't generate Agent Central alerts.
- New upstream capabilities that haven't been enabled for your organization don't trigger Agent Central alerts.
- Repeated detection of the same unresolved change doesn't create duplicate alerts.
- Public server alerts are scoped to each affected enabled organization.
- Private server alerts are scoped to the owning organization after the server is approved and enabled.
- When a server-level metadata issue blocks access, Control Hub may show the metadata blocked alert instead of separate capability alerts until the server-level issue is resolved.
You can set up a webhook callback URL so that alerts show up in third-party applications. The admin can specify a webhook callback URL in Control Hub. After providing a callback URL, you can select the webhook option as an additional delivery channel in the rules for new or existing alerts. See below for steps on how to configure webhooks.
Here's an example of what the JSON element for an alert webhook looks like:
{
"orgId": "1ab23cde-4567-890f-1234-gh56ijk07l891",
"title": "title",
"summary" : "notification for a test alert",
"actionUrl" : "www.actionURL.com",
"severity" : "HIGH",
"eventType" : "created",
"resourceType": "ControlHubAlerts",
"type": "Meeting",
"subtype": "Live Meeting Monitoring",
}
Set up a webhook callback URL
You must first add a webhook callback URL before you can enable rules to use webhooks.
| 1 |
Sign in to Control Hub and go to Organization Settings. |
| 2 |
Scroll to the Webhook configuration section. |
| 3 |
Toggle the Configure the webhook URL switch to on. A pop-up window appears. |
| 4 |
Enter the webhook URL that you want to use. You can also choose to add a secret token for the webhook. View this blog to learn more about secret tokens. 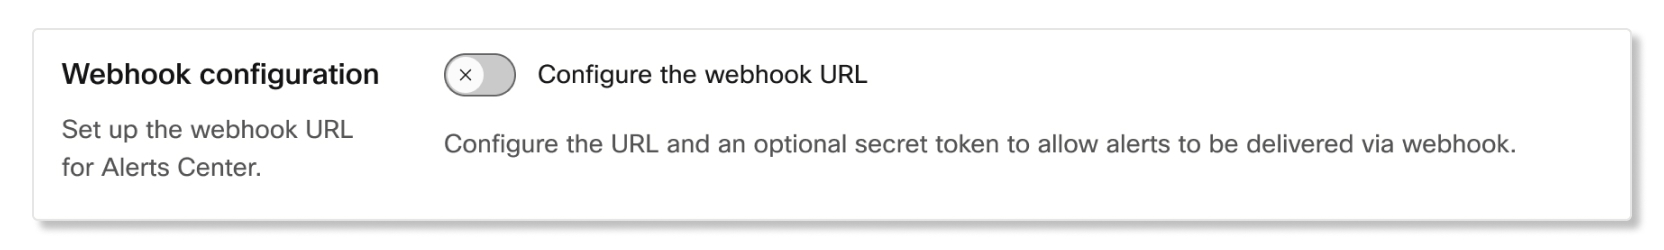
|
| 5 |
Select Validate. If validation fails, check to make sure the webhook URL and secret token are correct. Click Try again once you've finished checking. |
| 6 |
Select Save. |
Enable webhook in a rule
After setting up a webhook URL, you can set up rules to use webhooks as a delivery channel.
| 1 |
Sign in to Control Hub and go to Notifications > My rules. |
| 2 |
In the All rules tab, select a rule. |
| 3 |
In the Delivery Method section, check the Webhook checkbox. Based on the type of alert you're creating, a payload example is shown so that you can know what to expect. 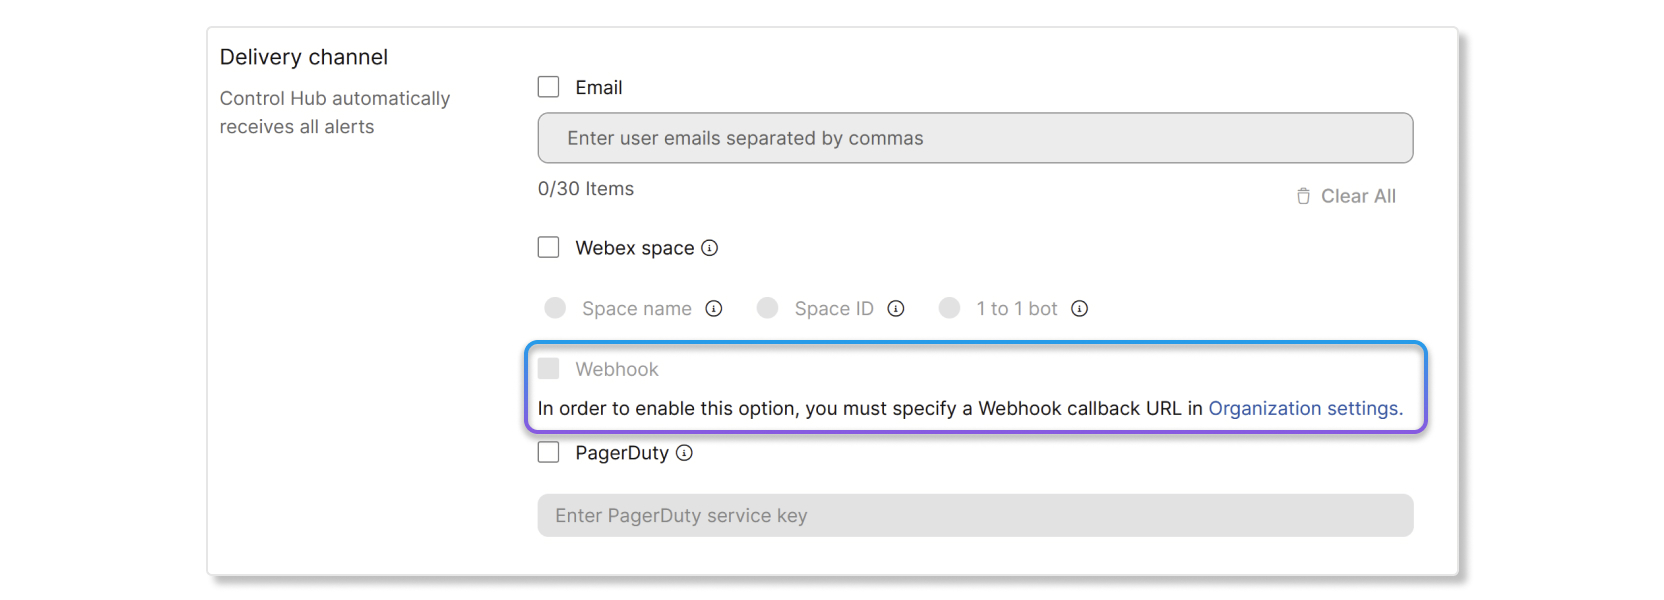
|
| 4 |
Click Save. |
Cisco devices webhook field reference
For information on webhook field references for Cisco devices, see this article.
You can set up a PagerDuty integration key so that alerts show up in third-party applications.
Enable PagerDuty in a rule
Before you begin
You must first get an integration key in PagerDuty before you can enable the PagerDuty setting for alerts in Control Hub. To get an integration key, create a new service in PagerDuty and select Events API V2 as the integration. Once you create an Events API V2 service, you can find the integration key in the Integrations tab of the PagerDuty dashboard.
| 1 |
Sign in to Control Hub and go to Notifications > My rules. |
| 2 |
In the Delivery channel section, check the PagerDuty checkbox. |
| 3 |
Enter the integration key that you created in the PagerDuty dashboard. |
| 4 |
Click Save. |


