- ホーム
- /
- 投稿記事

コメントありがとうございます。

AI Assistant が Analyzer にレポートされます
 この記事の内容
 フィードバックがある場合
AI Assistant ダッシュボードを使用すると、組織内の AI Assistant 機能を監視および評価することができ、その使用状況と運用への影響を理解するための有益なデータと分析が提供されます。
AI Assistant ダッシュボードとレポートにアクセスする
アナライザにアクセスするには、スーパーバイザまたは管理者の権限が必要です。
| 1 |
管理者から提供された URL を使用して Analyzer にログインします。 |
| 2 |
AI Assistant レポートを表示するには、次のいずれかのオプションを選択します。
現在、AI Assistant ダッシュボードとレポートは Analyzer ベータ版では利用できません。 |
 (ツリー)アイコン。
  (省略記号)ボタンをクリックして
 AI Assistant ダッシュボード
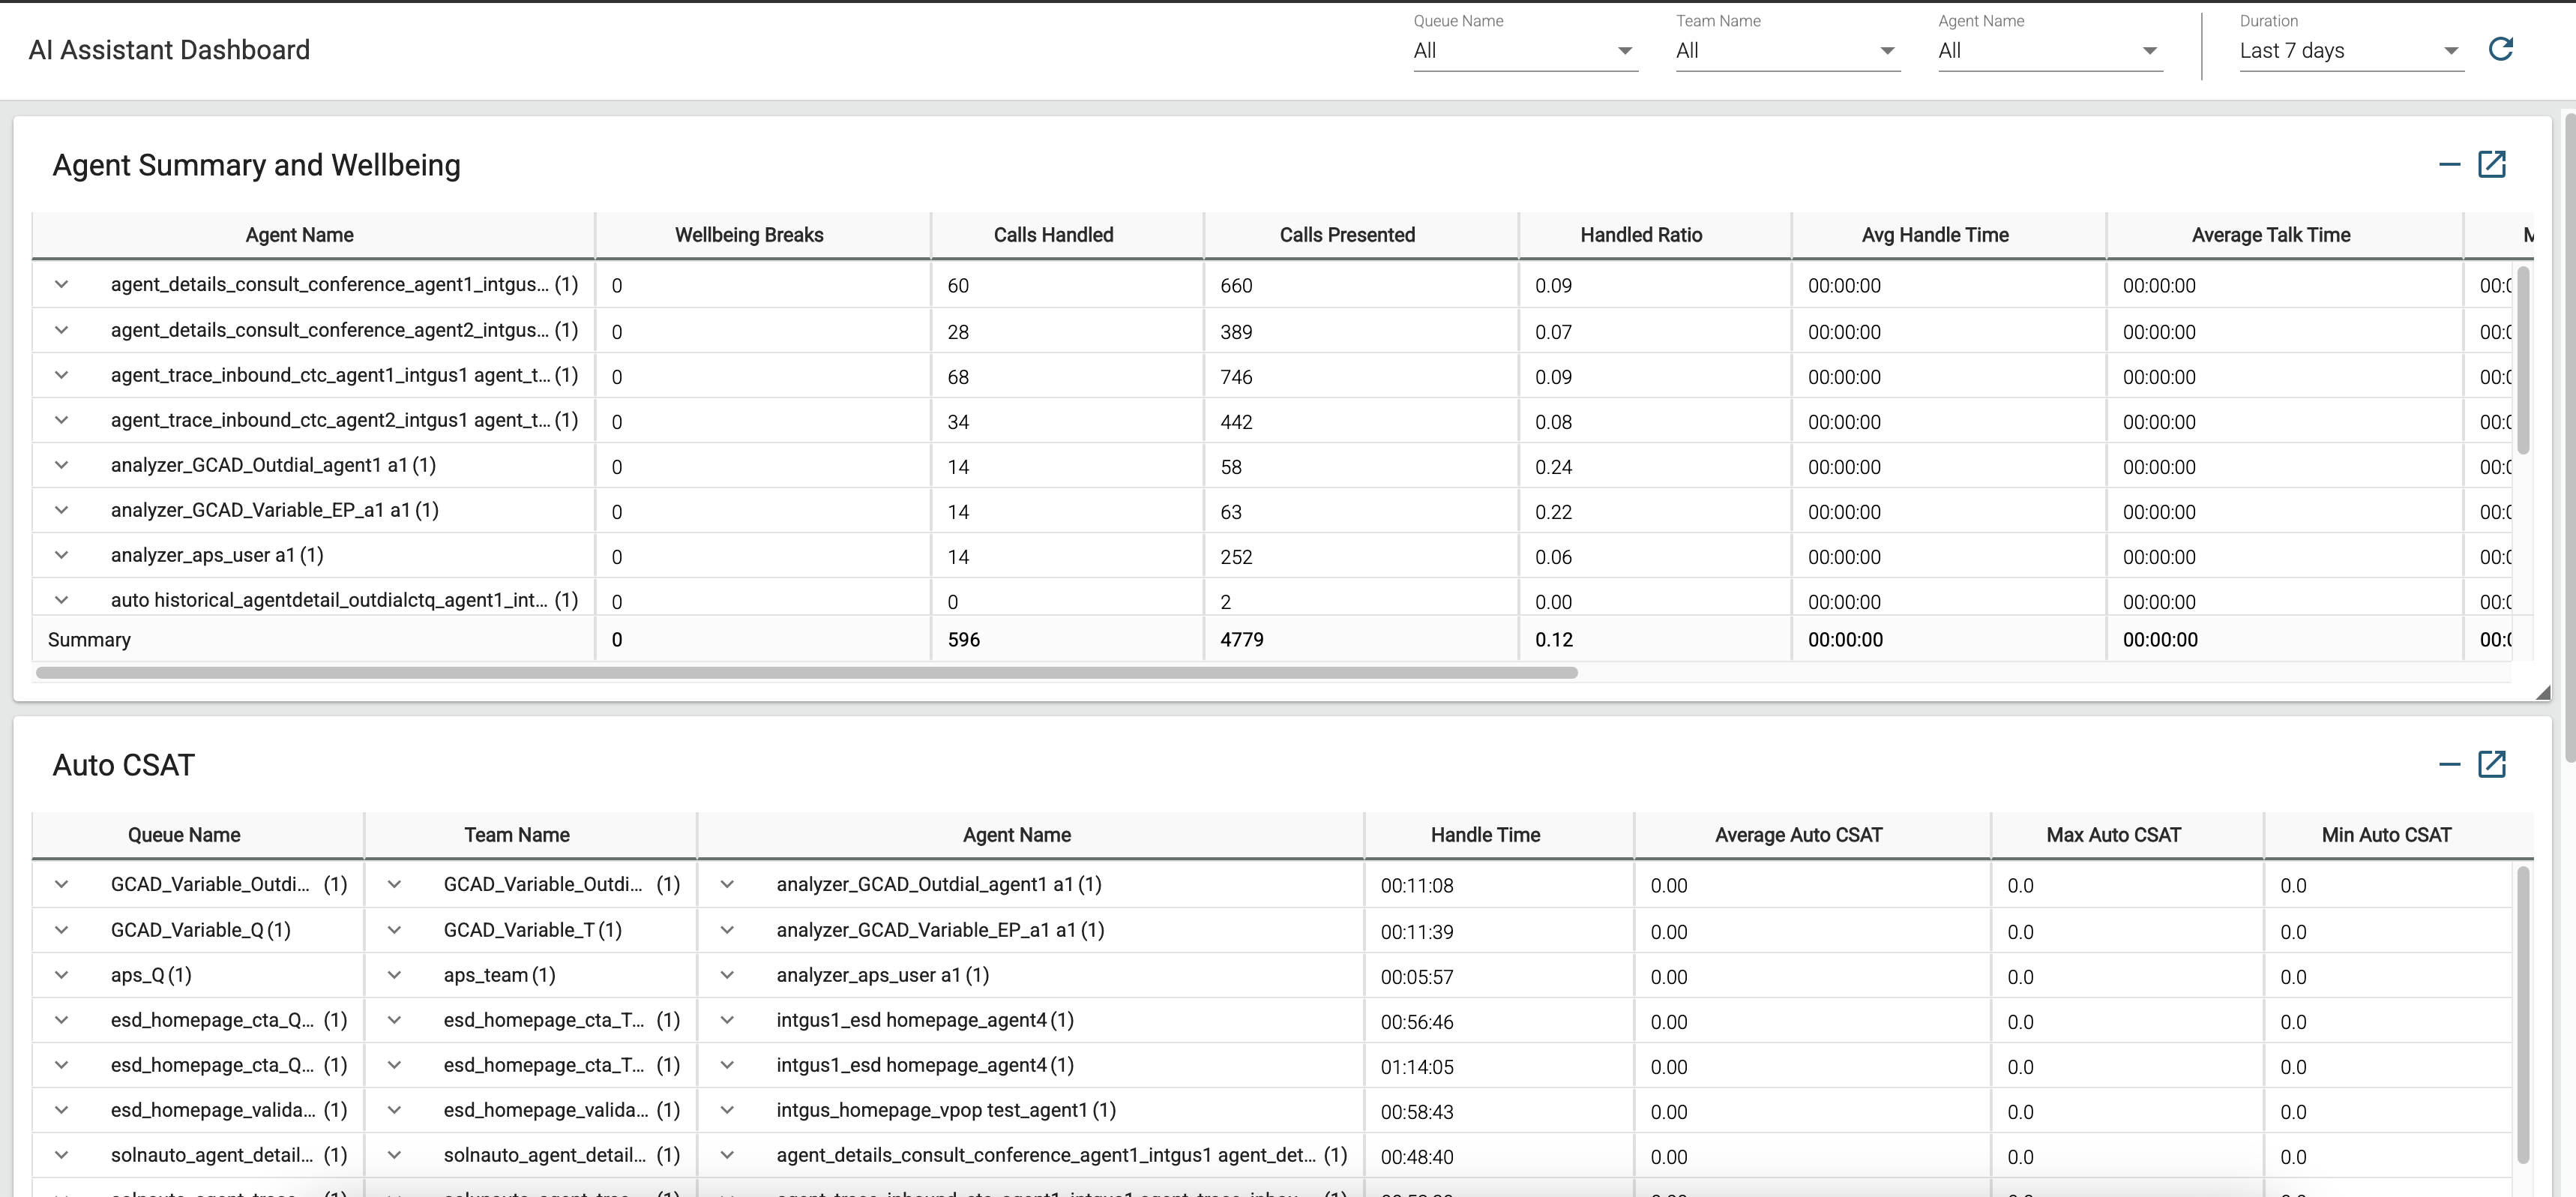
AI Assistant ダッシュボードを使用すると、組織内に実装されている AI Assistant のさまざまな機能を監視および評価できます。 このダッシュボードは洞察に富んだデータと分析を提供し、AI Assistant の使用範囲とそれが業務に与える影響を理解するのに役立ちます。
これには次のレポートが含まれます。
- エージェント ウェルネス休憩レポートは、エージェントに提供されるウェルネス休憩に関する分析情報を提供します。
- 自動 CSAT レポートは、CSAT の傾向に関する洞察を提供します。
- 切断された通話の概要レポートは、切断された通話に関する分析情報を提供します。
- エージェント概要レポートは、エージェントのワークロードとパフォーマンスに関する分析情報を提供します。
- リアルタイム文字起こしレポートは、コンタクト センター エージェントによるリアルタイム文字起こしの使用状況に関する分析情報を提供します。
- トピック分析のトレンド トピックとトピック サマリー レポートは、コンタクト センターの主要なコンタクト ドライバーに関する分析情報を提供します。
- リアルタイムアシスト KPI レポートは、コンタクトセンターのエージェントがコンタクトセンターでリアルタイムアシストをどのように活用しているかについての洞察を提供します。
レポートパス:ダッシュボード > ストックレポート > 履歴レポート > エージェントレポート
出力タイプ:表
AI Assistant ダッシュボードとレポートは、組織に AI Assistant アドオンがプロビジョニングされている場合にのみ表示されます。
エージェントウェルネスブレイク
このレポートは、エージェントに提供されたウェルネス休憩の数に関する包括的な分析情報を提供します。 組織内のウェルネス機能の有効性を評価するのに役立ちます。
このレポートを使用して、エージェントの健康と顧客満足度を効果的に追跡、分析、最適化します。
エージェント ウェルネス休憩レポートによって提供される主な洞察は次のとおりです。
- ウェルネス休憩 - 特定の期間中にエージェントは何回ウェルネス休憩を取得しましたか?
- 顧客満足度 - ウェルネス機能は顧客満足度にどのような影響を与えましたか? また、CSAT スコアは時間の経過とともにどのように変化しましたか?
- 比較分析 - エージェント概要メトリックは、この機能が有効になっていないエージェントのメトリックとどのように比較されますか?
詳細については、 燃え尽き症候群の検出と健康休憩により、エージェントの健康とパフォーマンスを向上 記事。
レポートパス:ストックレポート > 移行レポート
エージェントの概要と健康レポートには、エージェントごとに 1 行が含まれます。 各行には、エージェントのアクティビティの概要が表示されます。
出力タイプ:表
表で使用可能なパラメータ:
|
パラメータ |
Description | 数式 |
|---|---|---|
|
エージェント名(Agent Name) |
エージェントの名前。 使用される形式:行セグメント |
|
| ウェルネスブレイク |
AI を活用したエージェントの燃え尽き症候群検出計算からの洞察に基づいて、エージェントに提供される自動ウェルビーイング休憩の数。 |
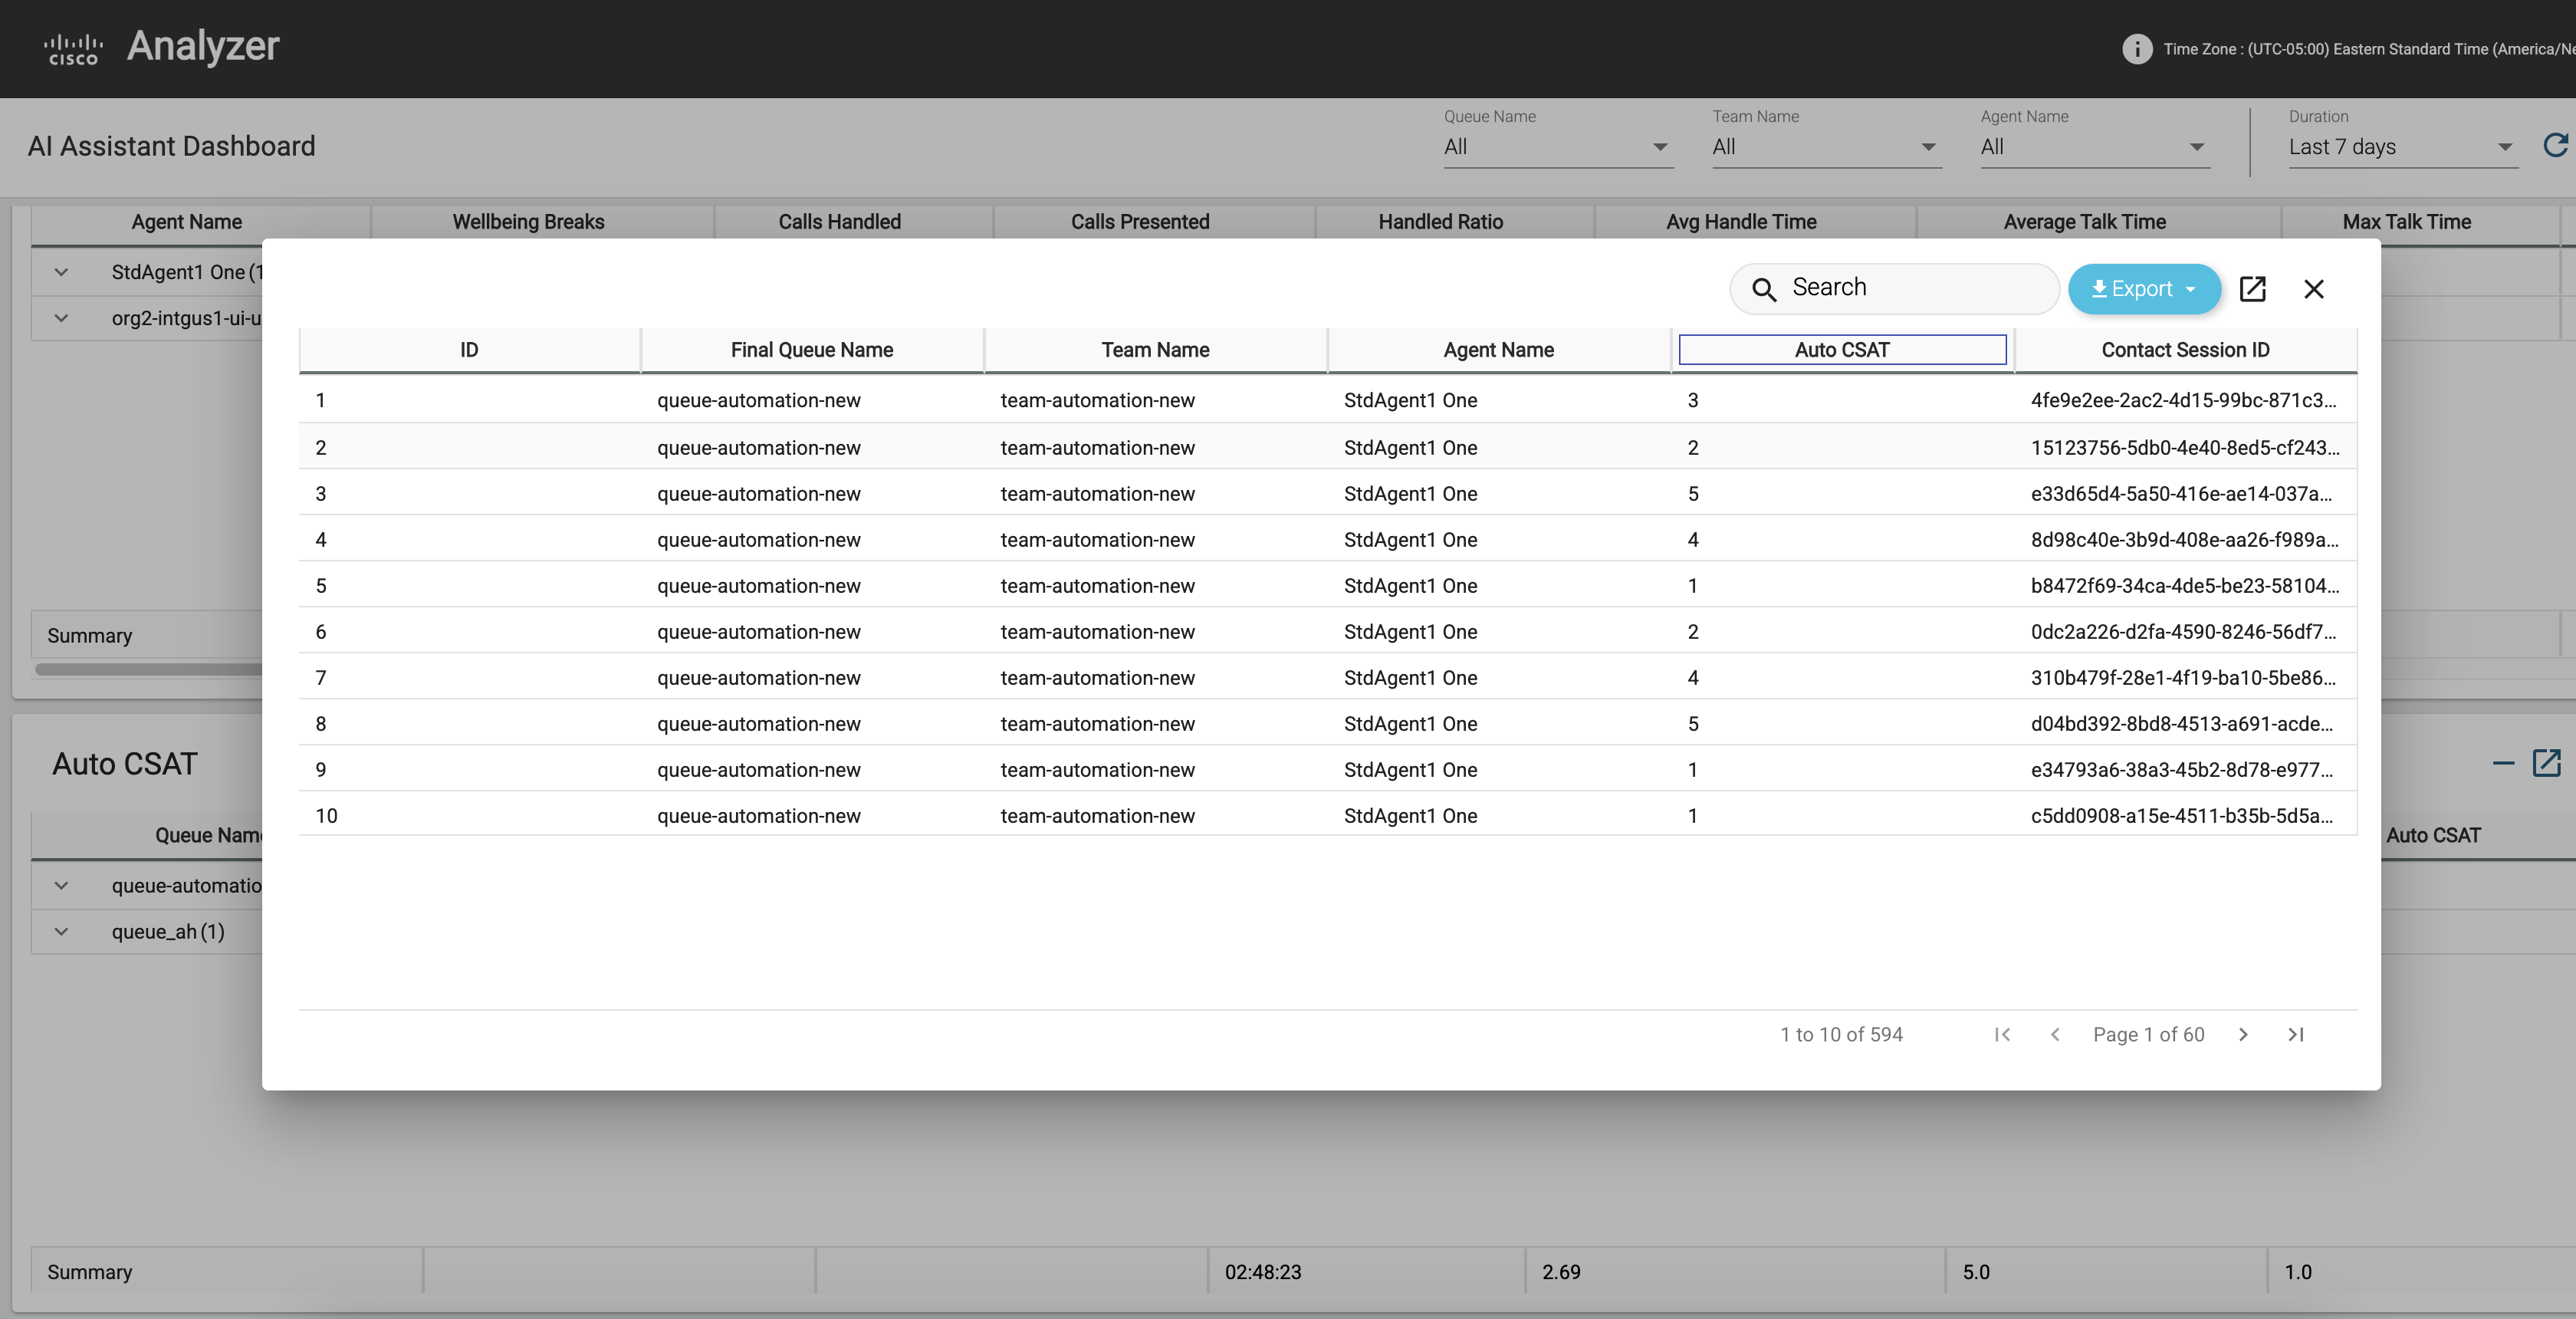
自動車 CSAT
このレポートは監視に役立ちます 顧客満足度(CSAT) トレンドを分析し、ウェルネス休憩がエージェントの健康とパフォーマンスにどのような影響を与えているかを評価し、それが顧客満足度にどのように影響するかを把握できるようにします。
自動車 CSAT レポートによって提供される主な洞察は次のとおりです。
- エージェント レベルの分析情報 - 特定のエージェントが処理したインタラクションの自動 CSAT スコアはどれくらいですか。また、そのエージェントの平均、最小、最大の傾向はどうですか。
- チームレベルのインサイト - 特定のチームが処理したインタラクションの自動 CSAT スコアと、そのチームの平均、最小、最大の傾向は何か
- キュー レベルの分析情報 — 特定のキュー内のインタラクションの自動 CSAT スコアと、そのキューの平均、最小、最大の傾向はどのようなものでしょうか。
- 比較分析 - さまざまなエージェント、チーム、キュー間で CSAT スコアをどのように比較しますか?
- 改善領域 - エージェントのパフォーマンスを向上させるためにコーチングとトレーニングが必要な領域はどこですか?
- インタラクション監査 — どのインタラクションにさらなる監査や顧客のフォローアップが必要ですか?
- 運用の改善 — 運用またはプロセスの改善が必要な領域はどれですか?
詳細については、 Auto CSAT で顧客満足度を測定 記事。
自動 CSAT レポートには、エージェントごとに 1 行が含まれます。 各行には、エージェントのアクティビティの概要が表示されます。
レポートパス:ストックレポート > 履歴レポート > エージェントレポート
出力タイプ:表
表で使用可能なパラメータ:
|
パラメータ |
Description | 数式 |
|---|---|---|
|
エージェント名(Agent Name) |
エージェントの名前。 使用される形式:行セグメント |
|
| キュー名 | キューの名前。 通話はエントリ ポイントからキューに移動し、その後エージェントにリダイレクトされます。 | キュー名 |
| チーム名(Team Name) |
チームの名前。 使用される形式:行セグメント |
|
| 平均自動車 CSAT |
AI が生成した自動顧客満足度予測スコアの平均 |
|
| マックスオート CSAT |
予測される最高の自動顧客満足度スコア |
|
| 最小自動車 CSAT |
予測される自動顧客満足度スコアの最低値 |
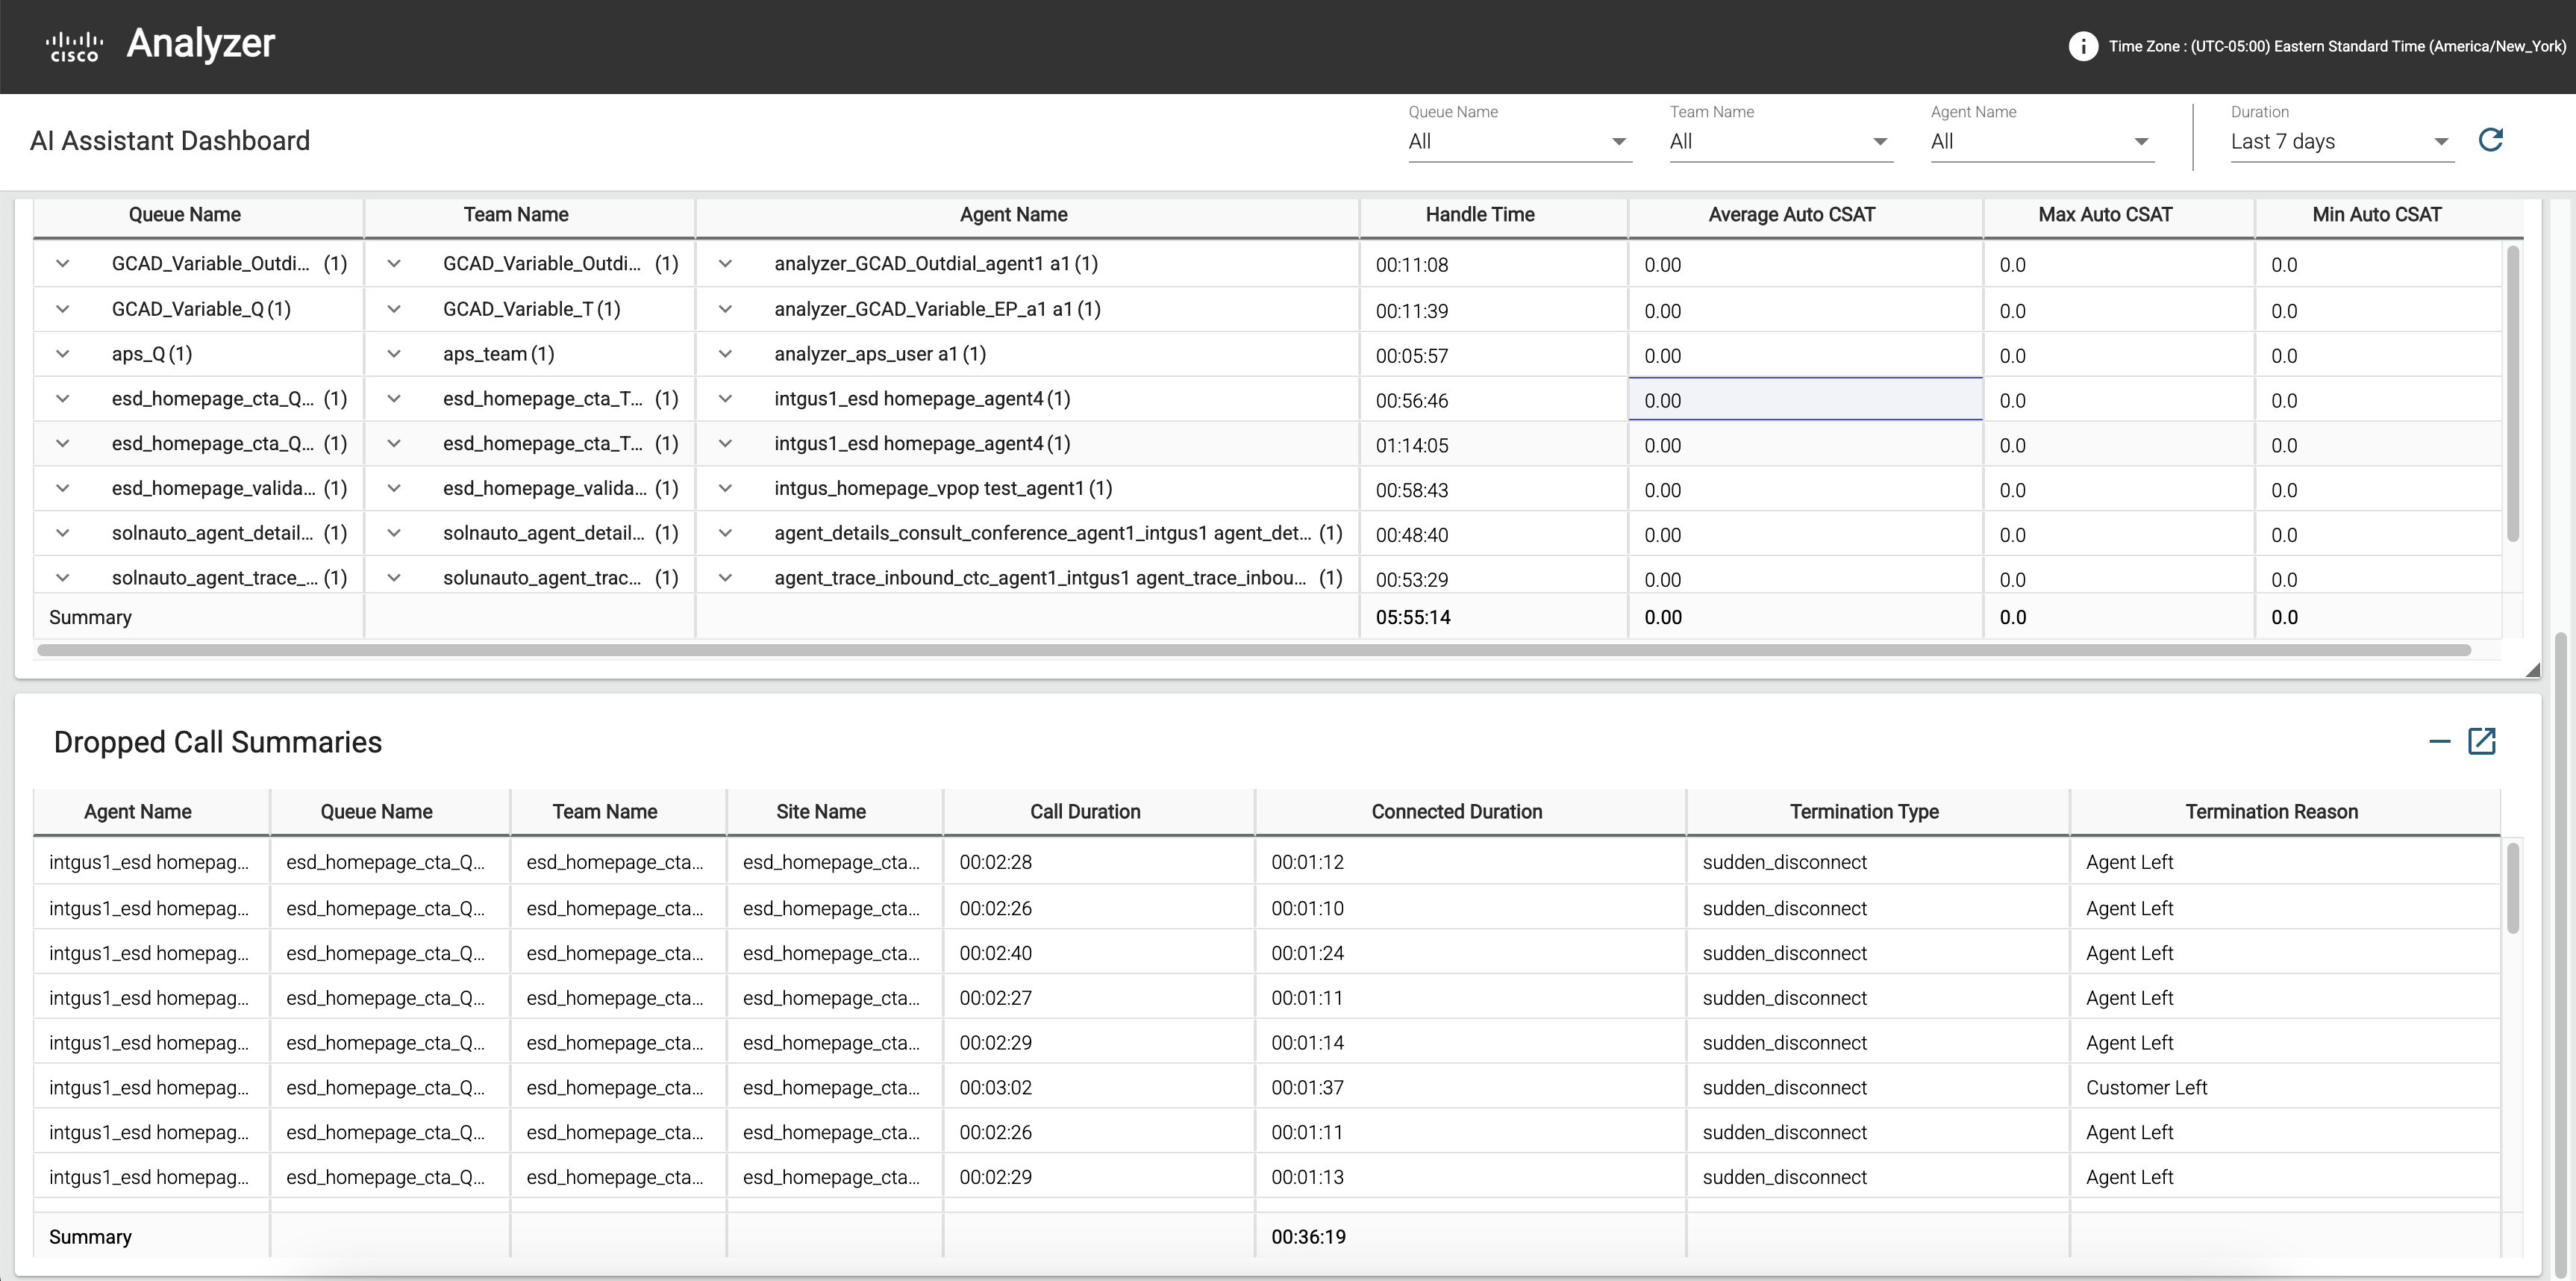
切断された通話の概要
このレポートは、ドロップされた通話に関する分析情報を提供し、ドロップされた通話の概要の重要性を評価します。
合計通話時間とは、正常に終了しなかった通話に顧客が費やした時間(分)です。 組織で通話ドロップ サマリーが有効になっていて、これらの顧客が折り返し電話をかけた場合、通話処理時間から短縮できる時間です。
切断された通話は、終了タイプが放棄、突然の切断、または転送エラー、あるいは終了理由がシステム エラーまたはキュー タイムアウトである通話として分類されます。
切断された通話の概要レポートによって提供される主な分析情報は次のとおりです。
- 組織へのメリット - コールドロップサマリーを有効にすると、組織にどのようなメリットがありますか? 処理時間の改善の可能性は何でしょうか?
- 通話の合計継続時間を確認します - 正常に終了しなかった通話の合計継続時間はどれくらいですか?
- 通話の種類を識別します - どのような種類の通話が通話ドロップと見なされますか?
- 通話ドロップの数 - 顧客が遭遇している通話ドロップの数はいくつですか?
- 通話切断の原因を特定する - 顧客が経験する通話切断の主な原因は何ですか?
詳細については、 AI 生成の要約を使用して効率を高める 記事。
レポートパス:ストックレポート > 履歴レポート > エージェントレポート
出力タイプ:表
切断された通話の概要レポートには、エージェントごとに 1 行が含まれます。 各行には、エージェントのアクティビティの概要が表示されます。
表で使用可能なパラメータ:
|
パラメータ |
Description | 数式 |
|---|---|---|
|
エージェント名(Agent Name) |
エージェントの名前。 使用される形式:行セグメント |
|
| キュー名 | キューの名前。 通話はエントリ ポイントからキューに移動し、その後エージェントにリダイレクトされます。 | キュー名 |
| チーム名(Team Name) |
チームの名前。 使用される形式:行セグメント |
|
| サイト名 |
通話がリダイレクトされたコール センターの場所です。 使用される形式:行セグメント |
|
| コール時間(Call Duration) |
通話の開始時刻と終了時刻の間の経過時間。 |
|
| 終了タイプ(Termination Type) |
コールの終了方法を指定するテキスト文字列。 |
終了タイプの値 |
| 終了理由 |
連絡先を終了する理由。 理由は、次のいずれかになります。
|
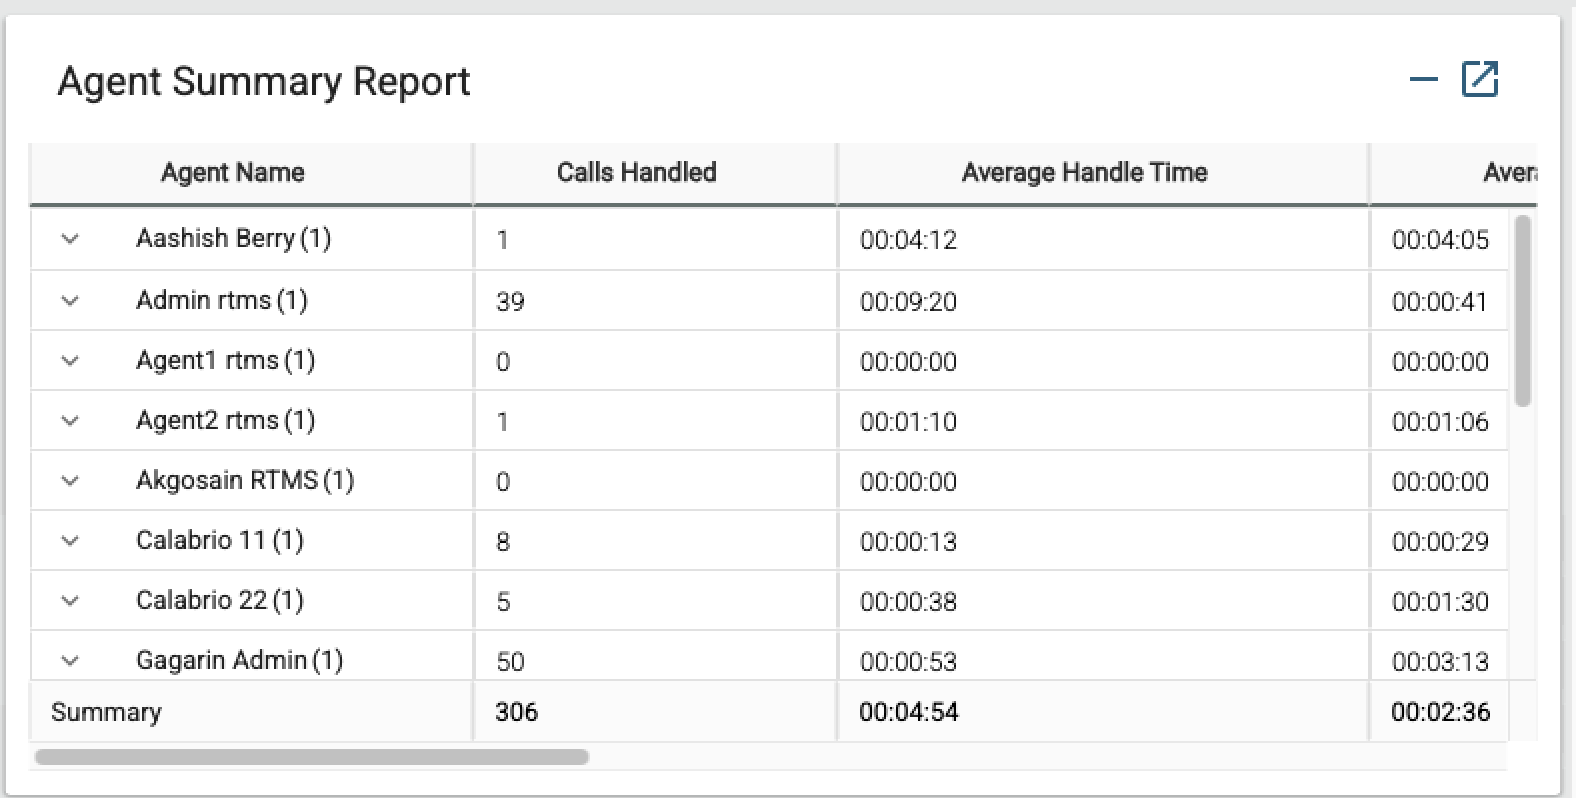
エージェント(要約)レポート
このレポートは、エージェントのワークロードとパフォーマンス メトリックに関する包括的な分析情報を提供します。 組織内のウェルネス機能の有効性を評価するのに役立ちます。
このレポートを使用して、エージェントのパフォーマンスと顧客満足度を効果的に追跡、分析、最適化します。
エージェント概要レポートによって提供される主な分析情報は次のとおりです。
- ワークロードとパフォーマンス - その期間中のエージェントのワークロードとパフォーマンスはどの程度でしたか。また、ウェルネス機能が有効になってからこれらの指標はどのように改善されましたか。
- 顧客満足度 - ウェルネス機能は顧客満足度にどのような影響を与えましたか? また、CSAT スコアは時間の経過とともにどのように変化しましたか?
レポートパス:ストックレポート > 履歴レポート > エージェントレポート
エージェント概要レポートには、エージェントごとに 1 行が含まれます。 各行には、エージェントのアクティビティの概要が表示されます。
出力タイプ:表
表で使用可能なパラメータ:
|
パラメータ |
Description | 数式 |
|---|---|---|
|
エージェント名(Agent Name) |
エージェントの名前。 使用される形式:行セグメント |
|
|
コール処理数(Calls Handled) |
エージェントに接続されたインバウンドコール数。
|
ラップアップコード名のカウント。 |
| 平均処理時間(Average Handle Time) | エージェントが処理したすべてのコールの平均処理時間。 | 合計処理時間/処理コール数 |
| 平均通話時間 | エージェントの通話時間の平均時間。 | 接続時間の平均 |
| 最大通話時間 | エージェントが通話に費やす最大時間。 | |
| 平均保留時間 | エージェントがコールを保留にした平均時間。 |
平均保留時間 |
| 最大保留時間 | エージェントがコールを保留にした最長時間。 | 最長保留期間 |
| 平均作業時間 |
コールの切断または転送後にエージェントが処理された平均時間。 |
ラップアップ継続時間の平均 |
| 最大作業時間 |
コールの切断または転送後にエージェントが処理された最長時間。 |
最長ラップアップ期間 |
リアルタイム文字起こし KPI
このレポートは、コンタクト センター エージェントによるリアルタイム文字起こし機能の使用に関する包括的な分析情報を提供します。 これは、組織が通話中の文字起こしの配信を監視し、エージェントのパフォーマンスと顧客満足度への影響を評価するのに役立ちます。
リアルタイム文字起こしレポートによって提供される主な洞察は次のとおりです。
- 文字起こしの可用性: 各通話中にリアルタイムの文字起こしが利用可能であったかどうかを追跡し、さまざまなキューにわたる使用パターンと可用性を強調表示します。
- 使用状況メトリクス: 文字起こしを使用しているエージェントの数、処理された文字起こしの合計時間 (分)、フィードバック メトリクスの詳細を表示します。この機能がどの程度採用されているか、またその有効性を把握するのに役立ちます。
このレポートは、1 つのレポートと 2 つのカードで構成されています。
- リアルタイム文字起こし KPI
- 通話記録カード付き合計通話
- トランスクリプトカードの平均処理時間
レポートパス:ストックレポート > 履歴レポート > エージェントレポート
リアルタイムの文字起こしレポートには、エージェントごとに 1 行が含まれます。 各行には、エージェントのアクティビティの概要が表示されます。
このレポートには、チャネル タイプが「テレフォニー」であるインタラクションのみが表示されます。
|
パラメータ |
Description |
数式 |
|---|---|---|
| キュー名 | キューの名前を表示します。 通話はエントリ ポイントからキューに移動し、その後エージェントに転送されます。 | キュー名 |
| チーム名(Team Name) | チームの名前を表示します。 使用される形式:行セグメント |
|
| エージェント名(Agent Name) | エージェントの名前を示します。 使用される形式:行セグメント |
|
| 平均 AUTO CSAT(トランスクリプト付き) | リアルタイムの文字起こしが有効になっている場合、AI によって生成された予測自動顧客満足度スコアの平均を表示します。 | |
| トランスクリプト付きの平均まとめ時間 | リアルタイムの文字起こしが有効になっている場合に、処理された連絡先の終了に要した平均時間を表示します。 | |
| トランスクリプト付き通話合計 | リアルタイム文字起こしが有効になっている通話の合計数。 | |
| トランスクリプトの平均処理時間 | リアルタイム文字起こしが有効になっている場合に、エージェントが処理したすべての通話の平均処理時間。 |
トランスクリプト付き通話合計
このレポートには、リアルタイムの文字起こしが利用可能で、チャネル タイプが「テレフォニー」である連絡先の合計数が表示されます。
レポートパス:ストックレポート > 履歴レポート > エージェントレポート
出力タイプ:カード
電話による平均処理時間
このレポートには、リアルタイムの文字起こしが利用可能で、チャネル タイプが「テレフォニー」の場合に、エージェントが処理したすべての通話の平均処理時間が表示されます。
レポートパス:ストックレポート > 履歴レポート > エージェントレポート
出力タイプ:カード
トピック分析レポート
Analyzer のトップトピックとコールドライバーにアクセスすることで、チームはデータに基づいた意思決定を行うことができます。 この洞察により、ユーザは人員配置を最適化し、エージェントのトレーニングを改良し、ルーティング戦略を改善し、自動化を強化できます。
トピック分析レポートでは、次の 2 つの重要な分析情報が提供されます。
- トレンド トピック - 特定のトピックに関連付けられたインタラクションの数が時間の経過とともにどのように変化するかを追跡し、顧客とのコンタクト ドライバーのパターンと傾向を特定します。
- トピック分析の概要 - 各トピックの量、平均処理時間、平均自動 CSAT を表示して、ビジネス上の意思決定を行い、顧客エクスペリエンスを向上させます。
このレポートは次の 2 つのレポートで構成されています。
- トレンドトピック(チャート)
- トピック分析の概要
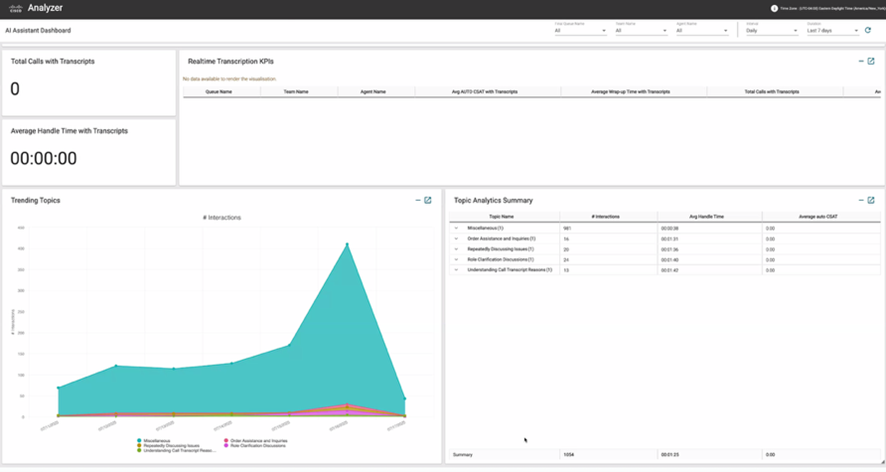
トレンドトピック(チャート)
トレンド トピック チャートには、特定の期間に各トピックがどのくらいの頻度で議論されたか、またはやり取りされたかが表示されます。 時間の経過とともにどのトピックの人気が高まったり下がったりしているかを強調表示することで、新たなトレンドを特定するのに役立ちます。
| パラメータ | Description | 数式 |
|---|---|---|
| トピック名 | 顧客とのやり取りの主な理由を要約した AI 生成のラベル。 トピックは、インタラクション全体にわたる類似のコンタクト ドライバーを意味のあるラベルにクラスター化することによって生成されます。 インタラクションがトピック分析によって分析されるまで、このフィールドには N/A が表示されます。 | |
| #インタラクション | 特定のトピック名でラベル付けされたインタラクションの数。 |
トピック分析の概要
トピック分析集計レポートには、平均処理時間や平均自動 CSAT などの主要なパフォーマンス指標とともに、各トピックの普及状況が表示されます。 このレポートを使用すると、エージェントが特定のトピックに費やした時間を評価し、それらのトピックに関連する顧客満足度を測定できます。
| パラメータ | Description | 数式 |
|---|---|---|
| トピック名 | 顧客とのやり取りの主な理由を要約した AI 生成のラベル。 トピックは、インタラクション全体にわたる類似のコンタクト ドライバーを意味のあるラベルにクラスター化することによって生成されます。 インタラクションがトピック分析によって分析されるまで、このフィールドには N/A が表示されます。 | |
| #インタラクション | 特定のトピック名でラベル付けされたインタラクションの数。 | |
| 平均自動車 CSAT |
AI によって生成された予測自動顧客満足度スコアの平均。 | |
| 平均処理時間(Avg Handle Time) | トピックに一致する通話の平均処理時間。 |
トピック分析を使用してレポートをカスタマイズする
トピック名 そして ドライバーに連絡する Analyzer でカスタム フィールドとして利用できるようになりました。 これらを新規または既存のカスタム レポートに含めることができます。
新しいレポートの場合は、次の手順を実行します。
- Home > Visualization > Create New > Visualization に移動します。
- レポート要件に応じて、 トピック名 および/または ドライバーに連絡する これらのフィールドを行セグメントまたは列セグメントとして追加します。
既存のレポートを検索するには、 トピック名 または ドライバーに連絡する、またはその両方を選択し、これらのフィールドを行セグメントまたは列セグメントとして含めます。
API を使用してトピックデータにアクセスする
顧客セッション リポジトリ (CSR) に 2 つの新しいフィールドが追加されました。これらのフィールドは、検索 API からアクセスできます。 検索 API に関するドキュメントについては、 開発者向けドキュメント。
| パラメータ | Description | 数式 |
|---|---|---|
| トピック名 | 顧客とのやり取りの主な理由を要約した AI 生成のラベル。 トピックは、インタラクション全体にわたる類似のコンタクト ドライバーを意味のあるラベルにクラスター化することによって生成されます。 インタラクションがトピック分析によって分析されるまで、このフィールドには N/A が表示されます。 | |
| ドライバーに連絡する |
連絡の最初の理由を AI が生成した要約。 インタラクションがトピック分析によって分析されるまで、このフィールドには N/A が表示されます。 |
- 既存のトピック データを持つお客様は、古いコレクションで編集ジョブまたはクローン ジョブをトリガーして、そのデータを Analyzer で利用できるようにすることができます。
- インタラクションが複数のコレクションに表示される場合は、最後に割り当てられたトピックのみが表示されます。
- 分析されていないインタラクションの場合、トピック名とコンタクト ドライバー フィールドは「Null」として表示されます。
- 現在、AI Assistant ダッシュボードで株式レポートのコピーを作成することはできません。
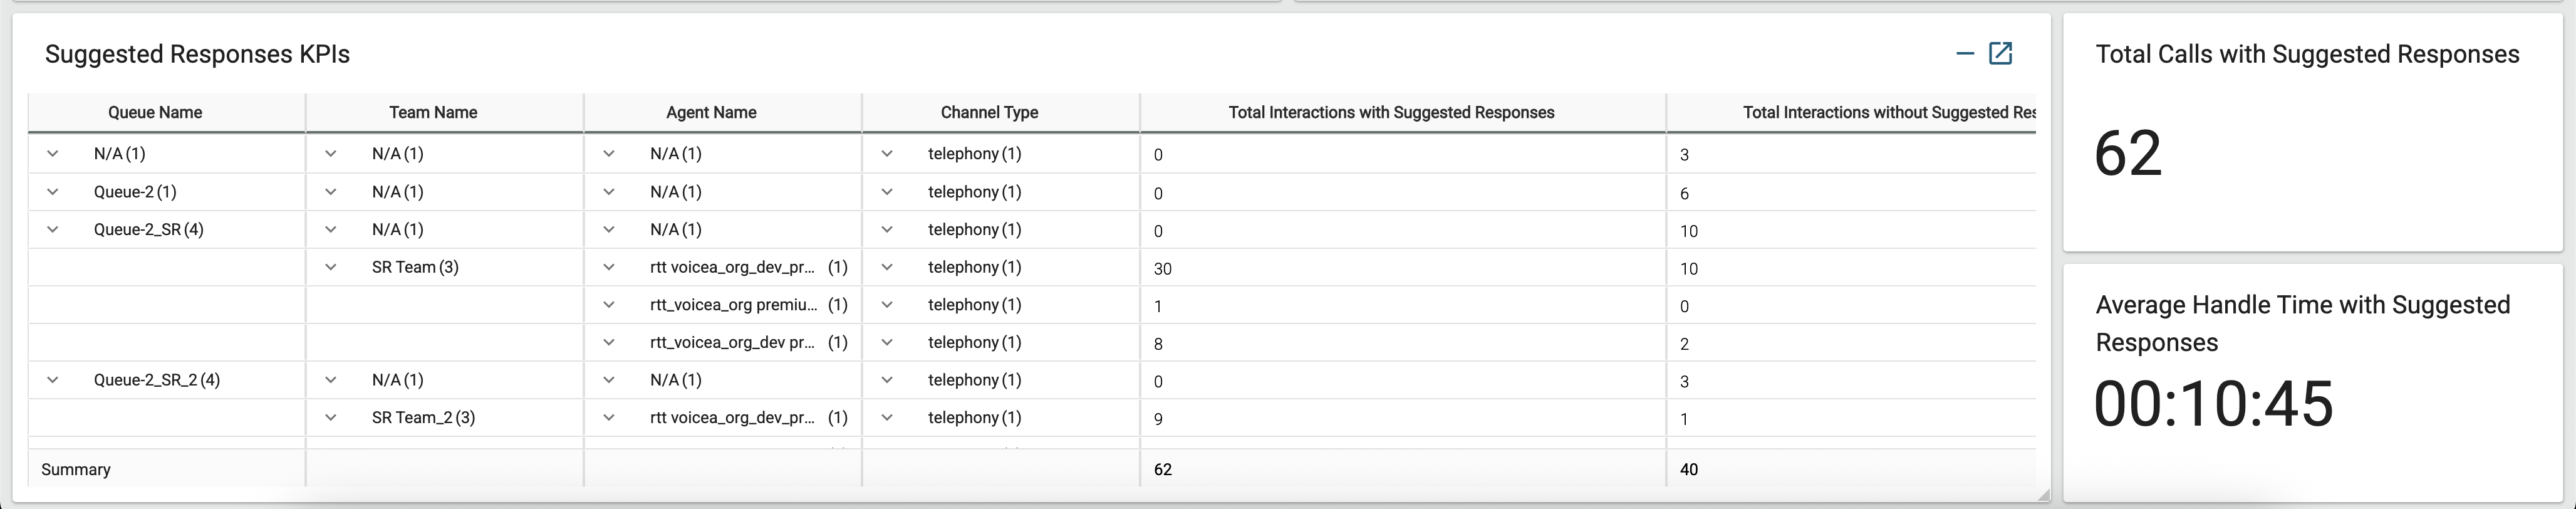
リアルタイムアシスト KPI
本レポートは、コンタクトセンターのエージェントがコンタクトセンター内でリアルタイムアシストをどのように活用しているかについて、包括的な洞察を提供するものです。 これは、組織が通話や顧客対応中にリアルタイム支援がエージェントのパフォーマンスや顧客満足度に与える影響を追跡するのに役立ちます。
リアルタイムアシスト KPI レポートで提供される主な洞察は以下のとおりです。
- リアルタイムアシストの利用可能性: 各インタラクション中のリアルタイムアシストの利用可能性を監視し、さまざまなキュー全体での使用傾向と利用可能性を特定します。
- 利用状況指標:リアルタイムアシストを利用しているエージェントの数を表示し、通話時間、相談率、顧客満足度への影響を分析します。
このレポートは、1 つのレポートと 2 つのカードで構成されています。
- リアルタイムアシスト KPI
- リアルタイムアシストカード付きトータルコール
- リアルタイムアシストカード使用時の平均処理時間
レポートパス:ストックレポート > 履歴レポート > エージェントレポート
リアルタイムアシスト KPI レポートには、エージェントごとに 1 行が含まれています。 各行には、エージェントのアクティビティの概要が表示されます。
|
パラメータ |
Description |
数式 |
|---|---|---|
| キュー名 | キューの名前を表示します。 通話はエントリ ポイントからキューに移動し、その後エージェントに転送されます。 | キュー名 |
| チーム名(Team Name) | チームの名前を表示します。 使用される形式:行セグメント |
|
| エージェント名(Agent Name) | エージェントの名前を示します。 使用される形式:行セグメント |
|
| チャネルタイプ | 音声、電子メール、チャットなど、連絡先のメディアタイプを示します。 使用される形式:行セグメント |
|
| リアルタイムアシストによるインタラクションの総数 | リアルタイムアシストが使用されている際の、その操作の総数を表示します。 | コンタクトセッション ID の数 |
| リアルタイムアシストなしの総インタラクション数 | リアルタイムアシストを使用せずに発生したインタラクションの総数を表示します。 | コンタクトセッション ID の数 |
| リアルタイムアシストによる平均相談件数 | リアルタイムアシストが使用されている際の、操作の総数を表示します。 | 問い合わせカウントの合計 |
| リアルタイム支援なしの場合の平均相談件数 | リアルタイムアシストを使用せずに発生したインタラクションの総数を表示します。 | 問い合わせカウントの合計 |
| リアルタイムアシストによる平均処理時間 | リアルタイムアシスト使用時の平均インタラクション時間を表示します。 | (接続時間の合計 + ラップアップ時間の合計) / コンタクトセッション ID の数) |
| リアルタイムアシストなしの場合の平均処理時間 | リアルタイムアシストを使用しない場合の平均インタラクション時間を示します。 | (接続時間の合計 + ラップアップ時間の合計) / コンタクトセッション ID の数) |
| リアルタイムアシスト時の平均保持時間 | リアルタイムアシスト使用時の平均インタラクション保持時間を表示します。 | 保留時間の合計 |
| リアルタイムアシストなしの場合の平均保持時間 | リアルタイムアシストを使用しない場合の平均インタラクション保持時間を示します。 | 保留時間の合計 |
| リアルタイムアシストによる平均完了時間 | リアルタイムアシスト使用時の平均インタラクション完了時間を表示します。 | ラップアップ時間の合計 |
| リアルタイムアシストなしの場合の平均完了時間 | リアルタイムアシストを使用しない場合の平均インタラクション完了時間を示します。 | ラップアップ時間の合計 |
| リアルタイムアシストによる平均自動顧客満足度 | リアルタイムアシスト使用時の平均顧客満足度(CSAT)を表示します。 | 自動 CSAT の平均 |
| リアルタイムアシストなしの場合の平均自動顧客満足度 | リアルタイムアシストを使用しない場合の平均インタラクション CSAT を表示します。 | 自動 CSAT の平均 |
リアルタイムアシスト付き通話総数
このレポートは、リアルタイムアシストが利用可能で、チャネルタイプが「電話」である問い合わせの総数を表示します。
レポートパス: 在庫レポート > 履歴レポート > マイチーム & キュー統計
出力タイプ:カード
| パラメータ | 説明 | 数式 |
|---|---|---|
| リアルタイムアシスト付き通話総数 | リアルタイムアシストが使用されている通話の総数を表示します。 | 連絡先セッション ID の数 (テレフォニー チャネルのみ) |
リアルタイムアシスト使用時の平均処理時間
このレポートは、リアルタイムアシストが利用可能で、チャネルタイプが「電話」である、エージェントが対応したすべての通話の平均処理時間を表示します。
レポートパス: 在庫レポート > 履歴レポート > マイチーム & キュー統計
出力タイプ:カード
| パラメータ | 説明 | 数式 |
|---|---|---|
| リアルタイムアシスト使用時の平均処理時間 | リアルタイムアシスト使用時の平均通話時間を表示します。 | (接続時間の合計 + ラップアップ時間の合計) / コンタクトセッション ID の数 (テレフォニー チャネルのみ) |
通話後および通話中の要約 KPI
本レポートは、コンタクトセンターにおける AI 生成のインタラクション要約の有効性と導入状況に関する包括的な洞察を提供する。 これにより、管理者やスーパーバイザーは、エージェントが通話後サマリーと通話中サマリーの両方をどのように利用しているかを追跡でき、組織は AI がエージェントの生産性、処理時間、および全体的な業務効率に与える影響を測定できるようになります。
以下は、通話後および通話中のサマリー KPI レポートから得られる主な洞察です。
- 概要の導入: さまざまなキュー、チーム、エージェント全体で AI が生成した概要の作成と利用が成功しているかどうかを監視し、使用傾向を特定します。
- 運用効率指標:平均相談時間、転送回数、やり取り中の保留イベントなどの主要業績指標を追跡することにより、AI 要約がワークフローに与える影響を分析します。
本報告書は、2 つの表と 2 枚の要約カードで構成されています。
- 通話後サマリー KPI 表
- 通話中の概要 KPI 表
- 通話後サマリー付き通話合計カード
- 通話合計と通話中サマリーカード
レポートパス:ストックレポート > 履歴レポート > エージェントレポート
表で使用可能なパラメータ:
|
パラメータ |
説明 |
|---|---|
|
キュー/チーム/エージェント名 |
データが表示される組織階層レベル。 キューからエージェントまでドリルダウンできます。 |
|
チャネルタイプ |
対話の媒体(例:電話)。 |
|
要約とのインタラクションの合計 |
AI が生成した要約が正常に作成され、エージェントに提示された通話の総数。 |
|
要約なしの総インタラクション数 |
要約が生成または使用されなかった通話の総数。 |
|
平均診察時間 |
(通話中)エージェントが内部相談に費やす平均時間。効率向上を測定するために使用される。 |
|
転送数 |
(通話中)選択された期間中に実行された転送の総数。 |
|
保留カウント(Hold Count) |
(通話中)相談または転送中に開始された保留イベントの総数。 |
通話後サマリー付き通話合計カード
このレポートは、AI によって生成された通話後サマリーが正常に作成され、エージェントに提示されたやり取りの総数を表示します。
レポートパス: 株式レポート > 履歴レポート > エージェントレポート
出力タイプ: カード
| パラメータ | 説明 |
|---|---|
| 通話総数と通話後サマリー | AI によって生成された通話後サマリーが正常に作成された通話の総数を表示します。 |
通話合計と通話中サマリーカード
このレポートは、AI が生成した通話中要約が正常に作成され、エージェントに提示されたやり取りの総数を表示します。
レポートパス: 株式レポート > 履歴レポート > エージェントレポート
出力タイプ: カード
| パラメータ | 説明 |
|---|---|
| 通話総数と通話途中の要約 | AI が生成した通話途中の要約が正常に作成された通話の総数を表示します。 |
レポートをカスタマイズし、トレンドラインチャートを作成する
レポートをカスタマイズし、そこからトレンド ライン チャートを作成できます。 次のセクションでは、自動 CSAT レポートを例として使用して、レポートをカスタマイズする方法とトレンド ライン チャートを作成する方法の両方を示します。
AI Assistant ダッシュボードで自動 CSAT レポートをカスタマイズする
AI Assistant ダッシュボードでレポートをカスタマイズできます。 ここでは、自動 CSAT レポートをカスタマイズする手順を示します。同様のアプローチを適用して、他のレポートをカスタマイズできます。
| 1 |
Analyzer にログインします。 |
| 2 |
に移動します。 AI Assistant ダッシュボード を選択し、省略記号ボタンをクリックしてレポート オプションを表示します。 ダッシュボードのカスタム バージョンを作成するには、 コピーの作成 オプションを選択します。 [名前を付けて保存] をクリックし、目的のフォルダに保存します。 |
| 3 |
に移動します。 自動 CSAT レポートを選択し、省略記号ボタンをクリックしてレポート オプションを表示します。 必要に応じて変更できるように、 コピーの作成 オプションを選択して、自動 CSAT レポートのコピーを作成します。 [名前を付けて保存] をクリックし、希望のフォルダに保存します。 |
| 4 |
アンケート回答を統合する:
|
| 5 |
カスタムダッシュボードを保存したフォルダーに移動し、 [編集] をクリックします。 モジュールの下の視覚化から、手順 2 で作成したカスタム自動 CSAT レポートをカスタム AI Assistant ダッシュボードに追加します。 [保存] をクリックします。 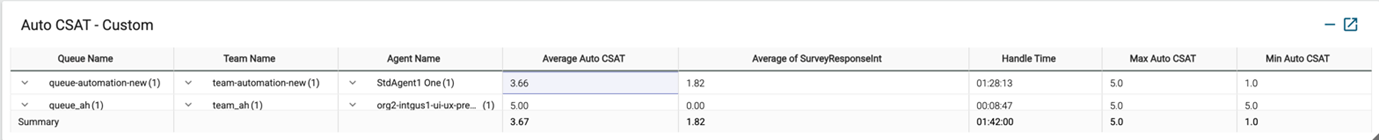
|
トレンドラインチャートを作成する
レポートを使用してトレンド ライン グラフを作成できます。 自動 CSAT レポートを使用してトレンド ライン チャートを作成し、時間の経過に伴う CSAT の変動を視覚化して、エージェントのパフォーマンス、チームの効率、顧客体験の傾向に関する貴重な分析情報を提供する手順を次に示します。同様のアプローチを適用して、他のレポートを使用してトレンド ライン チャートを作成することもできます。
| 1 |
Analyzer にログインします。 |
| 2 |
に移動します。 AI Assistant ダッシュボード を選択し、省略記号ボタンをクリックしてレポート オプションを表示します。 ダッシュボードのカスタム バージョンを作成するには、 [コピーの作成] を選択します。 [名前を付けて保存] をクリックし、ダッシュボードを目的のフォルダーに保存します。 |
| 3 |
移動先 。 選択してください 自動車 CSAT レポートをクリックし、省略記号ボタンをクリックしてレポート オプションを表示します。 選ぶ コピーを作成 必要に応じて変更できるように、自動 CSAT レポートのコピーを作成します。 既存のカスタム バージョンを再利用することもできます。 |
| 4 |
自動 CSAT テーブルでデータ計算を調整します。 コンピューティング セクションでは、間隔を 毎日 日々の傾向の追跡や希望の期間に使用できます。 |
| 5 |
変更する 出力タイプ に 折れ線グラフ の中で 視覚化 ドロップダウンリスト。 |
| 6 |
すべてのプロファイル変数を削除し、平均自動 CSAT のみを保持して、コア指標に重点を置きます。 |
| 7 |
カスタムを追加 トレンドラインチャート あなたのカスタム AI Assistant ダッシュボード。 [保存] をクリックします。 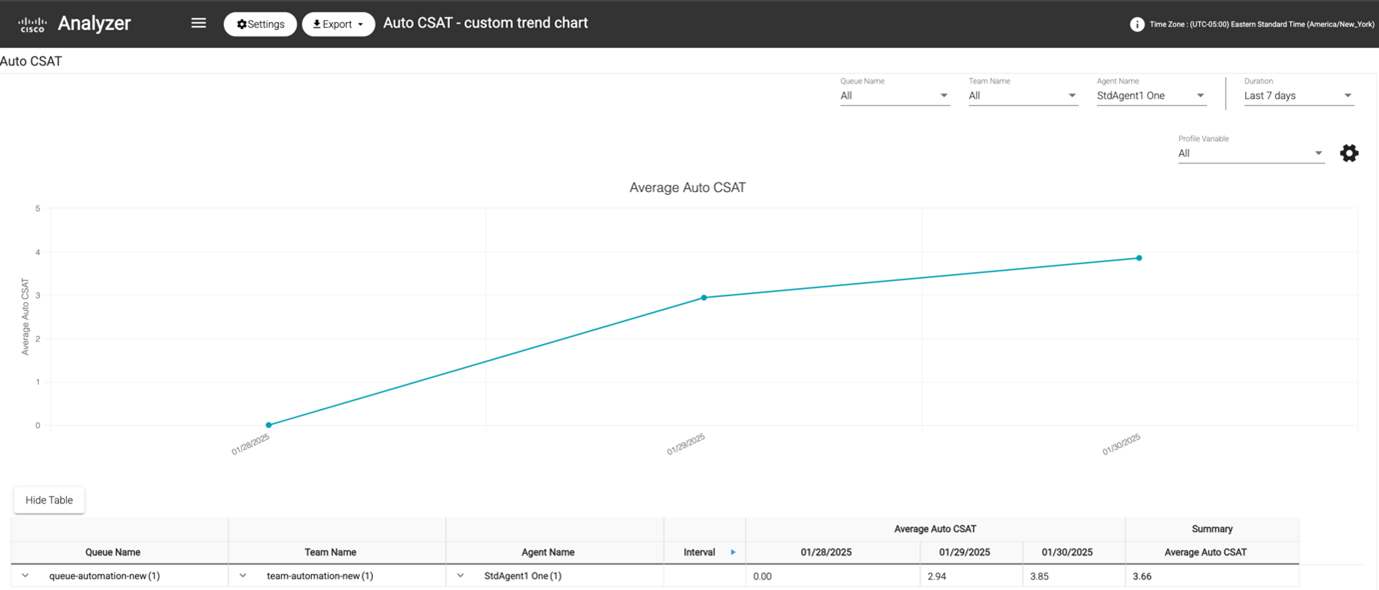
|
ブラウザリンクを通じてダッシュボードとレポートを共有する
レポートやダッシュボードへのブラウザのリンクを、アナライザにアクセスできない標準エージェントと高品質のエージェントと共有できます。 エージェントは、ブラウザのリンクからレポートやダッシュボードにアクセスできます。
| 1 |
Webex Contact Center アナライザにログインします。 |
| 2 |
共有する必要があるビジュアライゼーションまたはダッシュボードを実行します。 |
| 3 |
ブラウザに表示されている URL をコピーします。 この URL をエージェントと共有できます。 |


