- Home
- /
- Article

Thanks for your feedback.

Troubleshoot Unified CM call signaling issues using Webex Cloud-Connected UC
 In this article
 Feedback?
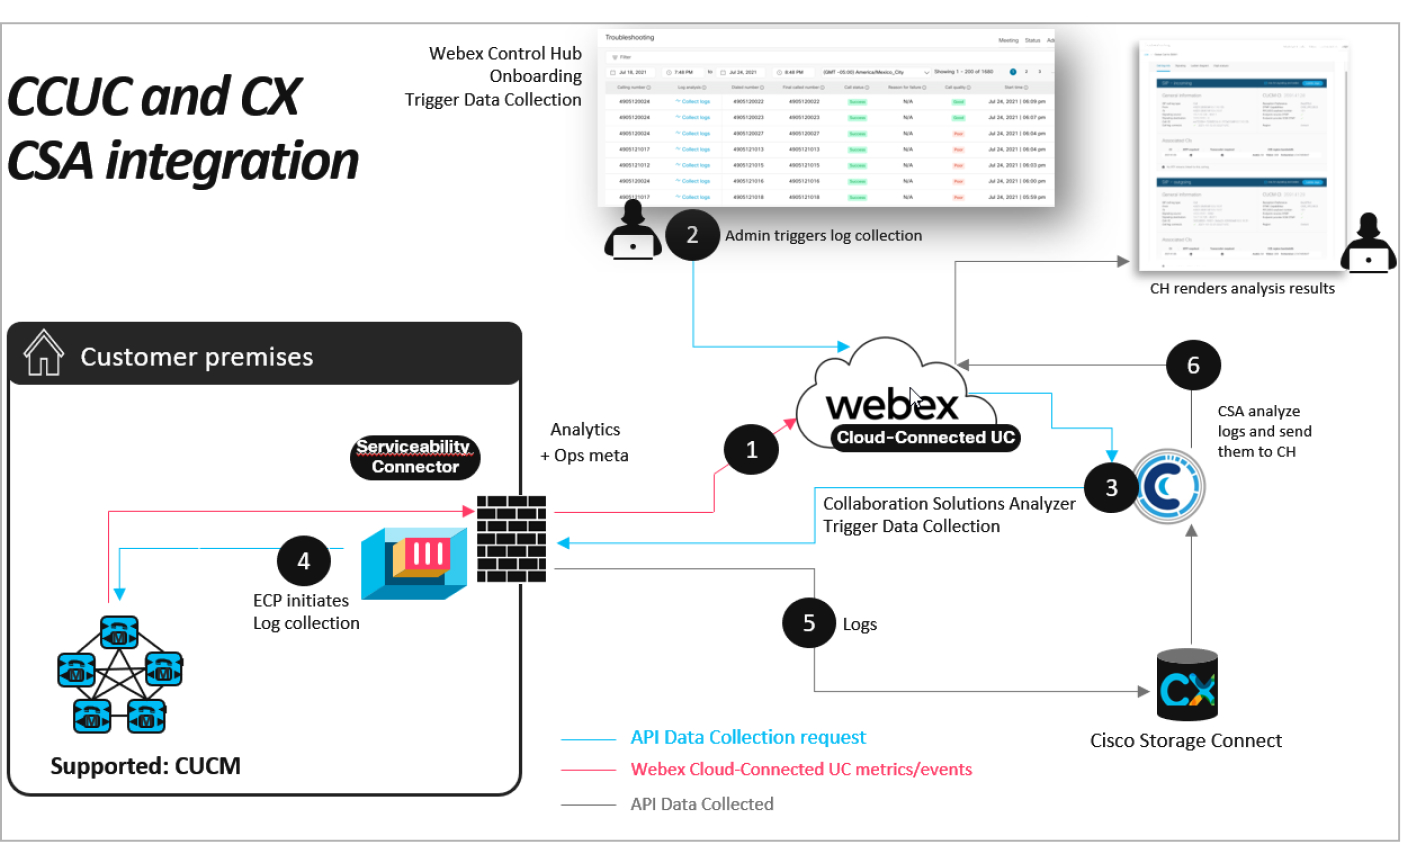
If you are experiencing an issue with Unified CM call signing, Webex Cloud-Connected UC integrates with Collaboration Solutions Analyzer (CSA) and enables you to troubleshoot the issue by using the troubleshooting information that is presented in Control Hub to determine the root cause.
Introduction
View Troubleshooting Data
If you're a read-only administrator or a full-administrator or a support administrator, you can use the troubleshooting information that is presented in Control Hub to determine the root cause of Unified CM call signaling issues that your users face.
Before you begin
-
Ensure that you've logged in either as a full administrator, read-only administrator, or a support administrator. Troubleshooting log analysis works only for these roles.
-
For the Troubleshooting feature to work, you must enable Operational Metrics service for the desired Unified CM clusters on the Service Management page. For more information, see Enable or Disable Webex Cloud-Connected UC Services in Control Hub.
-
When you use the Troubleshooting feature to collect logs and analyze them, other data may be processed and stored outside your region as described in the Cisco TAC Delivery Services Privacy Data Sheet.
-
For the Troubleshooting feature to work, ensure that you deploy Webex Serviceability Connector. For more information, refer to the Deployment Guide for Webex Serviceability Connector.
-
For the Troubleshooting Feature to work, onboard all Unified CM clusters to Webex Cloud-Connected UC and enable Operational Metrics for them. Also ensure that you onboard these clusters to the Webex Serviceability Connector.
-
Ensure that you onboard all the nodes of each Unified CM cluster to the Webex Serviceability Connector.
-
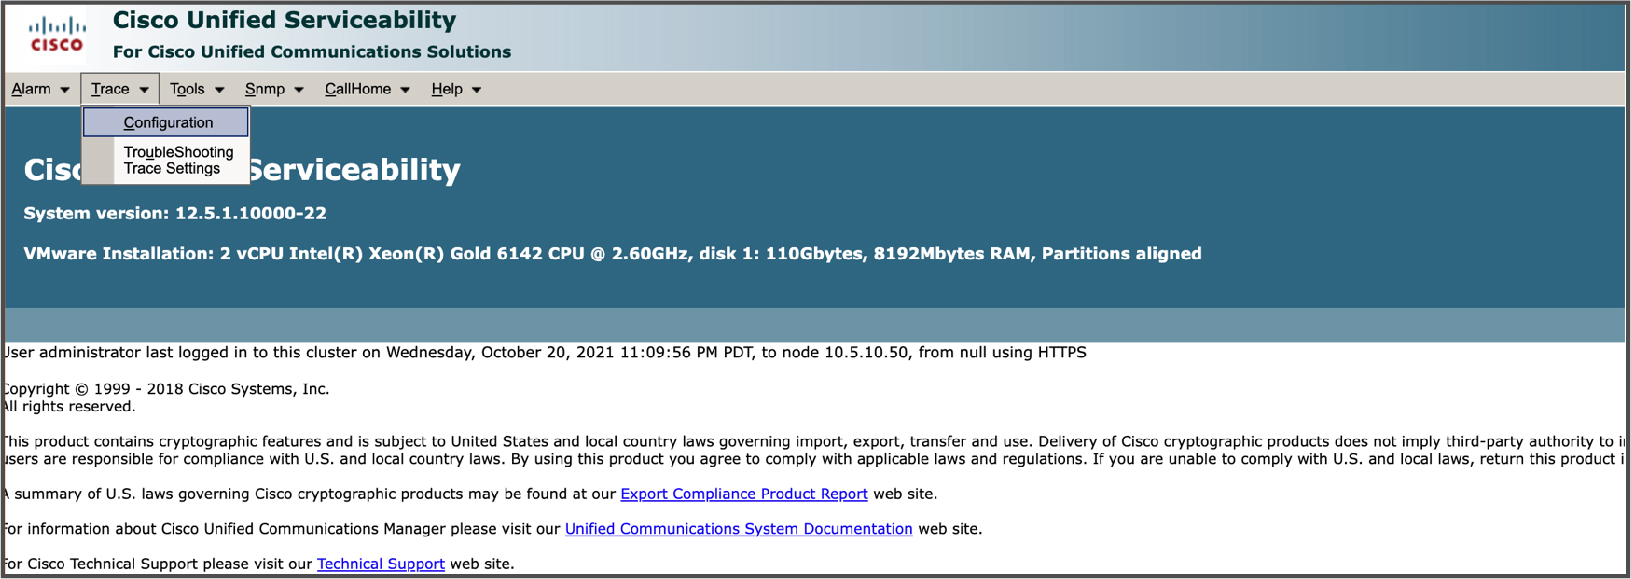
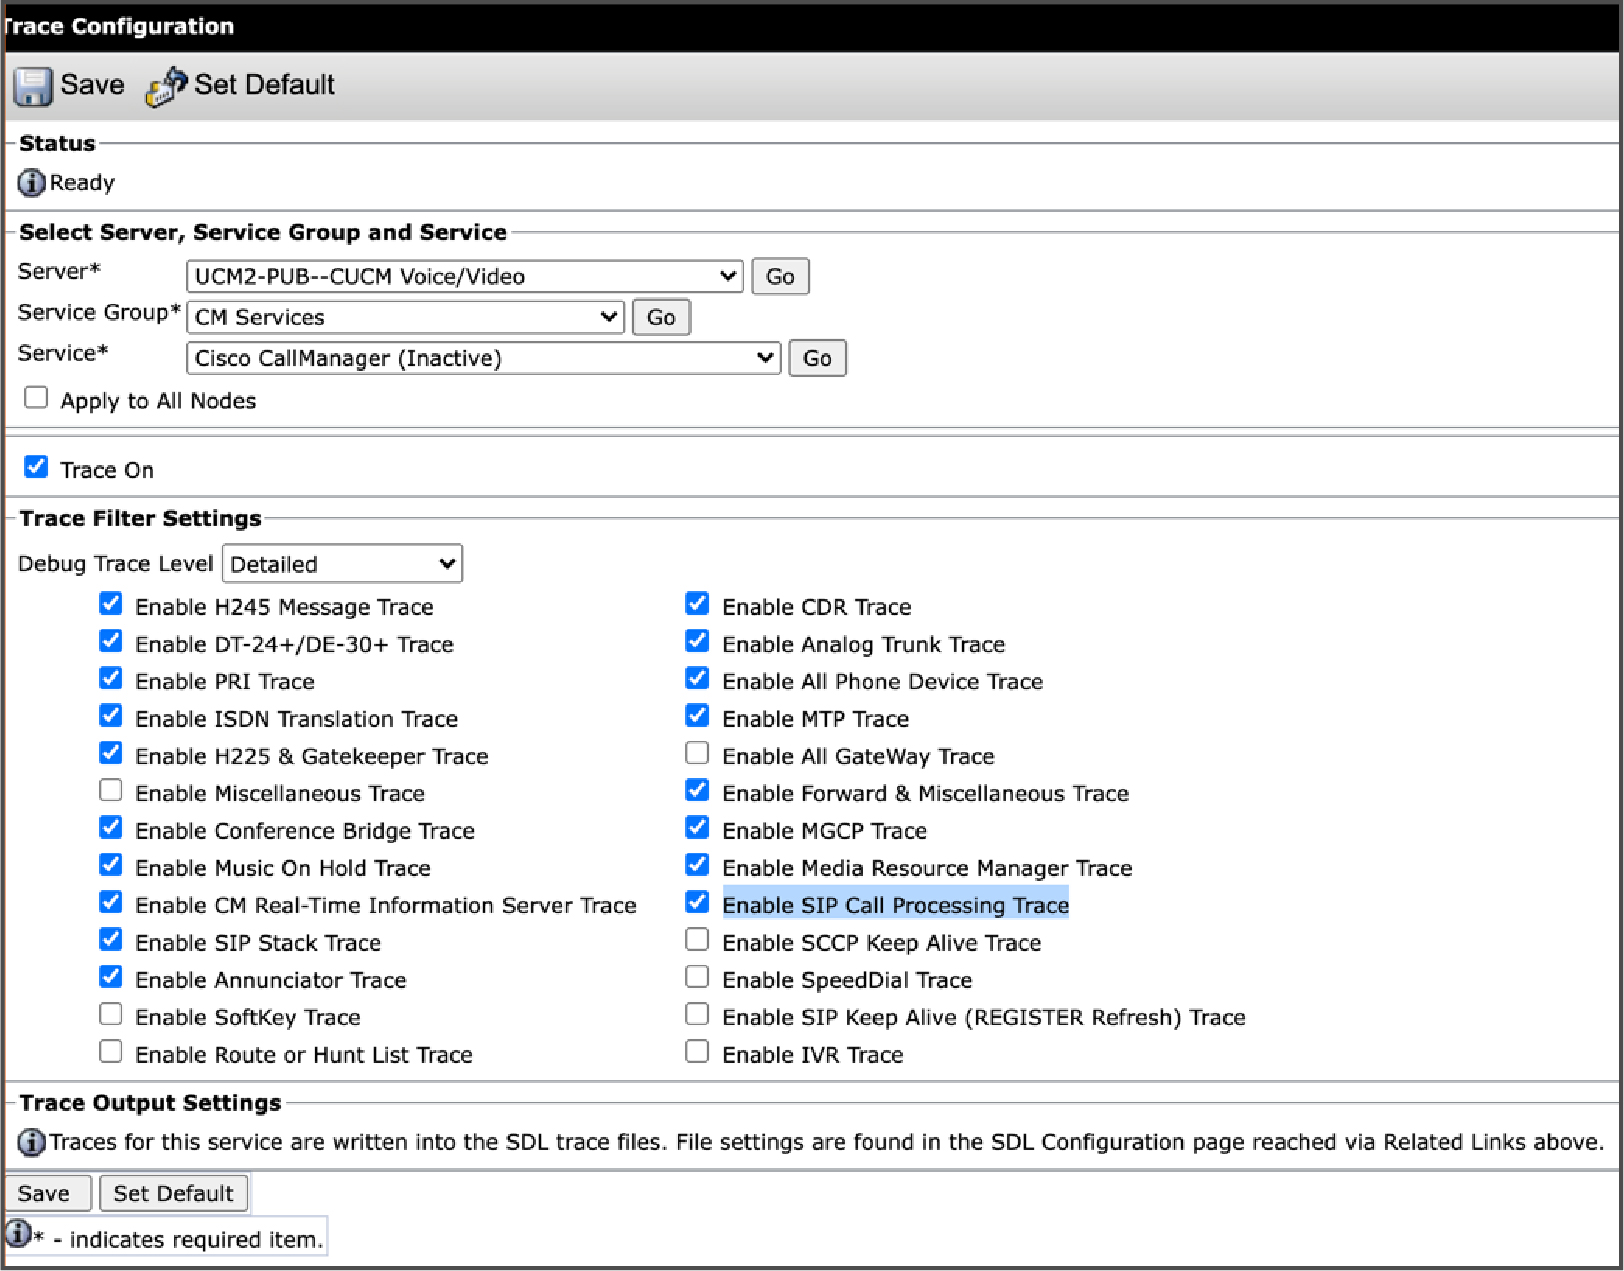
On all call processing nodes, ensure that in the Cisco Unified Serviceability application, you set the Debug Trace Level to Detailed and in the Trace Filter Settings section, check the Enable SIP Call Processing Trace check box (see the following screen shots). For more information, refer to the Configure Trace section in the Cisco Unified Serviceability Administration Guide for your version of Unified CM release.
|
From the customer view in Control Hub, go to . Click Connected UC. The Troubleshooting page appears with the following information:
|
Filter Troubleshooting Data
You can filter the troubleshooting information that is related to Webex Cloud-Connected UC calls that is presented in Control Hub.
| 1 |
Click the search area at the top of the page. A drop-down list appears with the following filters:
Select the filter that you want to apply. For example, if you want to see a list of all the poor calls, select the Call quality filter and click Poor from the drop-down list. You can simultaneously apply multiple filters. |
| 2 |
(Optional) Click x for a filter to clear it, or to clear multiple filters, click Clear all at the top right of the screen. |
Cross launch from Operations Dashboard to Troubleshooting Page
| 1 |
From the customer view in Control Hub, go to . On the Operations card, click Dashboard. |
| 2 |
On any chart, click Troubleshoot now. This cross-launches the Troubleshooting page with the appropriate filter selected. |
Collect Call Logs
| 1 |
From the customer view in Control Hub, go to . Click Connected UC. The Troubleshooting page appears. |
| 2 |
Select the filter or filters that you want to apply. |
| 3 |
In the Log Analysis column, click Collect logs for the call for which you want to collect logs. Click multiple nodes to collect the logs in parallel. |
| 4 |
Click the progress bar corresponding to the call for which you want to view the progress of log collection. The Log collection status window appears. The following are the various stages that take place during log collection:
After reaching the Completed step, click Close to exit out of the Log collection status window. Click Cancel log collection to abort the collection of logs. |
Show Analysis
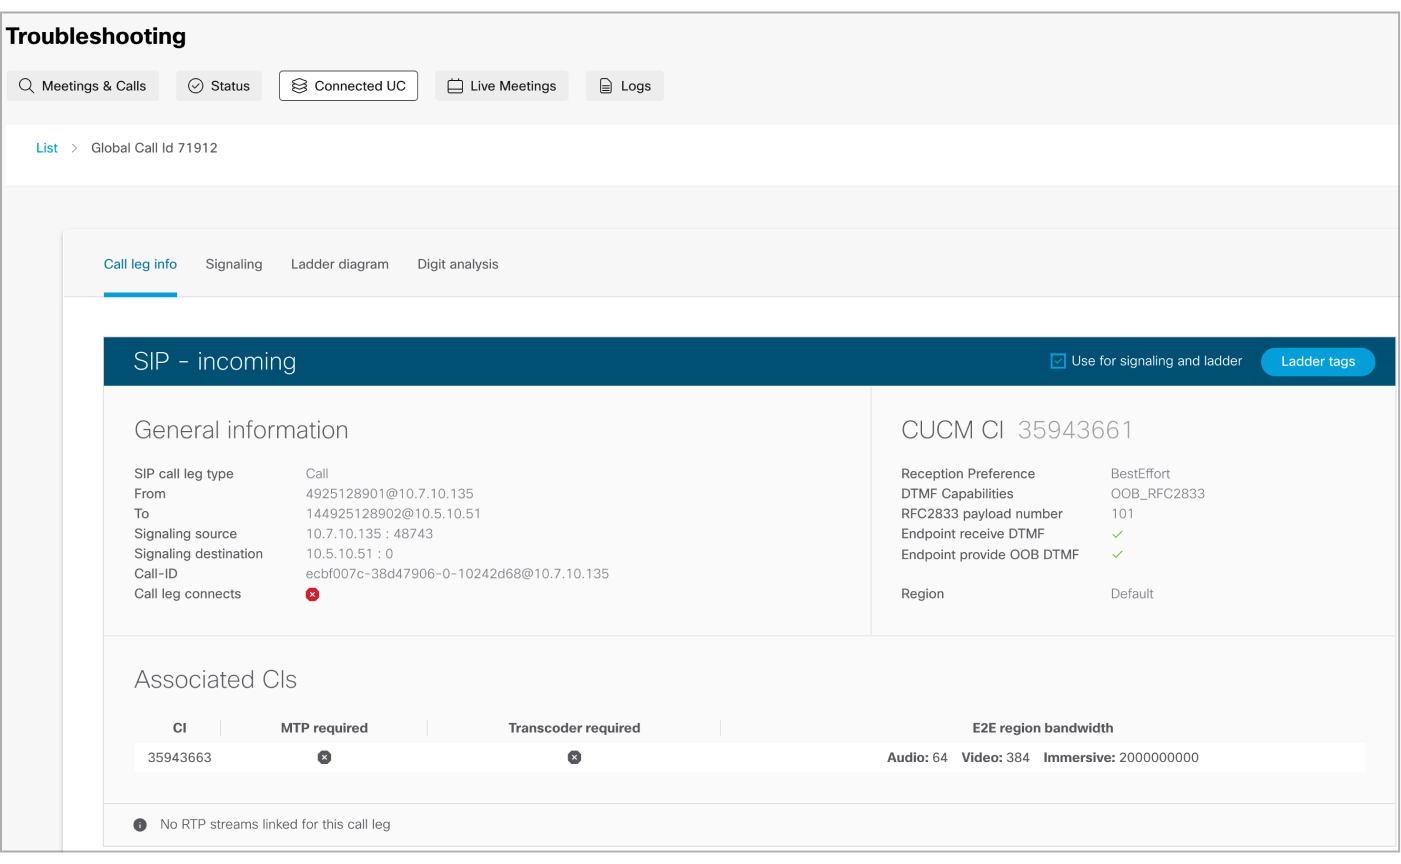
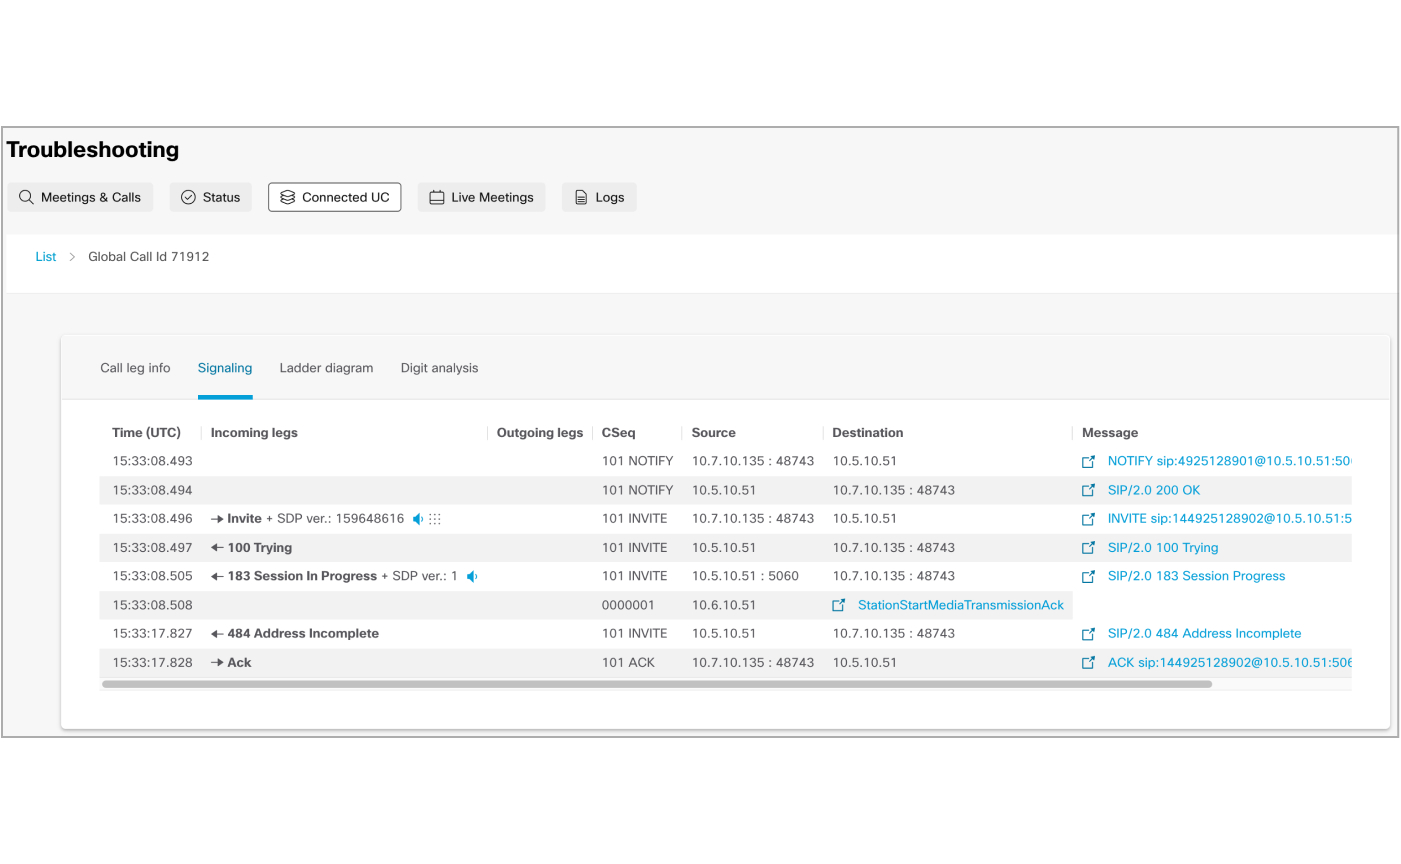
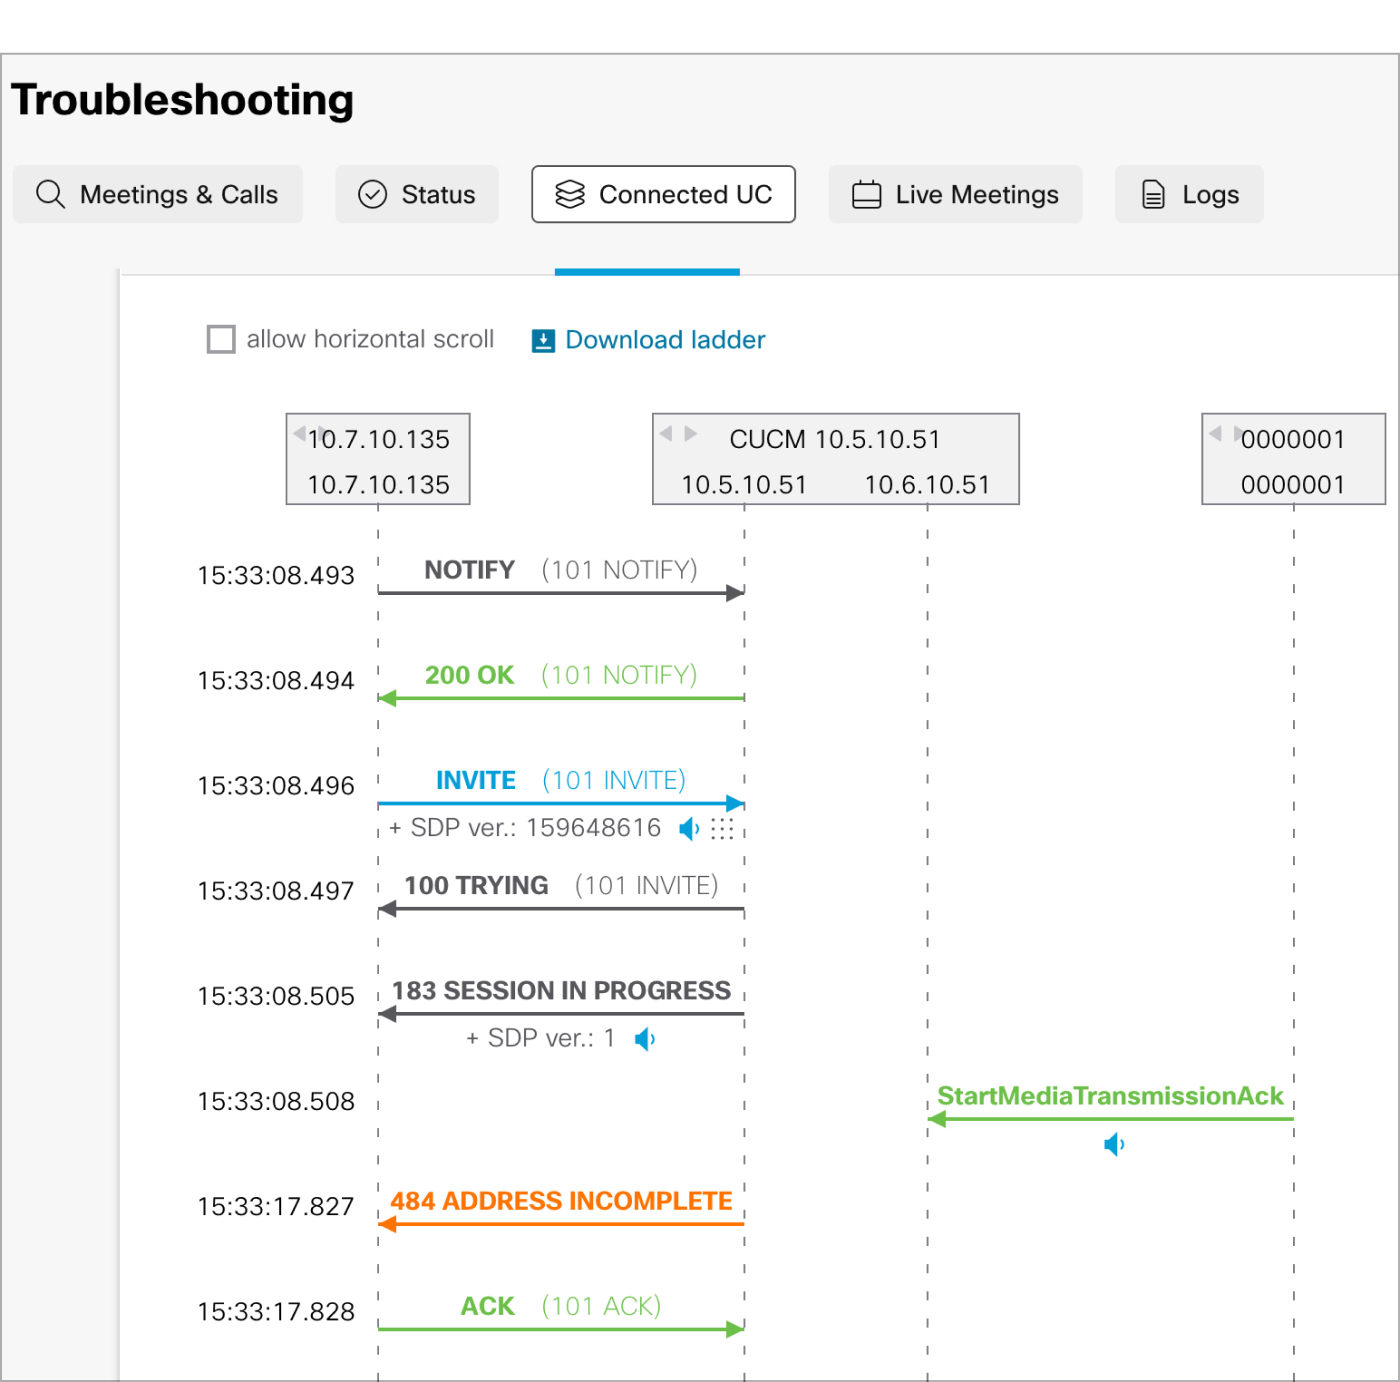
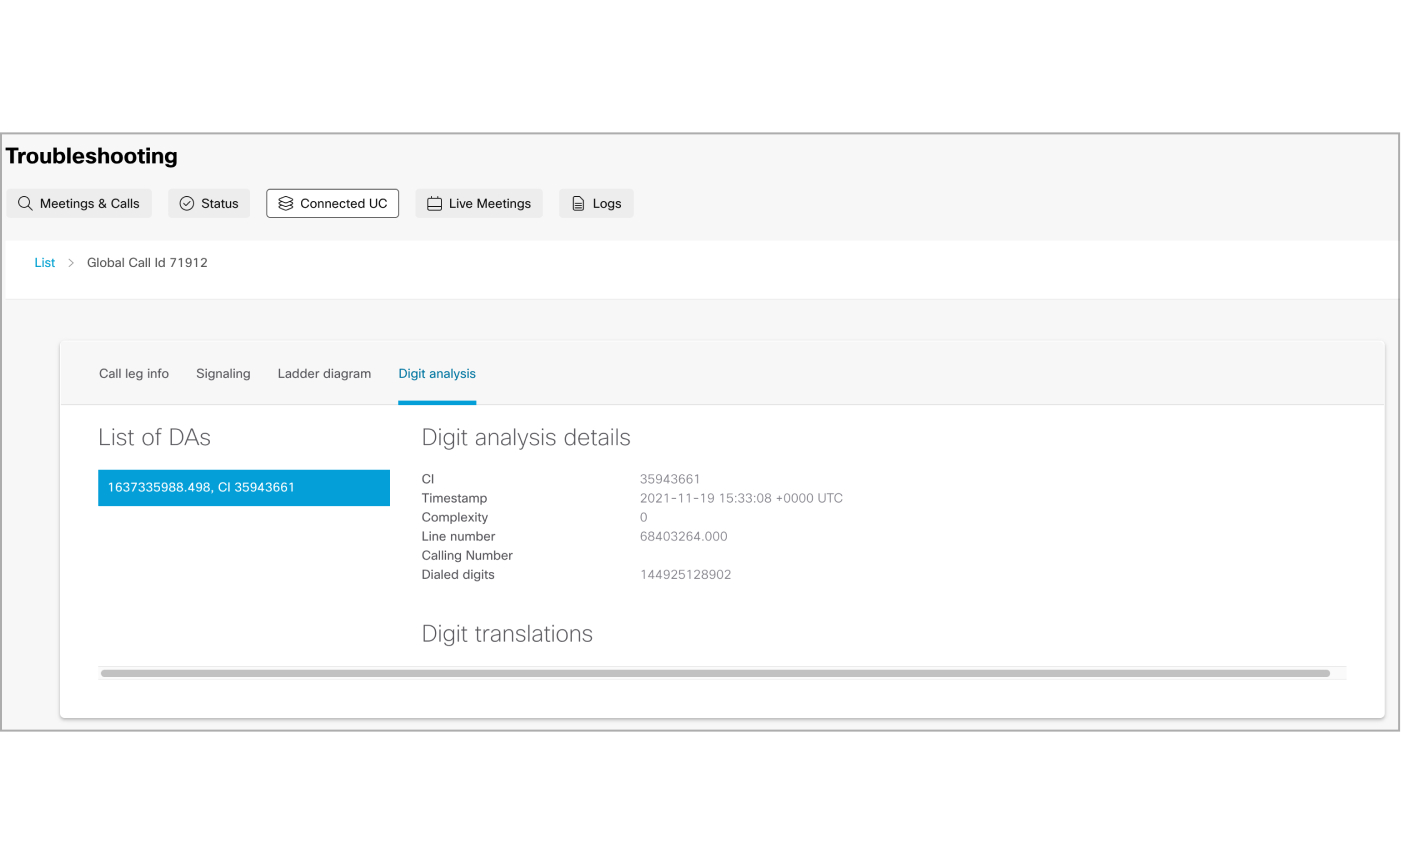
You can use the collected logs to analyze the reason for call failure.
|
After call logs are collected, click Show analysis to load the results. Once the results are loaded, the SIP-Incoming window appears showing four tabs. Use them to analyze the reason for the call failures. The tabs on the SIP-Incoming window are as follows:
|