- Home
- /
- Article

Thanks for your feedback.

 In this article
 Feedback?
The troubleshooting view in Webex Calling allows administrators to troubleshoot connectivity and media-related quality issues for Webex Calling calls. You can search for information related to the call, see if it was successful, refused, or failed, view its media statistics, identify where the issue occurred, and resolve the problem.
Overview
Troubleshooting for Webex Calling allows you to troubleshoot media quality and call connectivity-related issues for specific Webex Calling calls. You might want to troubleshoot calls for various reasons, such as complaints from customers on how they're experiencing poor call quality. In this case, you can go directly to the troubleshooting view, search for those specific calls, and then view the hop details to pinpoint where the issue could be. You can also use troubleshooting to proactively monitor call quality for the organization and get ahead of specific problems before users notice.
To access the troubleshooting view, you must have the full admin, read-only admin, or support admin role in Control Hub.
Webex Calling troubleshooting allows you to:
-
Search for successful, failed, and refused calls.
-
View the end-to-end experience of the participants of the call.
-
View a hop detail of the call.
-
View if the media traverses through the Webex Calling cloud, or directly between the users (using Interactive Connectivity Establishment (ICE)).
-
View Insights, if there’s no media in the call, or when the path optimization setup was unsuccessful.
-
View calls for the past 21 days.
-
View signaling-related call failures and rejections.
-
Analyze the call quality metrics that impacted the experience of the user. For example, an administrator may observe high jitter on clients over Wi-Fi networks, but packet loss and latency may be acceptable.
-
Detect if the issue is with the caller or the callee.
The calls using Webex Calling appear after the call ends.
The troubleshooting view helps to identify the problem area by providing all the relevant metrics and can’t necessarily provide you the root cause for a poor call. Look at these pointers to identify various factors and determine the resolution options:
-
The end-to-end experience of the user.
-
The Hop Details view.
-
Send or receive metrics from the user or the media relay point.
-
Whether the call occurred to or from an external network or between the Webex Calling registered endpoints.
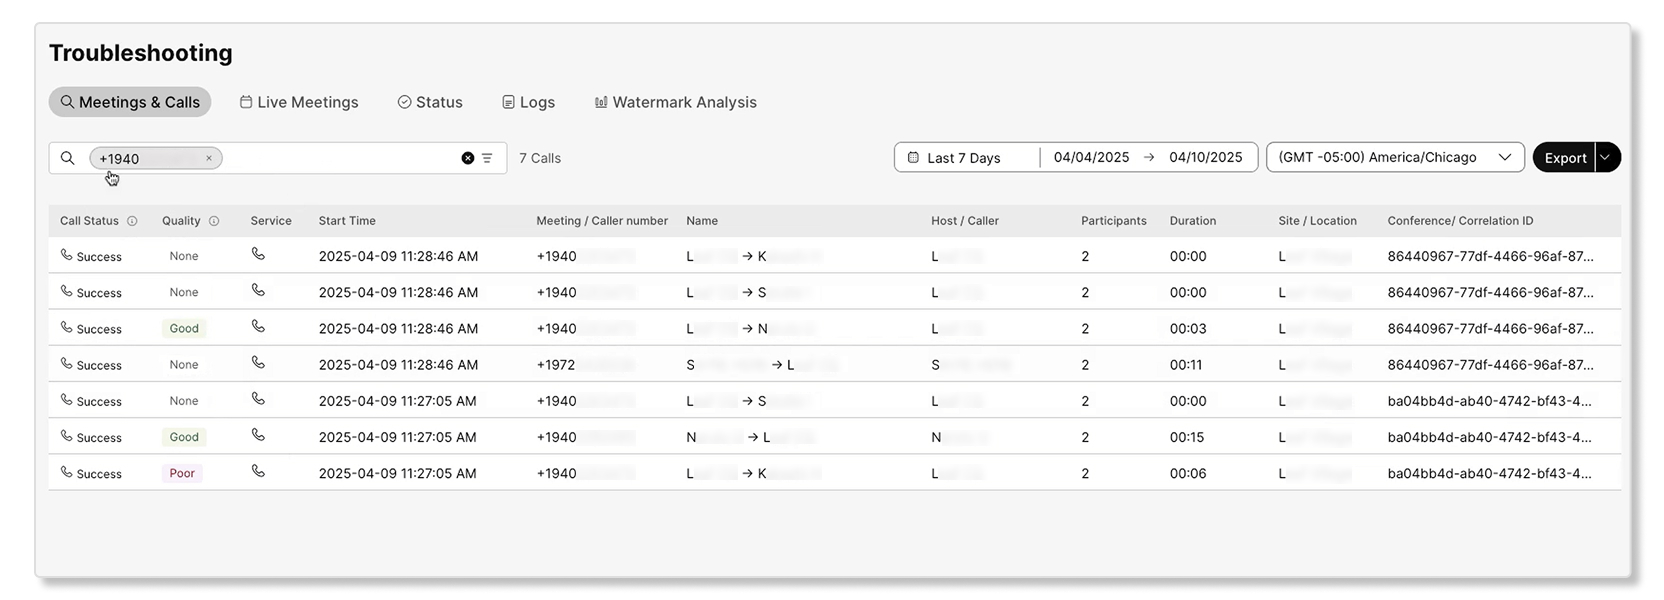
Search view
You can search using the following criteria to get a list of calls where a media session was used with at least one Webex Calling-registered endpoint:
-
Email addresses
-
Phone numbers
-
MAC addresses
-
Call IDs
-
Correlation IDs
Partial search is supported for phone number, user name, and device name. For phone numbers, you can enter the first two digits to see a list of possible numbers. If you enter some digits and press Enter directly, the search will attempt to find an exact match.
When you search for the email address of a user, their meetings and calls are separated into their respective tabs:
-
Meetings—Contains all of the meetings that the user participated in.
-
Webex Calling—Contains all of the Webex Calling calls.
-
Call on Webex—Contains Call on Webex calls.
When you search by correlation ID or phone number, only the relevant tab (in this case Webex calling) shows up, displaying only the relevant results.
When you search for a call, the relevant call segments are displayed in the Webex Calling tab. The following data is available:
| Column name | Definition |
|---|---|
|
Status |
If the call attempt was successful or not. When the call attempt has a Refusal or Failure status, you can hover over the status to see the relevant code. Possible values are:
|
|
Overall quality |
The Webex Calling calls are graded for quality. However, for the Webex meetings or Call on Webex sessions, this grading doesn’t apply. The call experience is graded as:
|
|
Personal quality |
The individual call segment quality of the user. |
|
Timestamp |
Start time of the call. |
|
Caller number |
Webex Calling number assigned to the caller. |
|
Caller name |
Name of the caller. |
|
Callee number |
Webex Calling number assigned to the callee. |
|
Callee name |
Name of the callee. |
|
Duration |
Amount of time that the call lasted. |
|
Location |
Webex Calling location of the caller. |
|
Correlation ID |
Correlation ID to tie together multiple call segments/call legs of the same call. |
Searched user's Key Performance Indicators (KPIs)
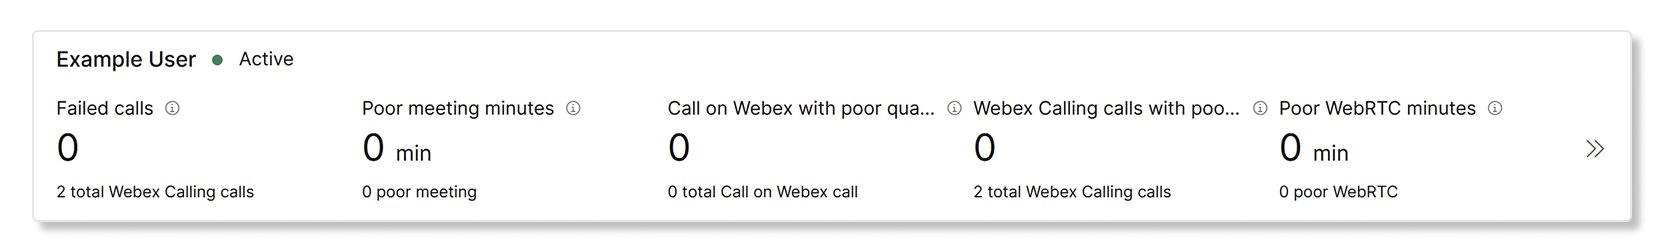
The following KPIs are available for the Webex Calling tab when you search for a user:
-
Total calls—Total number of Webex Calling calls for the selected user or device, including calls with and without media. A single Webex Calling call can have multiple call legs based on the participants involved within the call. Each of these call legs can have one or more, or no media sessions.
The visual data underneath breaks down calls with and without media.
-
Call segments—Total number of call segments, including successful, failed, and refused segments. A call segment represents a point-to-point connection between two participants within a Webex Calling call.
The visual data underneath breaks down failed, refused, and successful calls.
-
Total calls with media—Total number of Webex Calling calls that included at least one media session where media quality stats were captured. Includes both good and poor quality calls with media. A good quality call is where all media sessions within the call were categorized as good quality.
The visual data underneath breaks down calls with good and bad quality.
-
# of media sessions—Total number of media sessions established across all calls where media quality was captured. A media session represents a single segment of a call where audio or video is actively transmitted and media quality is captured.
The visual data underneath breaks down calls with good and bad quality.
What is a call segment?
A call segment represents a discrete portion of a Webex Calling call. Essentially, each direct hop or connection between two participants constitutes a single call segment.
For example, if Alice calls an Auto Attendant that deflects the call to Bob, Alice to Auto Attendant is considered one segment of the call while Auto attendant to Bob is considered as another segment of the same call flow. A single, complex call can therefore comprise of multiple call segments.
Typically, a call segment is composed of two call legs (CDRs): an originating leg and a terminating leg. However, in scenarios involving PSTN calls, only a single call leg (the terminating leg for the Webex user) may be generated from the Webex Calling perspective.
Each call segment can have a distinct outcome (e.g., success, failure, refusal). Therefore, representing communication events as call segments in the Control Hub Troubleshooting view is crucial. This allows customers to observe a complete breakdown into individual segments, enabling precise identification of issues within a complex call flow.
Call summary
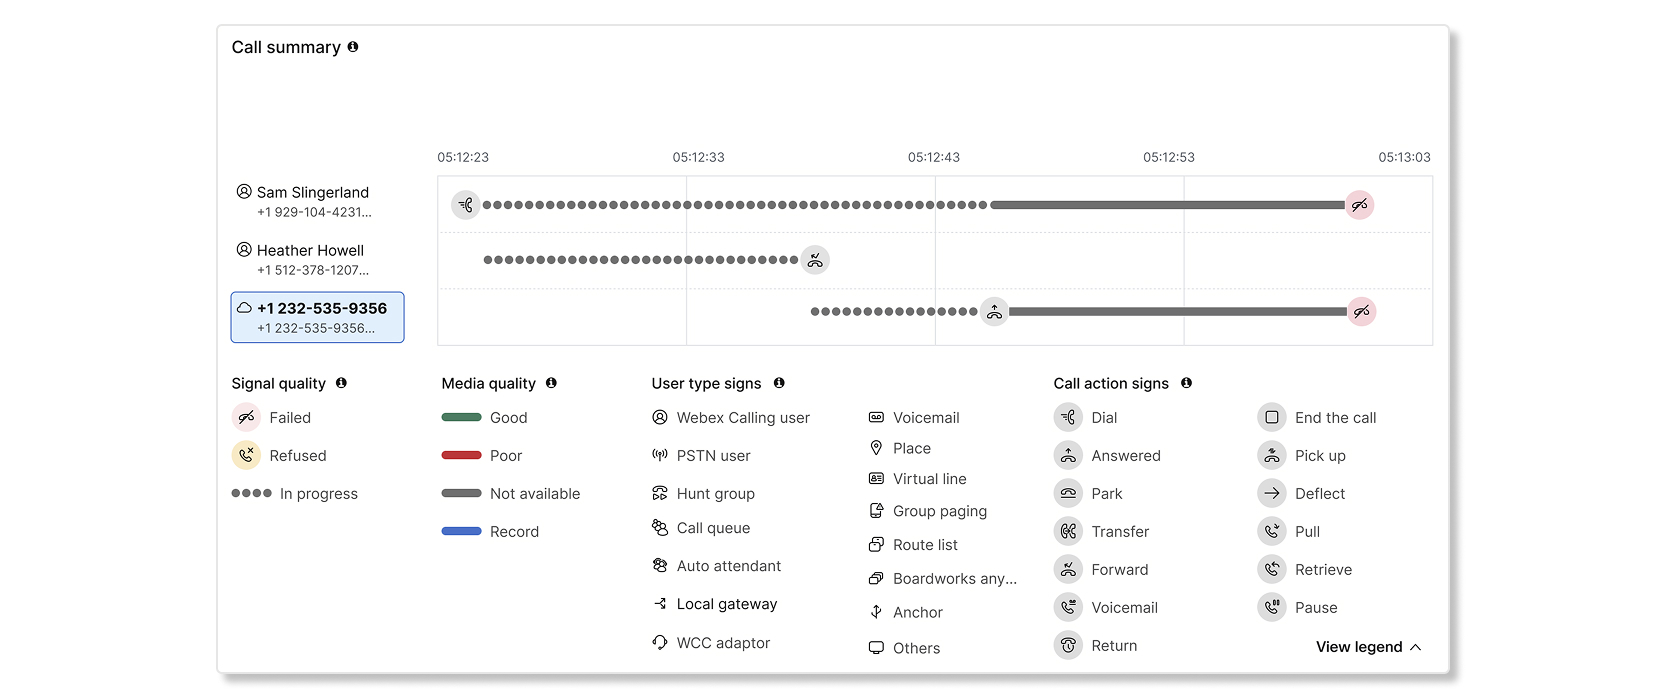
The call summary section on the call details page visually represents a comprehensive, end-to-end progression of an entire call sequence. This high-level view enables customers to visualize the entire flow of a call, even when it encompasses multiple logical "calls" (as defined by common Correlation IDs) or complex transfer scenarios. The call summary intelligently stitches together all intermediary hops and related "calls" to provide a holistic and coherent view.
Call summary allows you to quickly understand the call flow from start to finish in a visual timeline view. Each participant on the left represents the user type (PSTN, hunt group, call queue, etc.) while the lines in front of them represent the call interaction for that participant. Interactions between two participants are call segments. By hovering over a participant, you can view detailed information such as the name, user type, duration timestamp, and more. You can click on specific participants to see the call segment details in the hop view below the call summary card on the same page. Note that some of the participants with PSTN and Local Gateway user types aren’t clickable.
Call summary also highlights the call actions like dial, park, transfer etc. And the connectivity status like failure, refusal. You can hover over specific signs to get more details, helping you identify and troubleshoot issues at the exact point where they occurred.
The screenshot above for example, represents a call where an external PSTN user dialed into an Auto Attendant which directed the call to a Call Queue. The call was then presented deflected to two agents, out of which the second agent picked up the call and spoke to the PSTN user. Media quality overlays represent the media quality at the endpoints. Legends provides further details to help you understand the call summary.
For a more detailed explanation on the call summary section, you can watch this vidcast
The following scenarios aren’t supported by the call summary diagram:
- Conference call flows such as Conference, Barge-In, Call Bridge, and Call Merge.
- Call queue supervisor functions such as silent monitoring, coaching, barge-in, take over, etc.
- Information about announcements played to the endpoints.
- Information about calls that are put on hold and resumed during an active call.
- Call failure and refusal situations may end up showing different reasons on each side of the call segments due to internal call states.
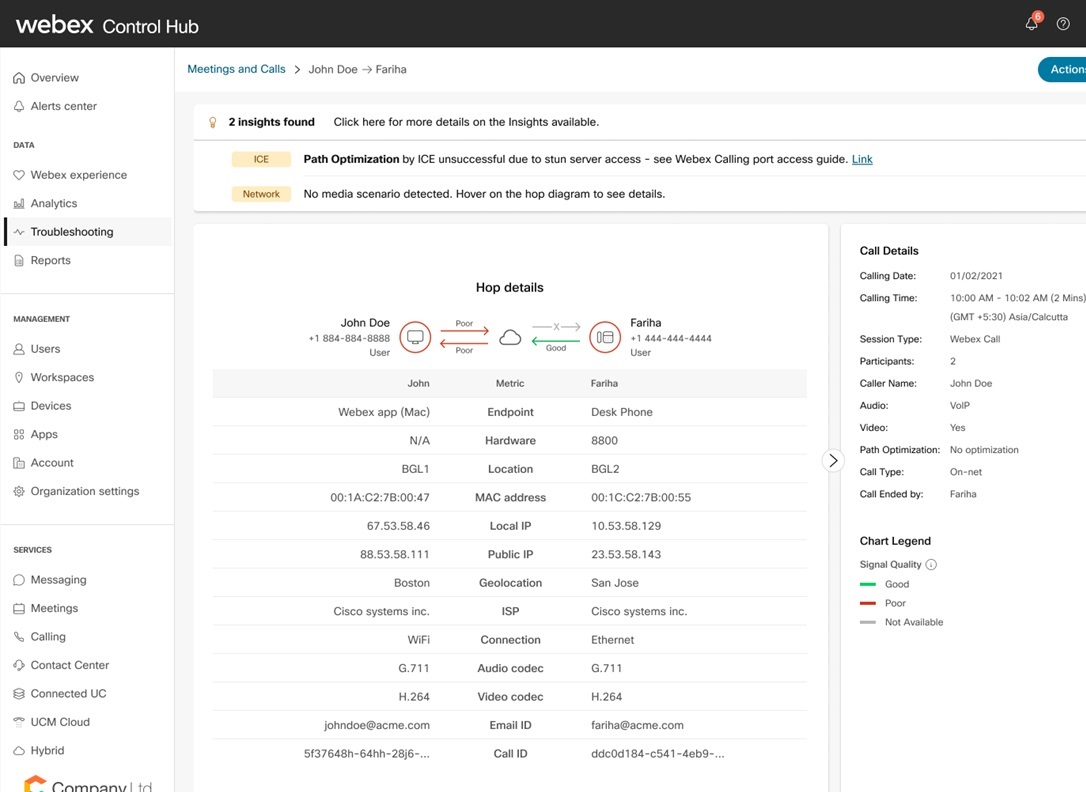
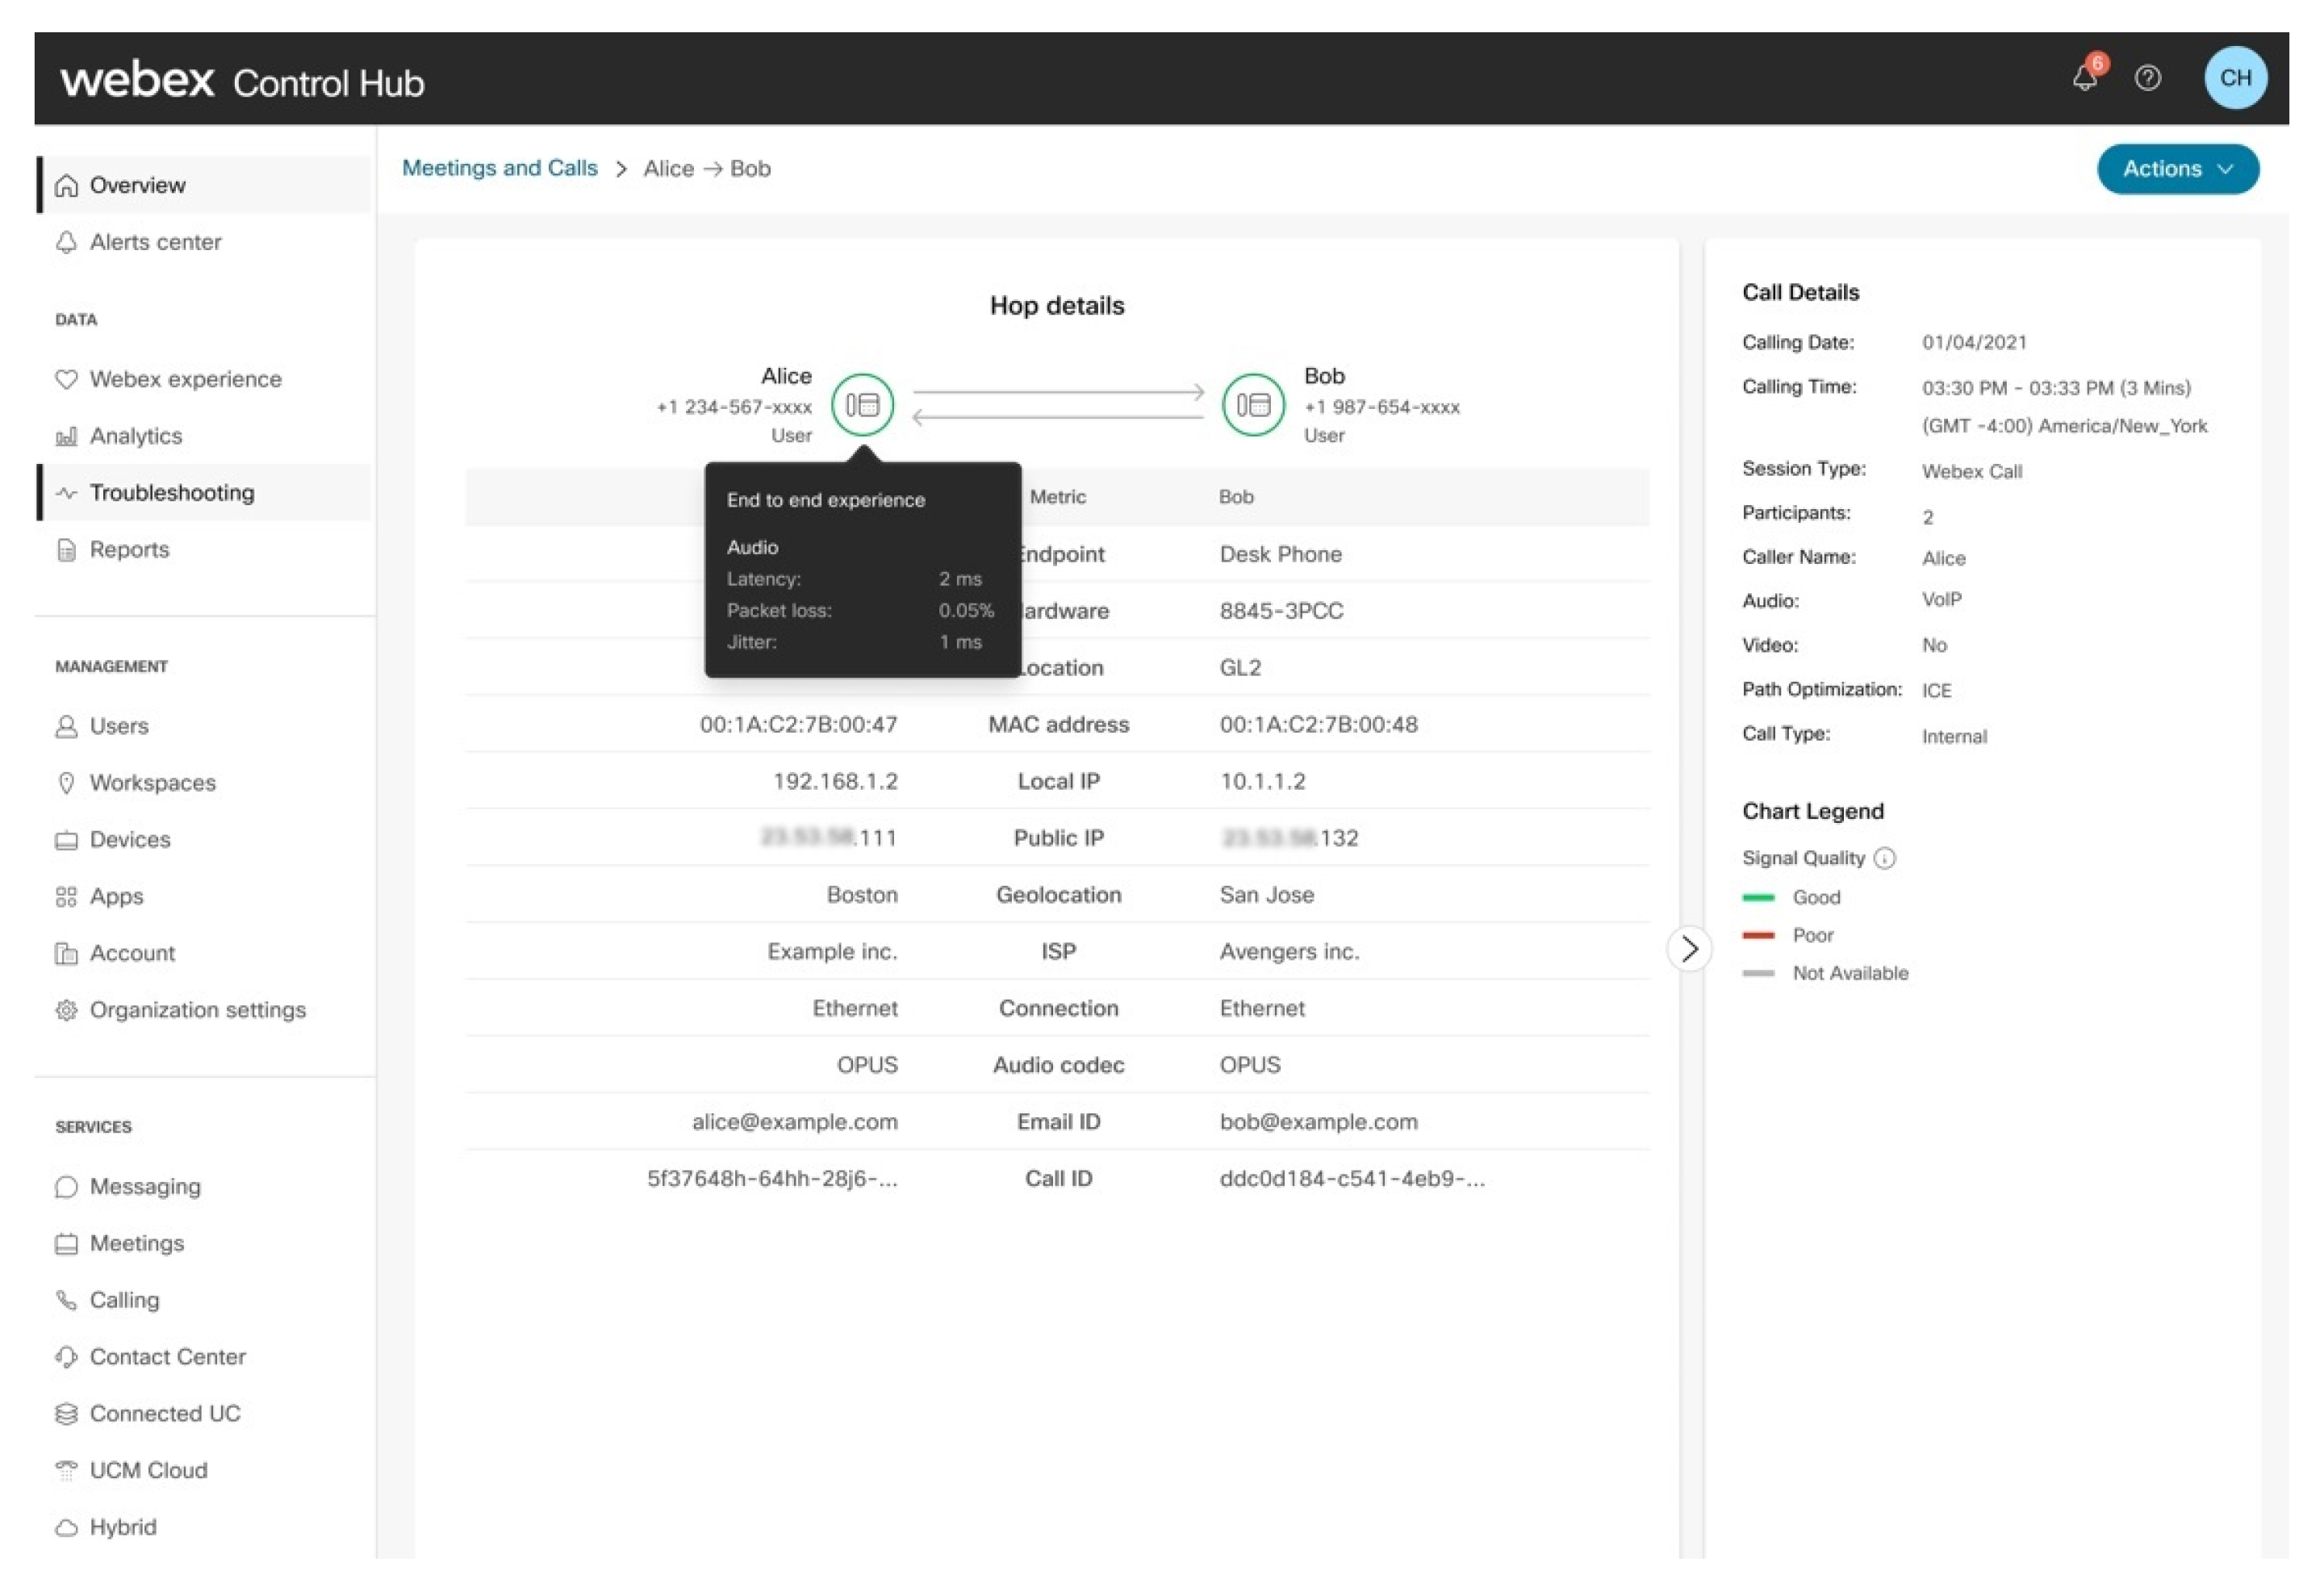
Hop details view
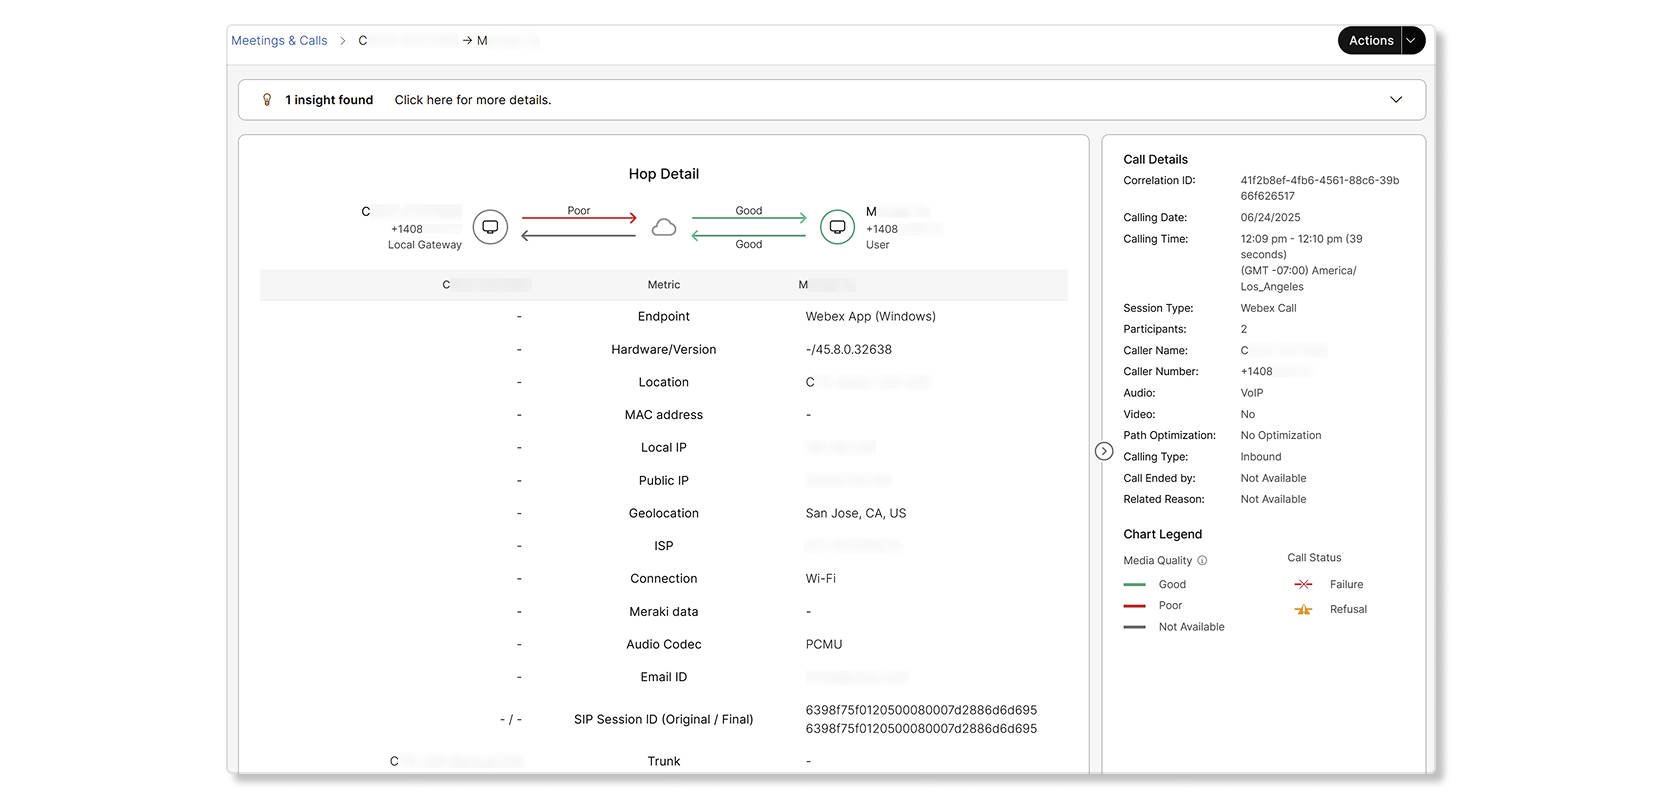
The following data is available in the hop details view:
| Term | Definition |
|---|---|
| Endpoint |
Displays one of the following:
|
| Hardware |
Displays one of the following:
|
| Location |
Webex Calling location that's configured for the user. The country that Webex Calling was provisioned in is also shown in brackets. |
| Local IP |
The local IP address of the client for the network interface that it is using to transmit media. IP addresses are partially masked to preserve the personal identity of users. |
| Public IP |
This is the public IP address of the client as seen by the cloud. For enterprises this is the address of the firewall providing the NAT. IP addresses are partially masked to preserve the personal identity of users. |
| MAC addresses |
The MAC address of the client endpoint. |
| Geolocation |
Geo lookup of Public IP address. This address is not accurate, if connected over PNC. If the user is using the Webex App and connecting to the enterprise through a VPN, the location is not accurate. |
| ISP |
Internet Service Provider who provides network connectivity to the Webex Calling Cloud. |
| Network |
The type of network connection that the client used to exchange media. Possible values are:
|
| Audio Codec |
(Send or Receive) The media encoding and decoding format in use for the media that are transmitted by a client. |
| Video Codec |
(Send or Receive) The media encoding and decoding format in use for the media that are transmitted by a client. Applies only for a video call. |
| SIP Session ID |
Original (or initial) and Final Session IDs. |
| Trunk |
Only available when a local gateway is involved with the hop. Name of the inbound and outbound trunk. |
| Route Group |
Only available when a local gateway is involved with the hop. Name of the route group. |
| PSTN Vendor Name |
Only available when PSTN is involved with the hop. Name of the vendor. |
Some metrics are masked in the article screenshots to preserve the identity of the user.
From the hop details, you can:
-
View if the hop was routed through PSTN or a local gateway.
-
View the type of user that made or received the call. Some examples include
HuntGroup,VoiceMailGroup, andRoutePoint. The Detailed Call History report provides a list of all the possible user types. -
View insights about the call in these scenarios:
-
There was no-media for any of the hops related to the call.
-
The Path optimization setup was unsuccessful.
-
One of the hops failed or refused the call. Failed hops are marked as red and refused hops are marked as yellow. A reason is also given on why the hop failed or was refused.
-
-
Hover on the device to view the end-to-end call experience.
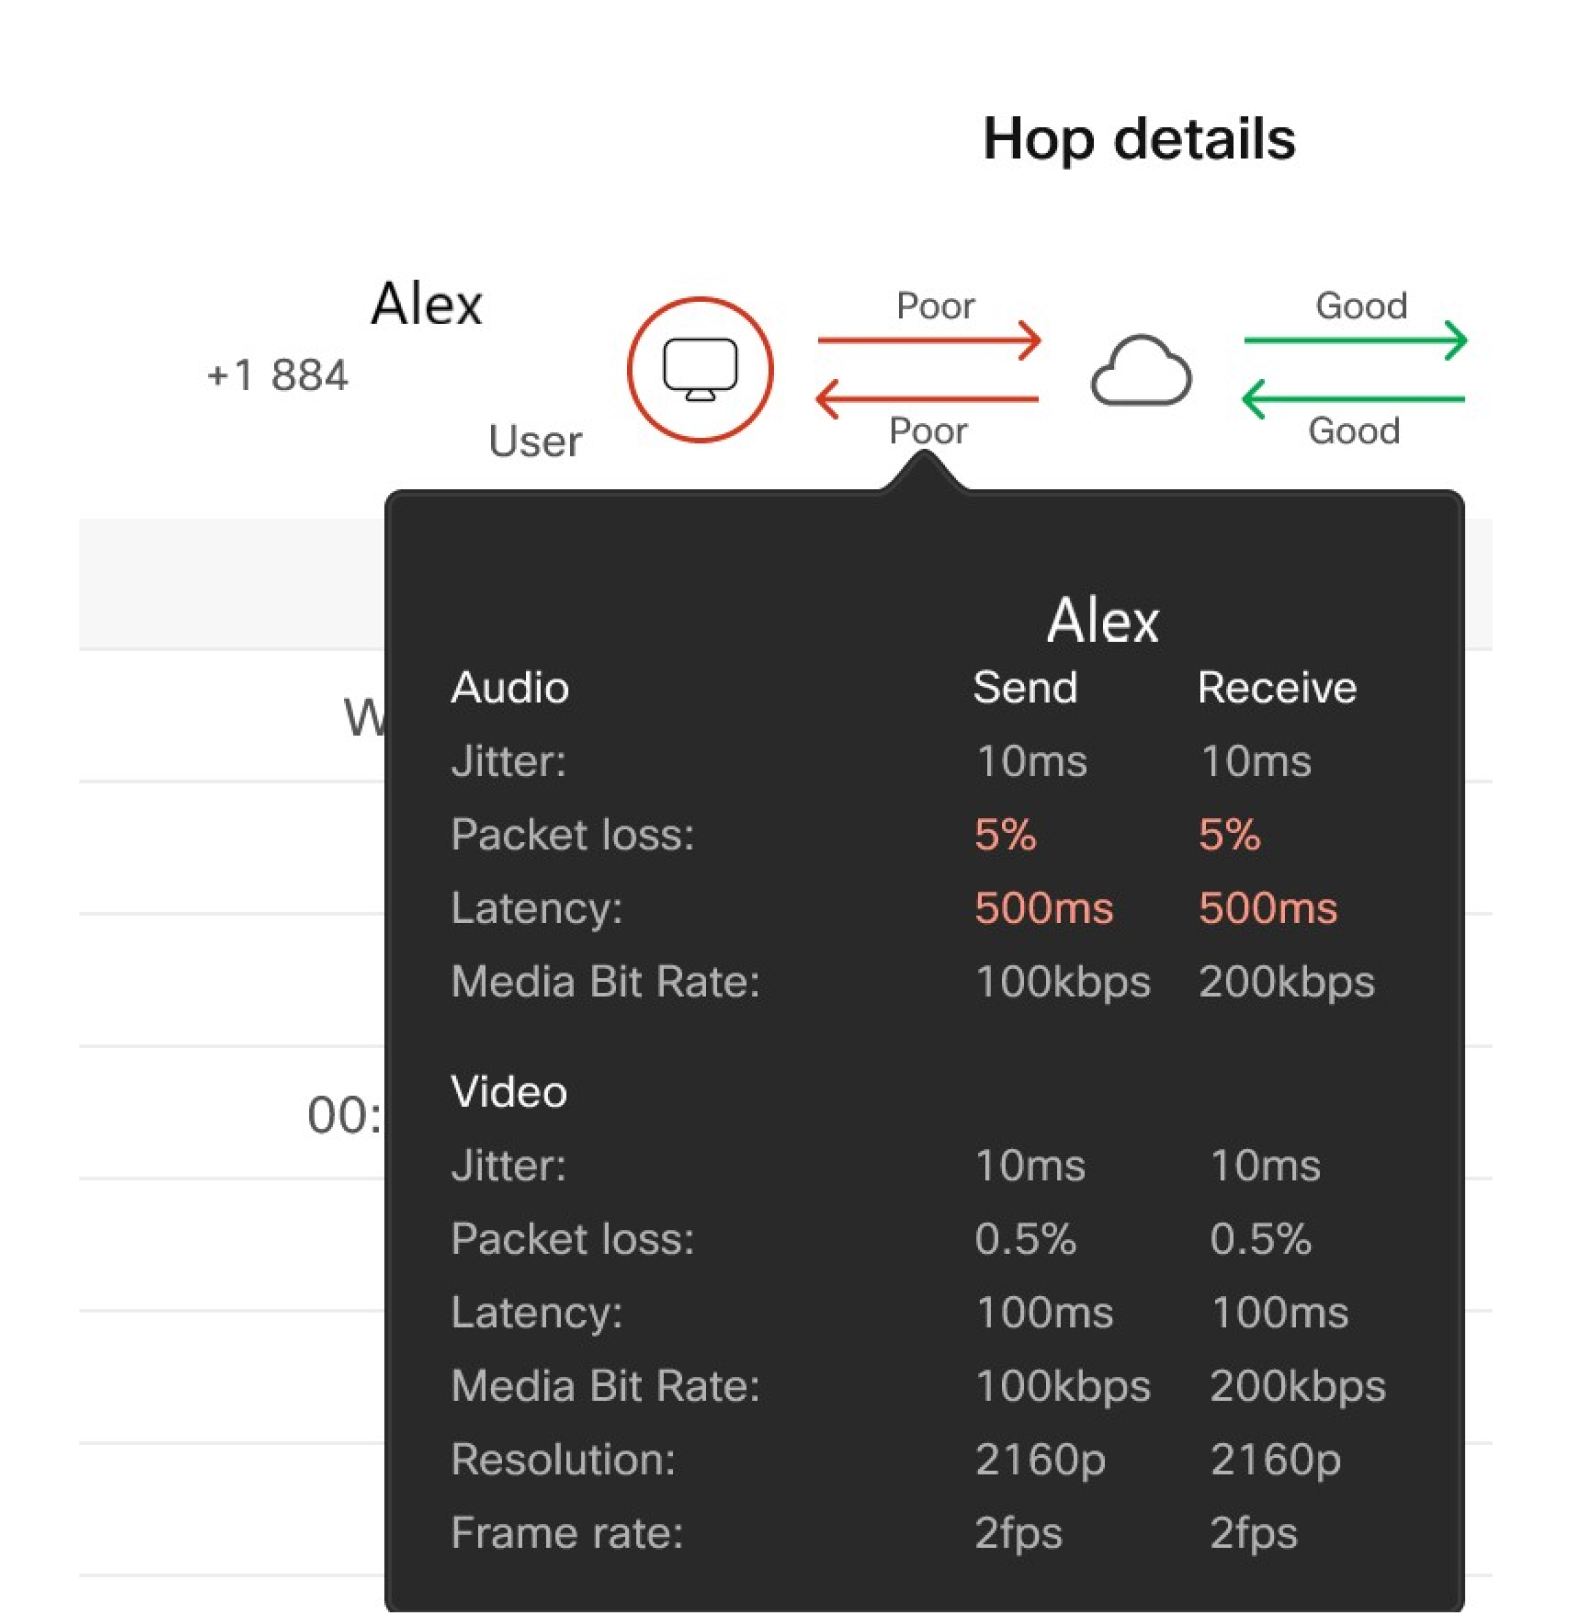
-
Hover on the hop between the endpoint and Webex Calling cloud to view the hop details.
The end-to-end call experience is based on the media quality data that is collected from each Webex Calling registered endpoint (Webex App or device such as 8865 or Desk Pro) at the end of the call. The call is graded as good if the endpoint has the following thresholds:
-
Packet loss less than 5%.
-
Latency or Round Trip Time (RTT) less than 400 ms.
-
Jitter less than 150 ms.
The quality of the hop is derived from data that are collected from the media relay point in the Webex Calling cloud. For PSTN calls through CCPP or local gateway, the data collection is from the Webex Calling cloud and not from the PSTN endpoint. A hop is graded as good if the media relay point has the following thresholds:
-
Packet loss less than 2.5%.
-
Latency or RTT less than 200 ms.
-
Jitter less than 75 ms.
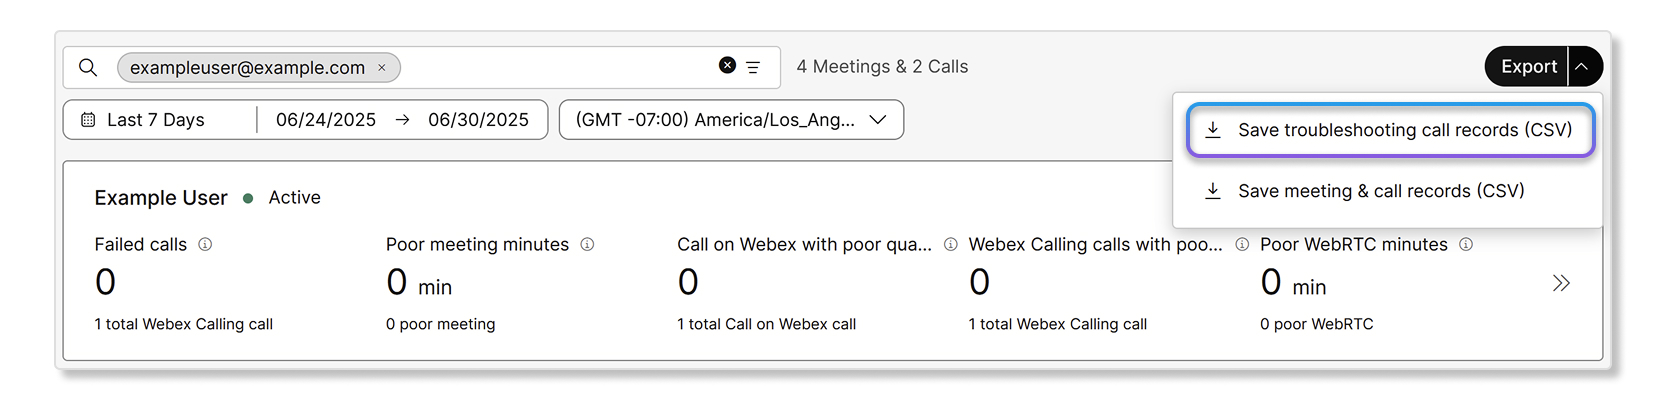
You can also save the data in the hop details by selecting Actions and then choosing one of the following options:
- Save troubleshooting call records (CSV)
- Save call report (JSON)
- Save participant details (CSV)
Call Details pane
The following data is available in the Call Details right pane of the hop details view:
| Term | Definition |
|---|---|
| Correlation ID | Correlation ID to tie together multiple call legs of the same call session. |
| Interaction ID |
A unique identifier used to tie together multiple call patterns linked by a service interaction. Example for consult and transfer call flow—When a user places an
active call on hold, initiates another call from the same app or
device, and then transfers the original call, both calls share
the same |
| Calling Date | The date when the call occurred. |
| Calling Time | The time of when the call started and ended, shown in the time zone that you selected in the search view. |
| Session Type |
The type of session that is supported. For example: Webex Call |
| Participants | The number of participants who joined the call. |
| Caller Name | Name of the caller. |
| Caller Email | Email address of the caller. |
| Caller Number | Phone number that the caller used during the call. |
| Audio | The type of audio used. |
| Video | Displays Yes if video is enabled by a participant. If video wasn't enabled at all, it shows No. |
| Path Optimization |
Specifies if the call path optimization applies to the call. The accepted values are:
|
| Calling Type |
Calling Type can be one of the following:
|
| Call Ended by |
User who ended the call. |
| Dialed Digits |
The keypad digits as dialed by the user, before pre-translations. |
| Related reason |
Indicates a reason for why the hop was created. For example, a
value of |
Access the Webex Calling troubleshooting view
Partial search is supported for email IDs, phone numbers, and call IDs. For phone numbers, you can enter the first three to eight digits and then press Enter to see matching entries. If you enter more than eight digits, the search will attempt to find an exact match. Note that if you copy and paste a phone number from elsewhere, you must include the +1 for the search to work.
To analyze a Webex call, perform the following:
| 1 |
Sign in to Control Hub and go to Monitoring > Troubleshooting. |
| 2 |
Search for the email ID, phone number, MAC address, call IDs, or the correlation ID you’d like to view. You can group related calls together in the search view by using the correlation ID. |
| 3 |
Apply a filter of your choosing. The filters available are:
Filters aren't available if you search for phone numbers or correlation IDs. |
| 4 |
Click a specific call to inspect the hop details view. |
Download search results or Troubleshooting call records as a CSV file
You can download the search results or Troubleshooting call records as a CSV file. These records provide call leg level details to help troubleshoot a call.
You can export up to 100 Troubleshooting call records per CSV file.
When you click on download, it will download the search results for the tab that you're on. So if you want to download Webex Calling records, make sure that you’re on the Webex Calling tab.
| 1 |
Sign in to Control Hub and go to Monitoring > Troubleshooting. |
| 2 |
Once you have a list of calls that you want to view, select or Download troubleshooting call records (CSV).
You can also download the troubleshooting records from the call details page. Here you can download the troubleshooting call records, the call report in a JSON format, and the participant details as a CSV file. |
Troubleshooting media quality issues
The hop-by-hop view helps you to locate where the problem occurred. Now that you’ve found where the problem is, and with the metrics (jitter, packet loss, latency) you can try the following to troubleshoot the issue.
Typical possibilities for media issues are:
-
Network/ISP/location specific issues—Due to firewall, network configuration or bandwidth there’s a pattern of poor experiences in a particular location or network subnet. Use the per call troubleshooting view (identify the location associated with the poor session) with the analytics view to review the aggregate patterns for the location.
-
User specific issues—A user or device is connected on a poor network (for example, Wi-Fi or working from home) which means their experience is impacted by the associated network capabilities. See the Use CScan to Test Webex Calling Network Quality article to identify the issue with the network.
-
Call type specific issues—A user’s poor experience is because of the quality on the far end. This is typical in PSTN scenarios where the user is talking to another user on a mobile network and the session has high packet loss on the PSTN network.
-
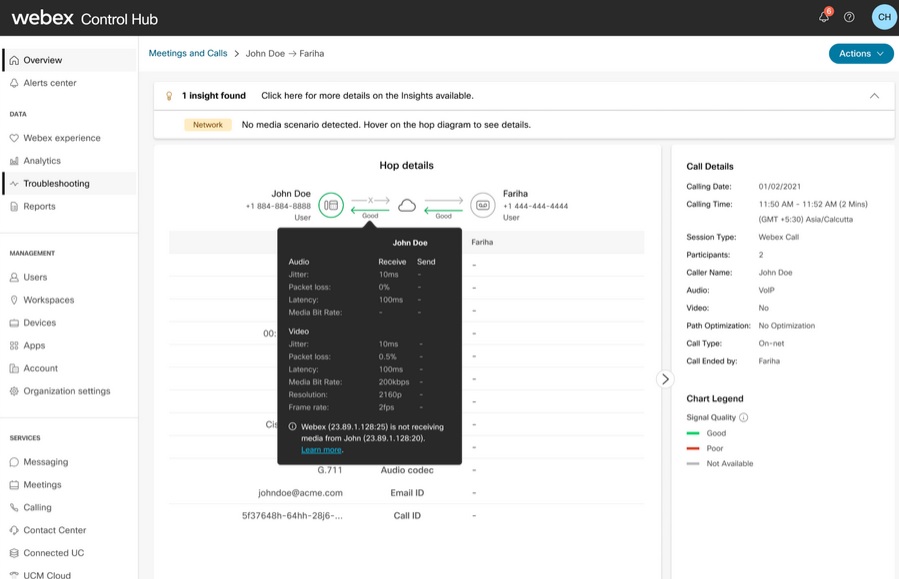
No-media issue—There may be no media transmission in some hops. The Insights banner displays the cause at the top of the Hop details page and the liable party in the information box of the hop detail page. Some of the possible causes for no-media in calls along with liable parties are listed here:
-
Webex not receiving media from the sender.
-
Webex not receiving media from the receiver.
-
Webex not receiving media from either direction.
-
Webex not sending media to the receiver. Webex engineering addresses this issue.
-
Webex isn’t receiving media from Cloud PSTN. Webex engineering addresses this issue.
-
Webex isn’t receiving media from cloud service. Webex engineering addresses this issue.
-
Webex isn’t receiving media from Local gateway. Customer administrator must investigate the issue.
-
-
Media Path Optimization Failure—Few calls cannot successfully set up media path optimization. The Insights banner displays the cause for unsuccessful ICE calls and the resolution at the top of the Hop details page.
Some of the possible reasons are:
-
ICE unsuccessful due to stun server access - see Webex Calling Port Reference Information.
-
ICE unsuccessful due to connectivity check - verify connectivity between networks.
-
ICE unsuccessful as the default path round trip time was similar/better than any optimized path.
-
Webex Calling captures and processes media quality metrics sent by the following supported third-party devices:
-
Polycom
-
Yealink
-
AudioCodes
Administrators can view the last-hop media quality summary and analysis including latency, jitter, and packet loss for calls involving supported third-party devices in the hop-by-hop view. This provides the similar experience to what is available for Cisco devices.
Limitations
Media quality metrics and originating and terminating flows from the network side aren’t available for the following devices:
-
Analog phones
-
IPv6 endpoints
Media quality metrics aren't currently supported for customers based in India. Support for those customers is planned for a later date.
Minute-by-minute view
You can drill down in a participant's media quality session line to see the quality of their media session on a minute-by-minute basis. This granular view allows you to pinpoint where within the call that a participant had issues and help determine what the root cause was.
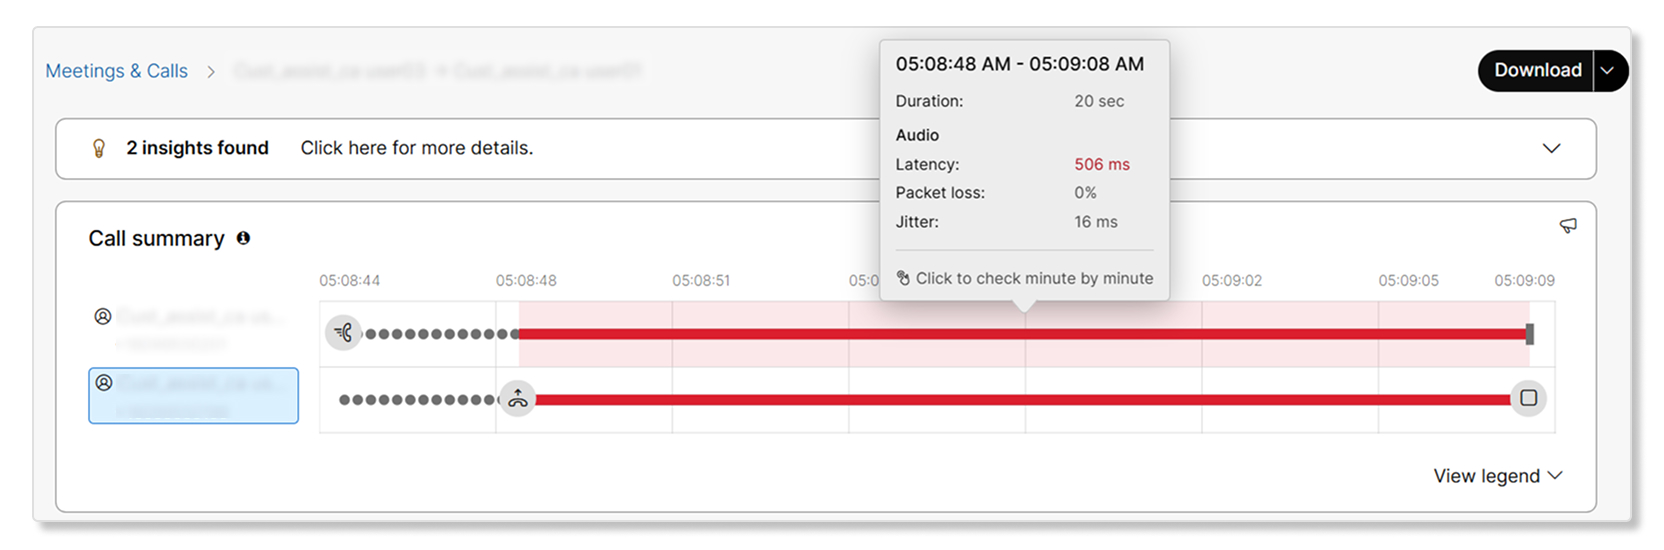
The minute-by-minute view is only available for calls handled through Webex Clients and RoomOS endpoints. Support for PhoneOS clients will be available in the future. This view isn't available for MPP and Cisco-managed 3rd party endpoints.
The existing media quality experience marks the quality of a media session as good or poor for the overall session based on our defined thresholds of latency, jitter, and packet loss. The minute-by-minute media quality view allows you to drill down into the quality of a media session at a per-minute level. This is especially helpful in the case of longer calls where the media session for a user would have been poor for only a few seconds to a minute but the call was still marked as poor.
Admins can cross launch into the minute-by-minute view by clicking on a media session from the call sequence view. You can further see the threshold values by clicking on a segment of the media session within the minute-by-minute view.
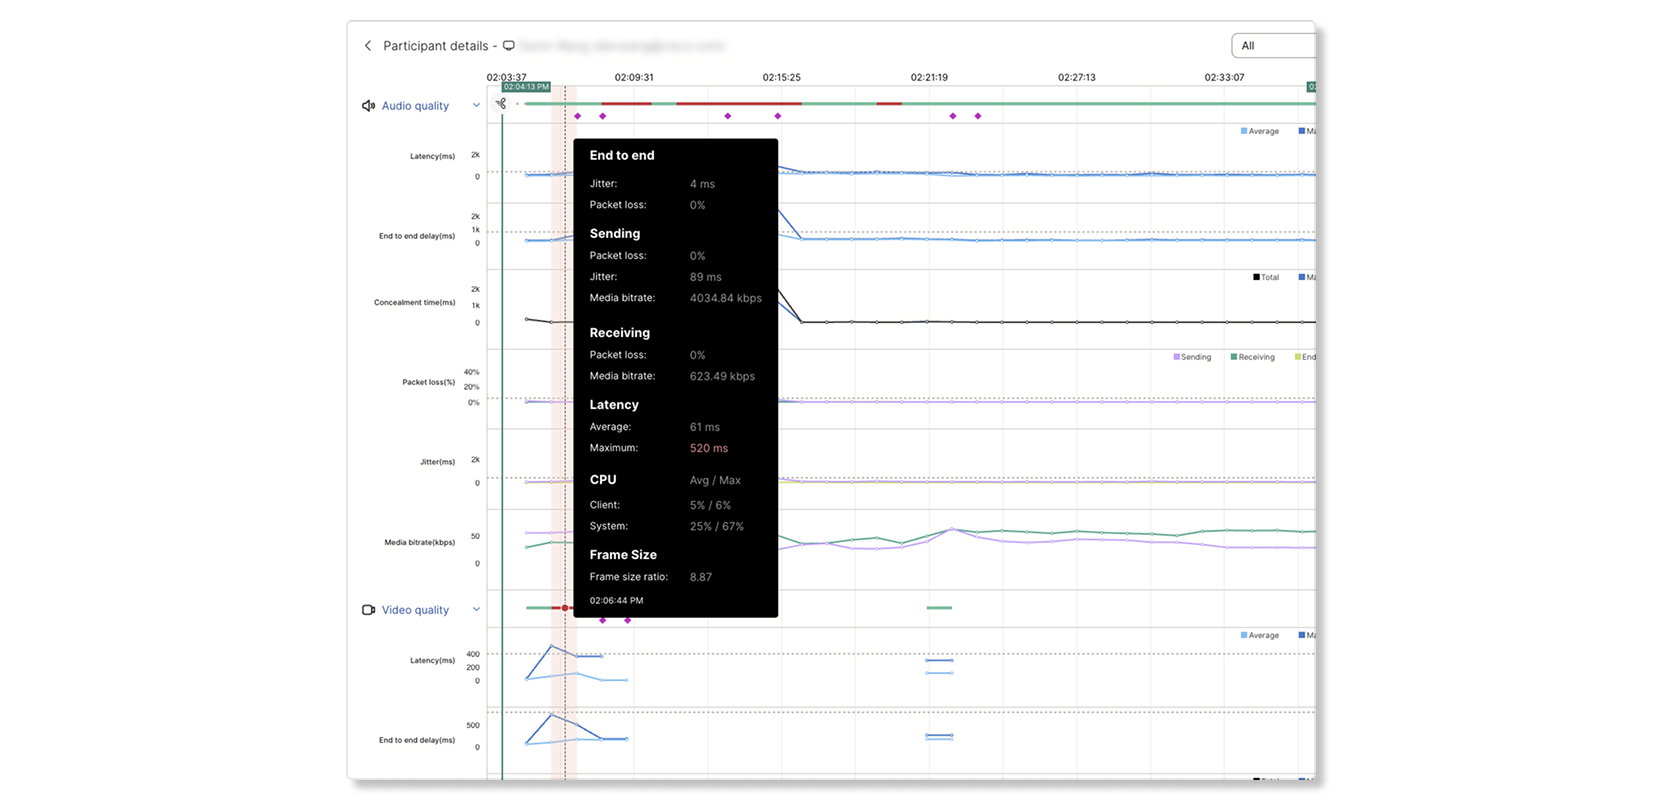
The minute-by-minute metrics available are:
- Audio quality—Latency, packet loss, jitter, media bitrate
- Video quality—Latency, packet loss, jitter, media bitrate, frame rate, resolution
- Share quality—Latency, packet loss, jitter, media bitrate, frame rate, resolution
- CPU usage—System CPU, Webex App CPU
- Memory usage—System memory, Webex App memory
- Network and equipment—Client, platform, connection, media node, audio transport, video transport, audio codec, video codec, etc.
The minute-by-minute view only displays available metrics. For example, if a call didn't have any sharing, then the share quality won't be displayed.
Supported Call Flows
The media quality reports are collected from the caller and callee endpoints and the media relay points. This allows a segmentation of the media experience to narrow down and identify whether the issue occurred at the:
-
Caller or callee
-
Media path to or from the Webex Calling cloud.
Call legs appear if there was a media session that is established with at least one Webex Calling registered endpoint on the call. For example, for an outbound call from hunt group to eight agents, if only one agent answer, then there is no media experience to troubleshoot for the other seven agents.
There are five types of media experiences or paths for Webex Calling troubleshooting, which are:
-
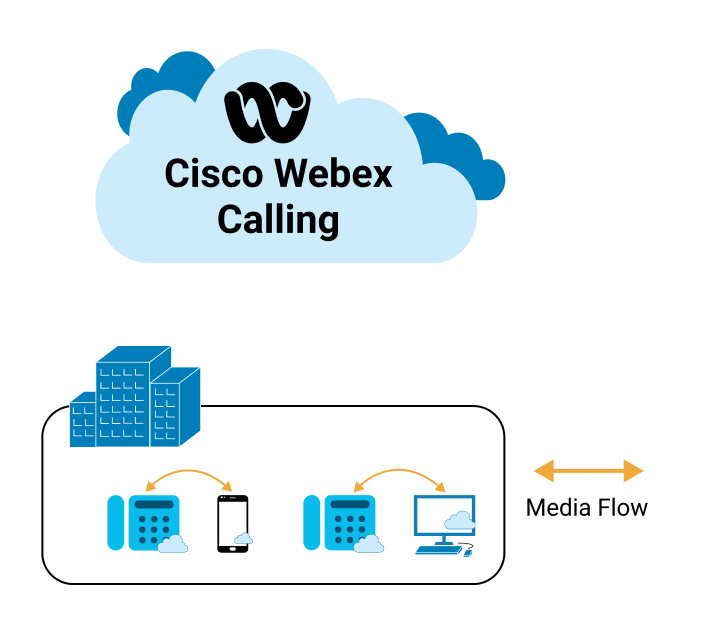
On-net Optimized – Calls within the organization where ICE is successful and the media flows directly between the users. See Webex Calling Media Optimization with Interactive Connectivity Establishment (ICE) for detailed information.
-
On-net Unoptimized – Calls within the organization where Interactive Connectivity Establishment (ICE) was not possible or established. In this scenario, the media flows through Webex calling cloud.
-
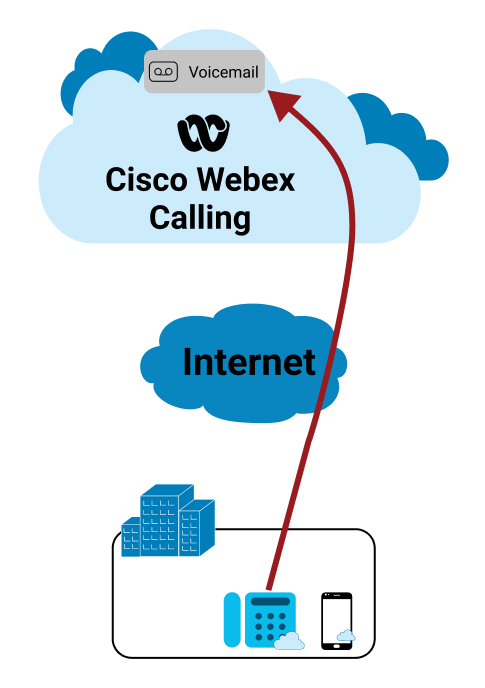
On-net Cloud Hosted – Calls within an organization where media is provided by a media server that is hosted in the cloud (for example, listening to voicemail, dialing into an auto attendant).
-
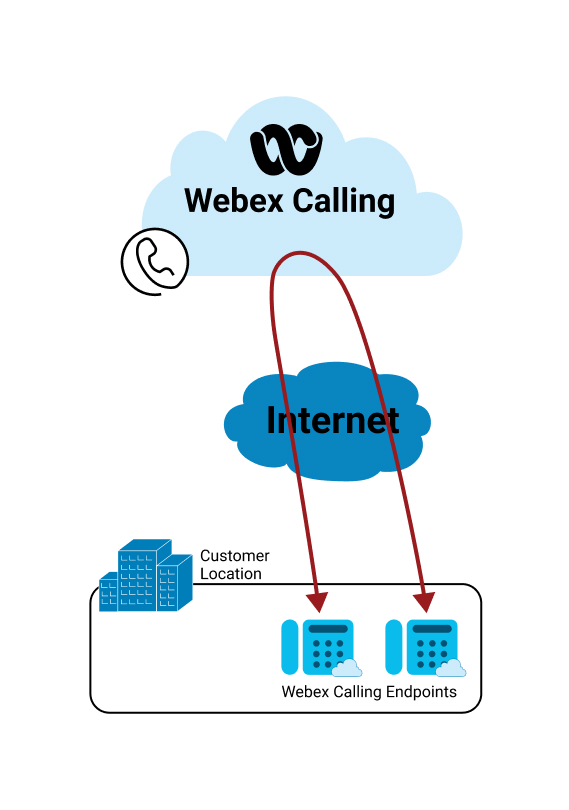
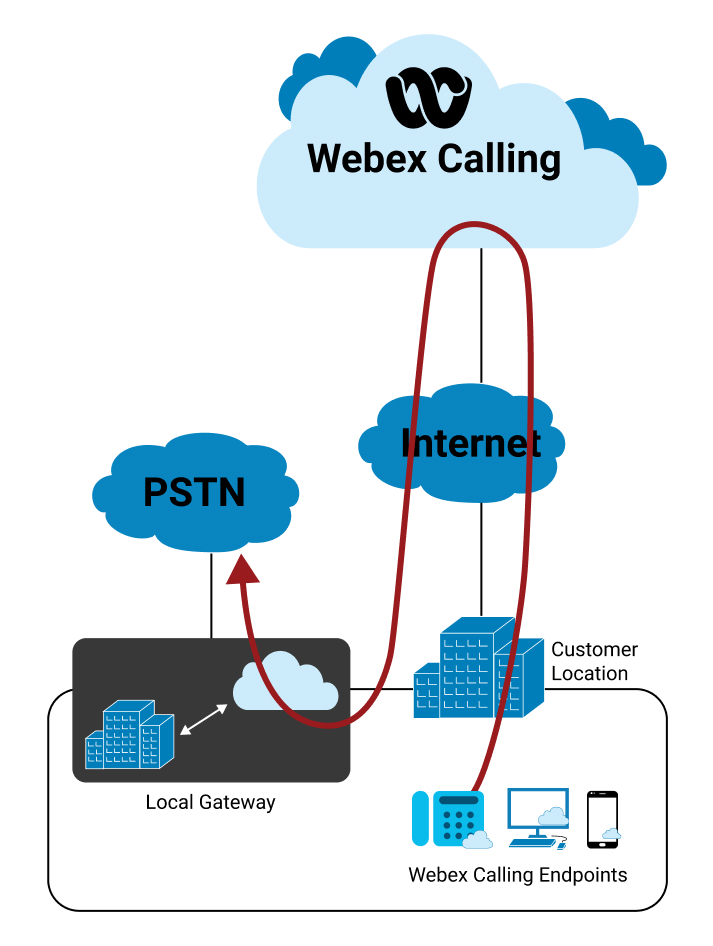
Off-net Call to or from the Webex Calling registered endpoint -
-
via Cloud Connected PSTN Provider- Inbound and outbound calls of an organization where the other party is on the PSTN network. The media is relayed through a cloud connected PSTN provider (CCPP), over a high-quality interconnect.
-
via Local Gateway- Inbound and outbound calls of an organization where the other party’s media is through the enterprise. Behind the local gateway the media session can be from enterprise hosted user (for example, registered to call control in the enterprise) or from PSTN, where PSTN is provided by the enterprise.
-
If there are 1 or 2 Webex Calling registered users who are involved in a point-to-point on-net call, then the troubleshooting view presents metrics for one or both the parties. If the call is off net (User 1 receives a call from a PSTN user), then the troubleshooting view presents only User1's client metrics, along with the metrics taken from the media relay point.
Most of the call scenarios in the troubleshooting view show two call legs (caller and callee); however, some of the call scenarios (such as call park or retrieve) show only one call leg. In such cases, the other call leg shows up separately in the troubleshooting view. This does not hinder troubleshooting the call and detecting where the problem occurred. However, it does require the admin to manually correlate the two call legs using a common entity such as overlapping time. Future enhancements to the troubleshooting view will eliminate the need to use manual lookups.
The hop metrics vary during a session depending on the sampling time and variability in the network. The values that are reported by the media relay point and the clients (end-to-end experience) may not align. However, they should be in close alignment to allow segmentation along the path.
The media quality reports are collected from both Cisco devices and supported fully managed third-party devices, allowing for a consistent segmentation of the media experience across the caller and callee paths.
We recommended using the individual call troubleshooting view with the aggregate information that is derived from Analytics.
Let’s analyze the call quality for the different call types using the troubleshooting view.
Calls within the organization where ICE is successful and the media relay in the cloud is removed from the path. The media flow is directly between the user's devices.
Inference:
| 1 |
The call is graded as good as both the caller and callee have good end-to-end experience. |
| 2 |
The administrator can observe that media flows directly between the two users and does not travel through Webex calling cloud. Optimized call flows can have a poor experience, if the enterprise or local network is the source of the issue, since the media between the two users will traverse the local network. Latency or RTT is always lower on an optimized call but packet loss and jitter can still be a factor depending on the network between the two users. |
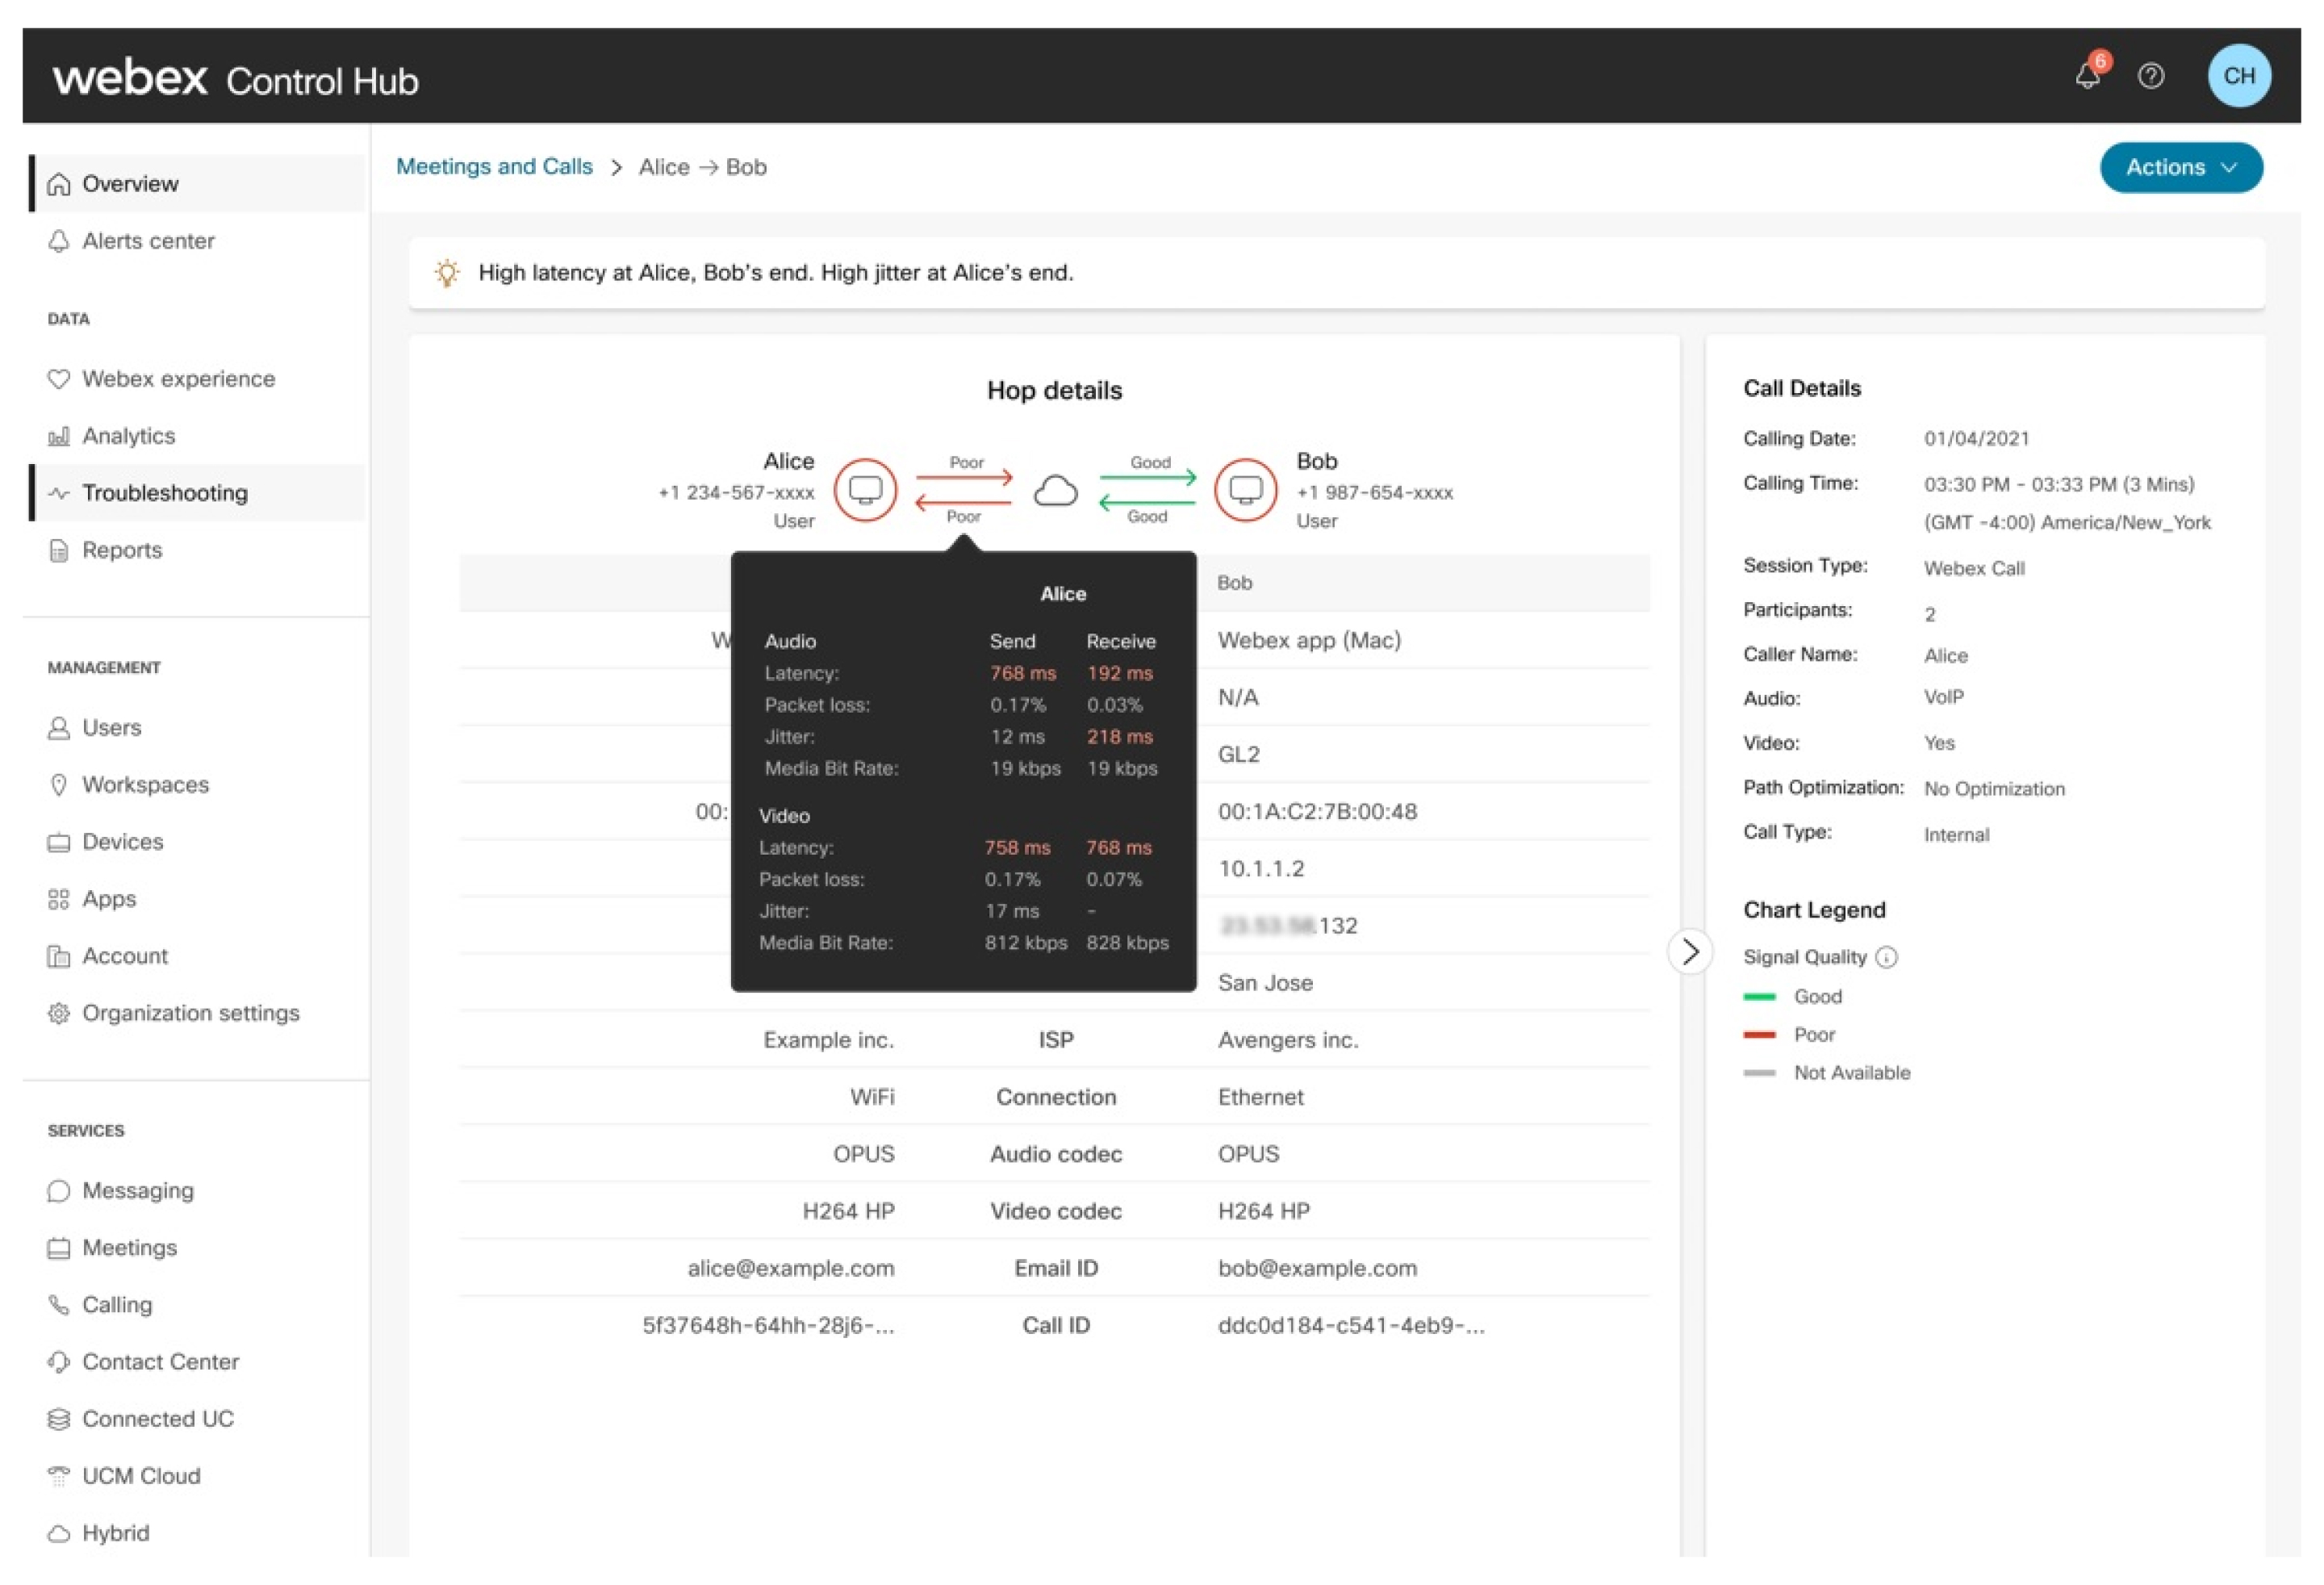
Inference:
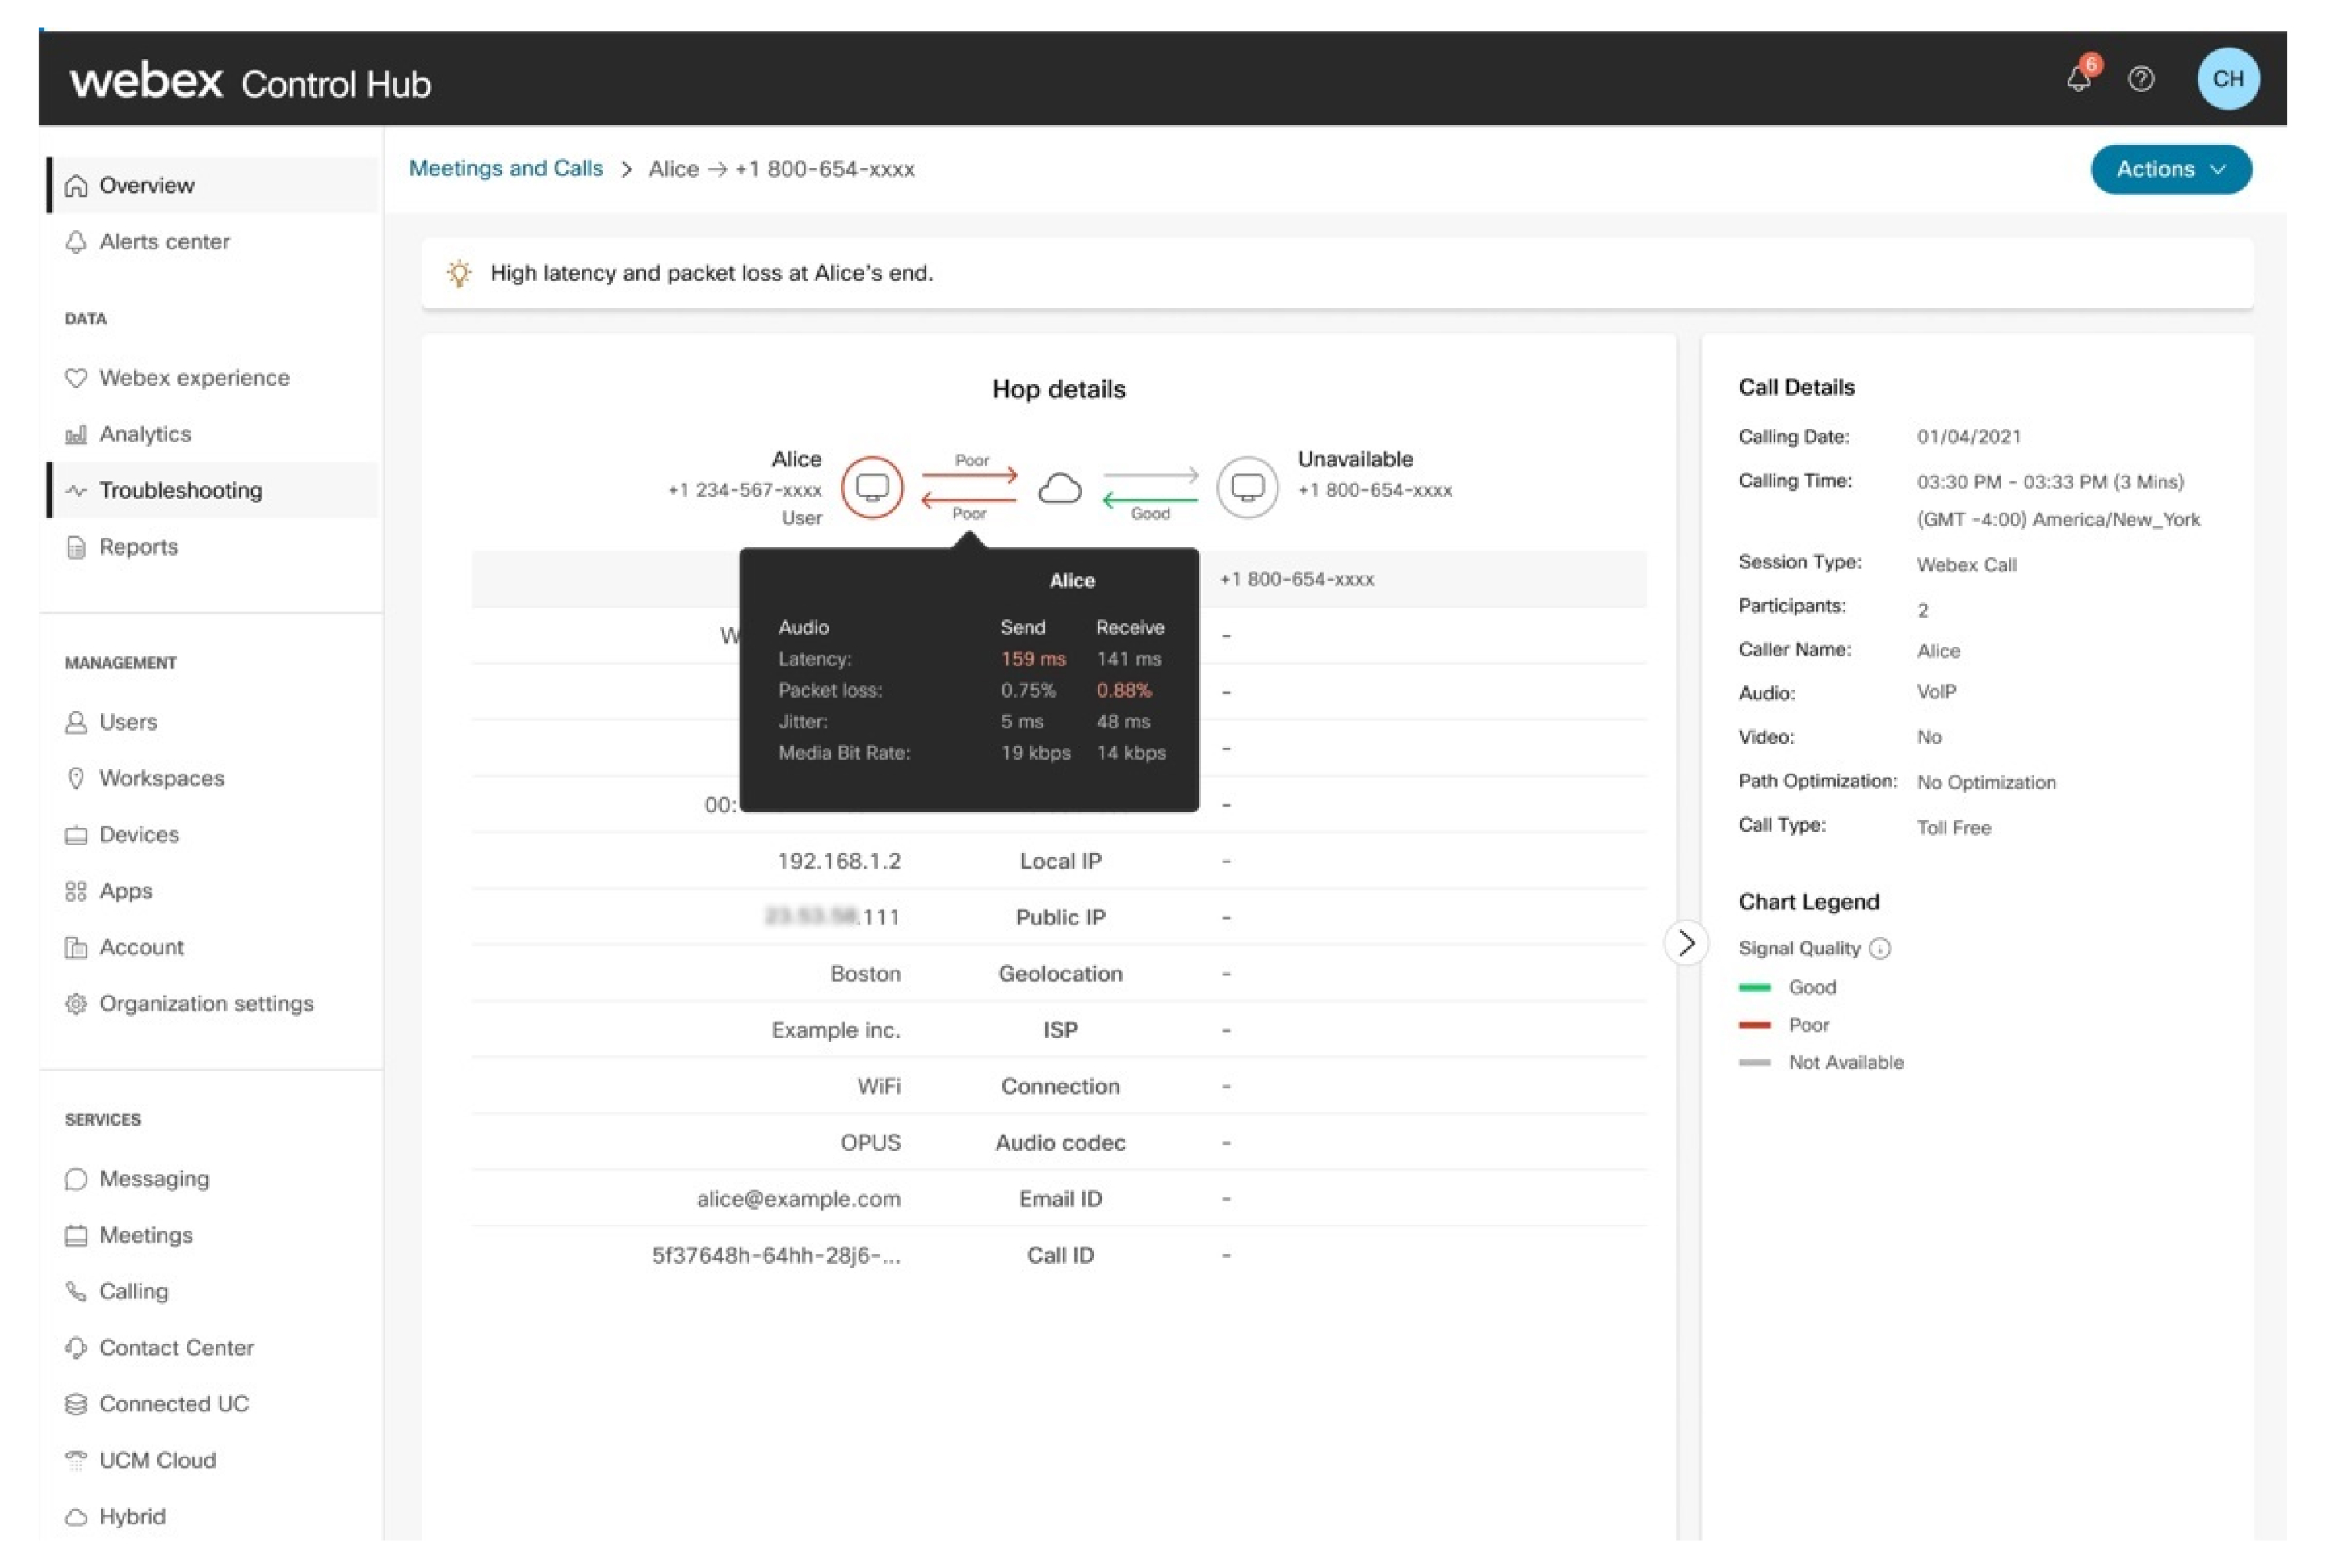
The administrator can observe the following:
| 1 |
The caller’s end-to-end experience is graded as poor. |
| 2 |
There is a problem with the caller's network hop that affects both the send and the receive stream. |
| 3 |
The callee’s network hop does not have an issue. |
| 4 |
The callee’s end-to-end experience is graded as poor due to the issue from the caller. |
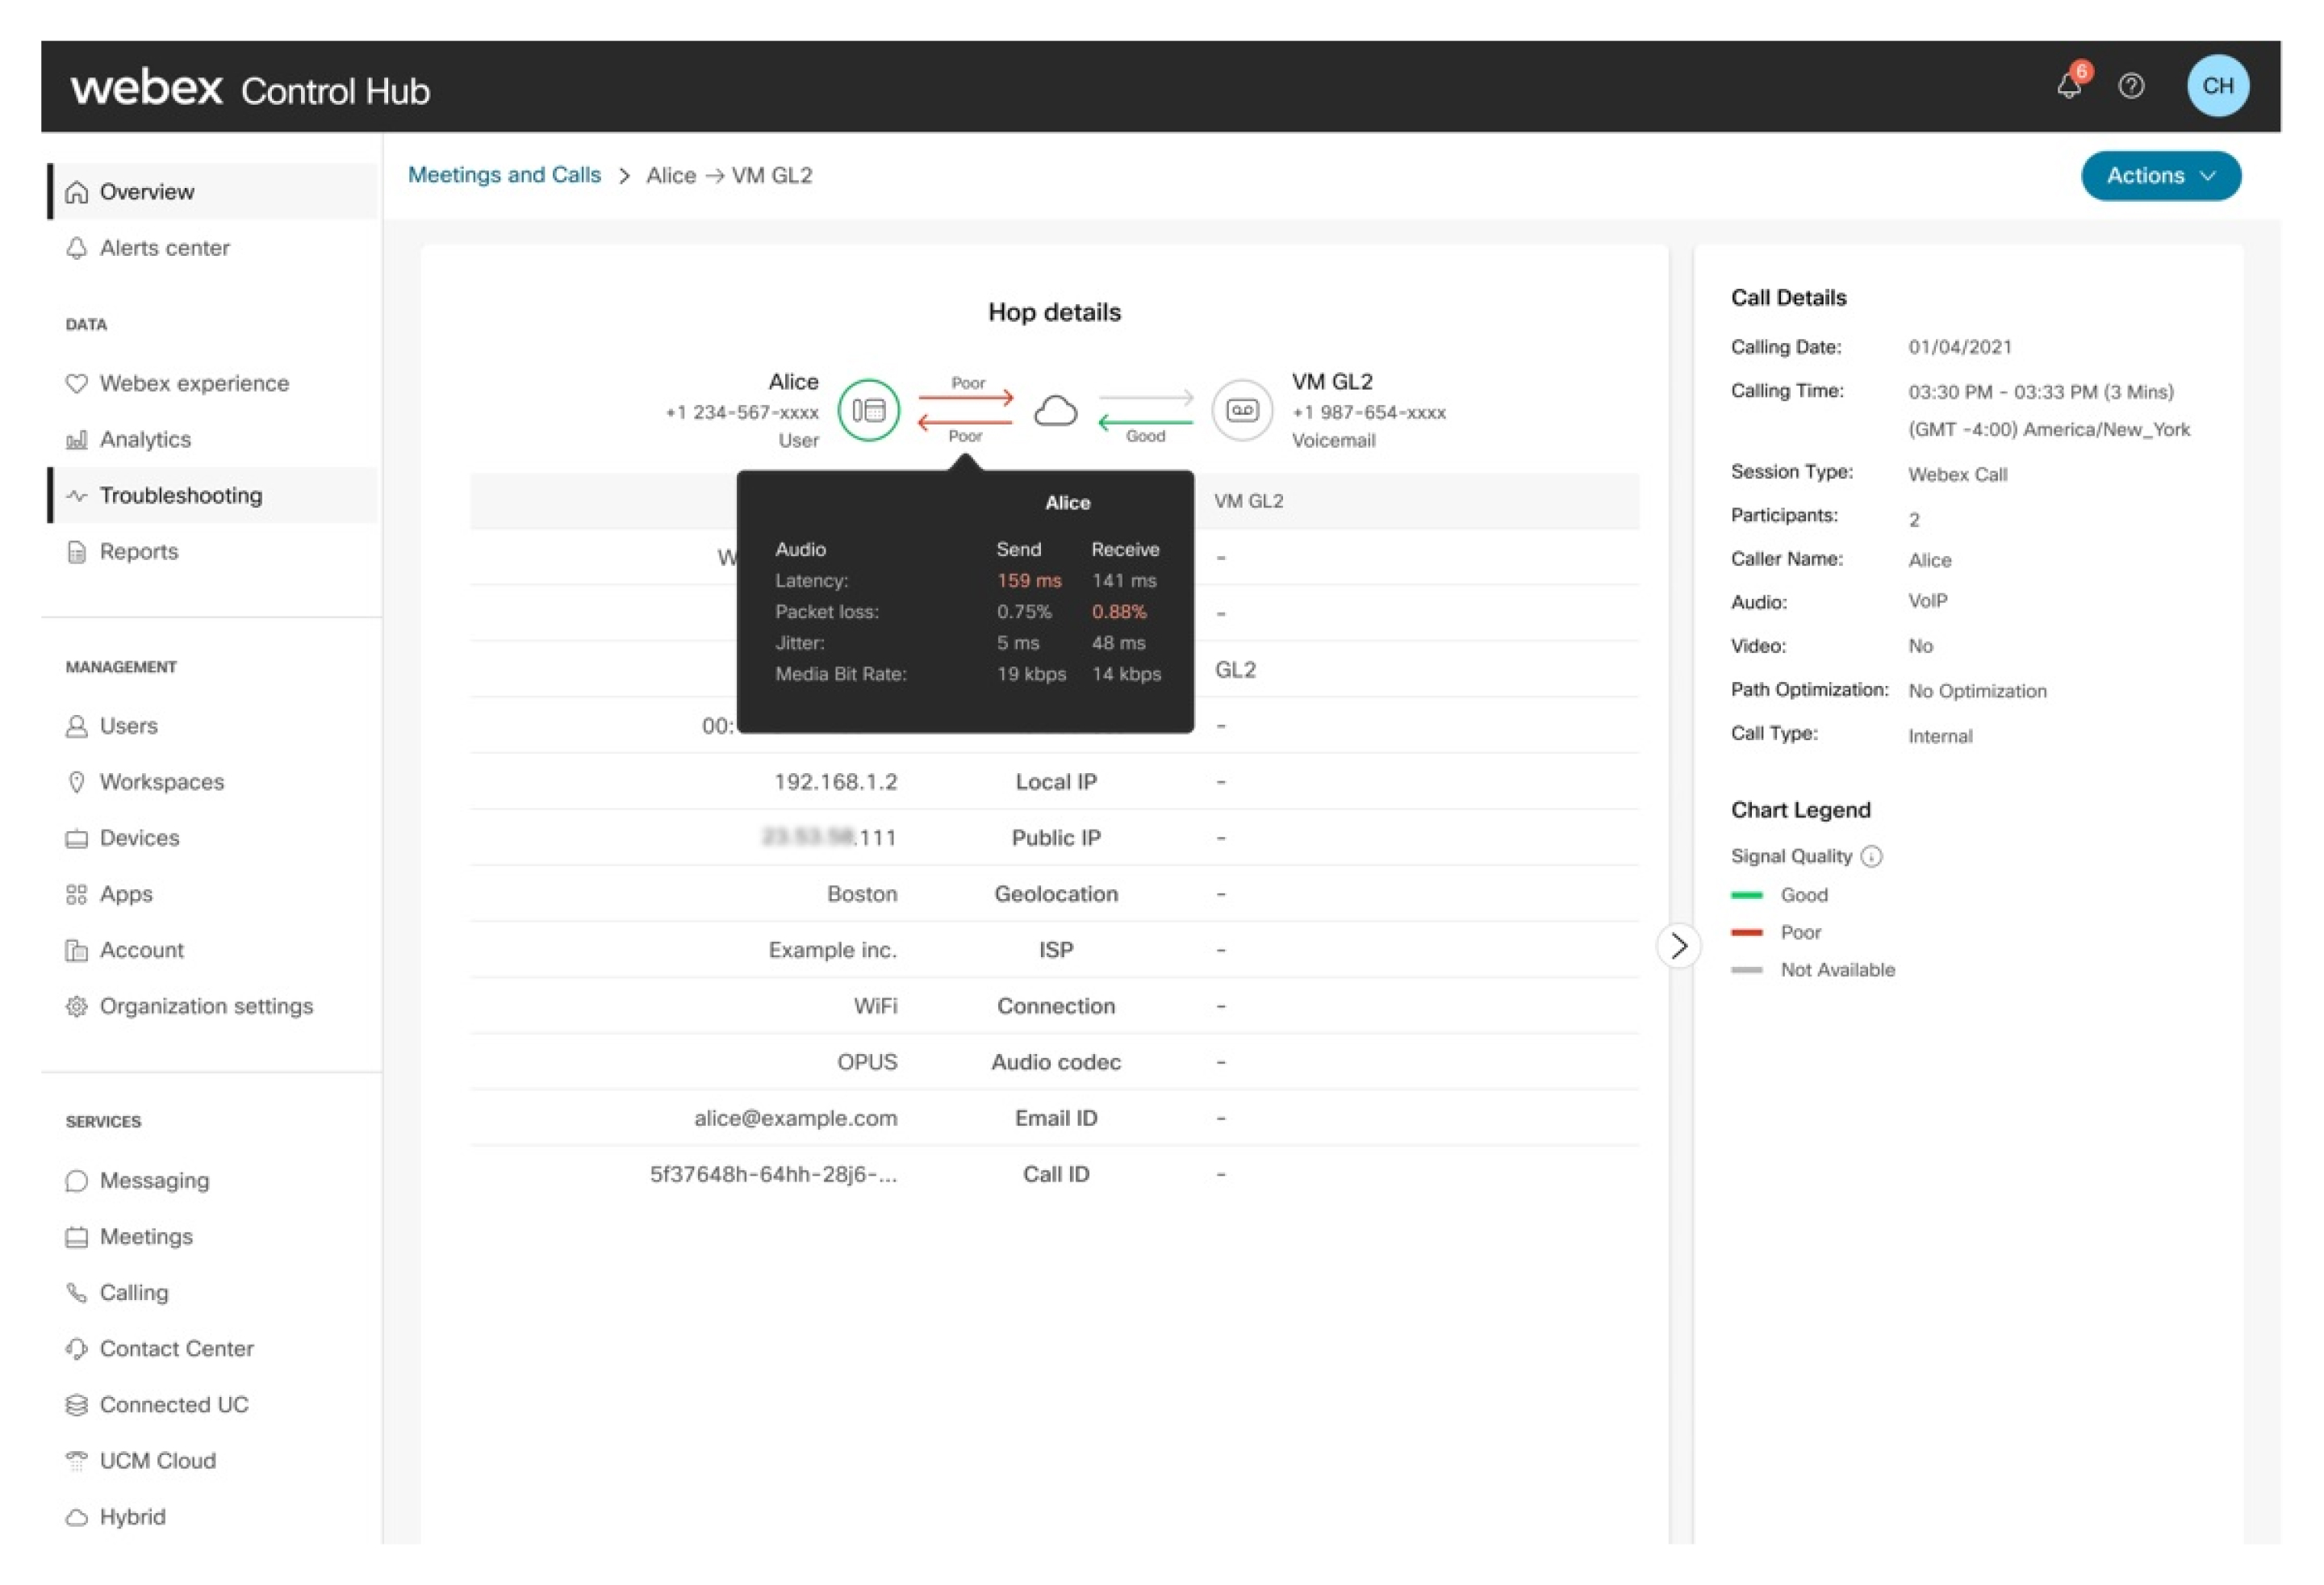
Inference:
The call is graded as good as the caller’s end-to-end experience is within the accepted thresholds. The administrator can observe that the following:
| 1 |
The network hop for the caller is graded as poor as some of the metrics are above the acceptable threshold. |
| 2 |
The send stream from the voicemail is graded as good per the metrics collected from the media relay point. |
| 3 |
The media server used to collect or deposit the voicemail does not currently report metrics. However these servers are hosted and managed as part of the Webex Calling Cloud so the quality of that link segment is internal and always high quality, low latency. |
| 4 |
The administrator can observe the caller’s end-to-end experience is graded as good although the hop is graded as poor. This is due to the callee's hop having a good network that compensates for the performance degradation of the caller's network. |
In the example, the client media is coming from a PSTN provider through the cloud.
The call is graded as poor as the callee’s end-to-end experience is not within the accepted thresholds. The administrator can observe the following:
| 1 |
The problem is with the caller’s PSTN hop specifically with the sending stream. |
| 2 |
The callee’s network hop does not have an issue. |
| 3 |
The callee’s end-to-end experience is graded as poor due to the issue from the caller. |
| 4 |
The end-to-end experience and the receive stream metrics of the caller who is on the PSTN network are not currently available as these metrics are not transmitted to the Webex Calling Cloud. |
Calls in and out of an organization where the caller's media is coming from an enterprise. The media session can be from an enterprise hosted user (for example, registered to UCM) or from PSTN, where the PSTN is provided through the enterprise.
Inference
The call is graded as poor as the caller’s end-to-end experience is not within the accepted thresholds. The administrator can observe the following:
| 1 |
There is a problem with the caller’s hop to the Webex Calling Cloud both on the send and receive stream. |
| 2 |
The caller’s end-to-end experience is graded as poor either due to the issue observed in the hop or the issues at the user’s end (devices, network, and so on.) |
| 3 |
The incoming traffic to the Webex Calling Cloud from the callee’s end is graded as good. |
| 4 |
The end-to-end experience and the receive stream metrics of the callee who is called from the local gateway are not currently available as these metrics are not transmitted to the Webex Calling Cloud. |
Troubleshooting failed and refusal calls
The Call Status column indicates if a call was successful, refused, or failed. When a call has a Refusal or Failure status, you can hover over the status to see the relevant code.
When you drill down to a user's list of calls, a Failed call KPI is available to quickly identify if that user is experiencing significant issues. You can hover over the Refusal or Failure status to view the specific code associated with each status.
In the hop details view, a banner is displayed to show you more information about why the call has a Refusal or Failure status. You can also see if the call status happened during the originating or terminating hop.
Example of failed call scenarios
Failure Code: No route to destination
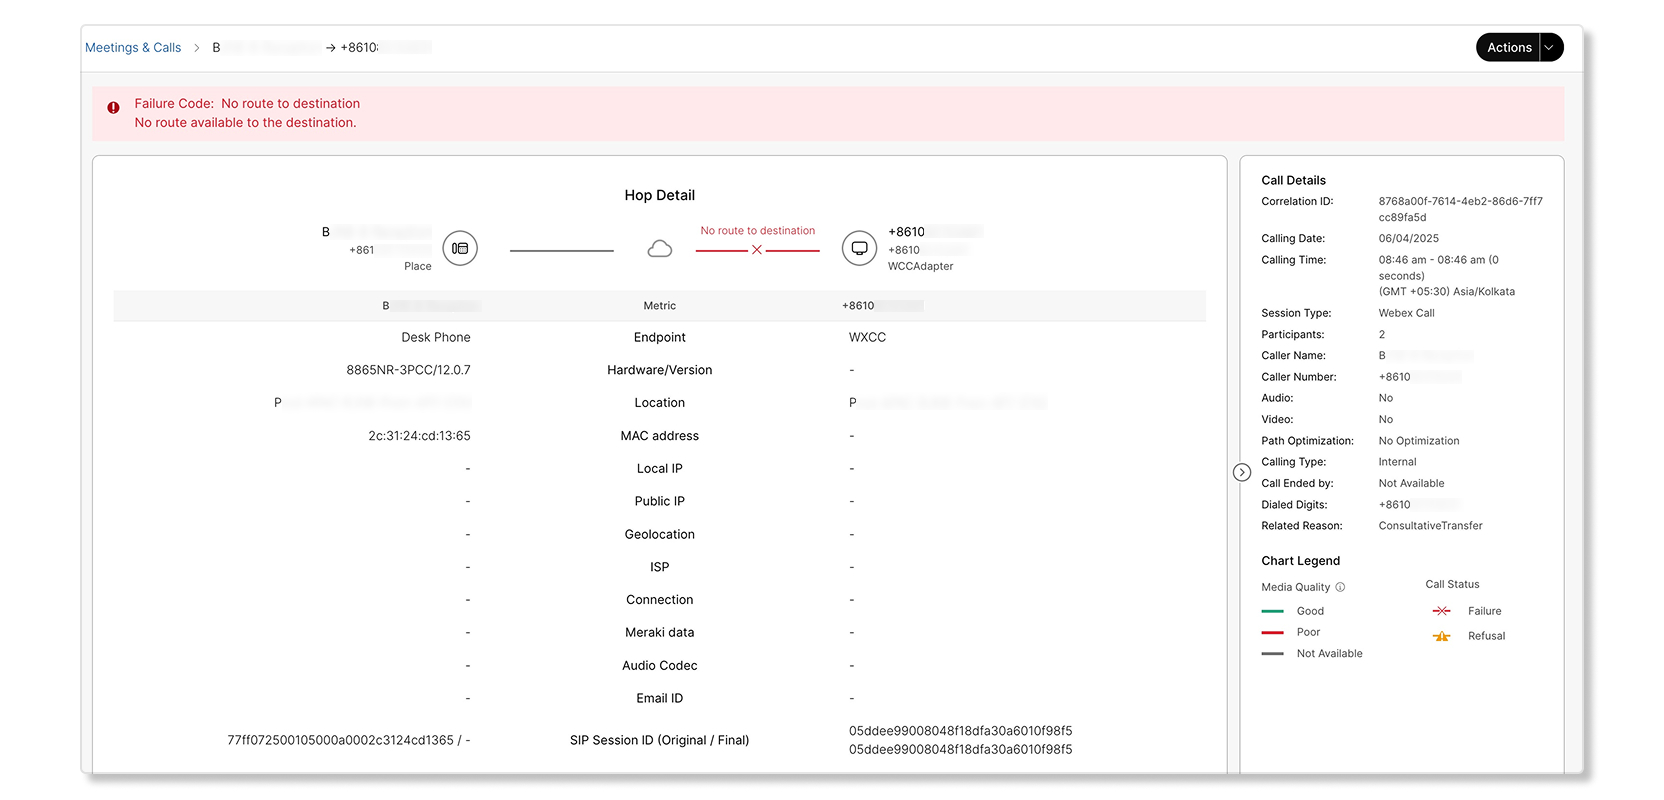
A call attempt was made by a workplace device but failed due to having no route available to the destination.
Failure Code: Protocol error
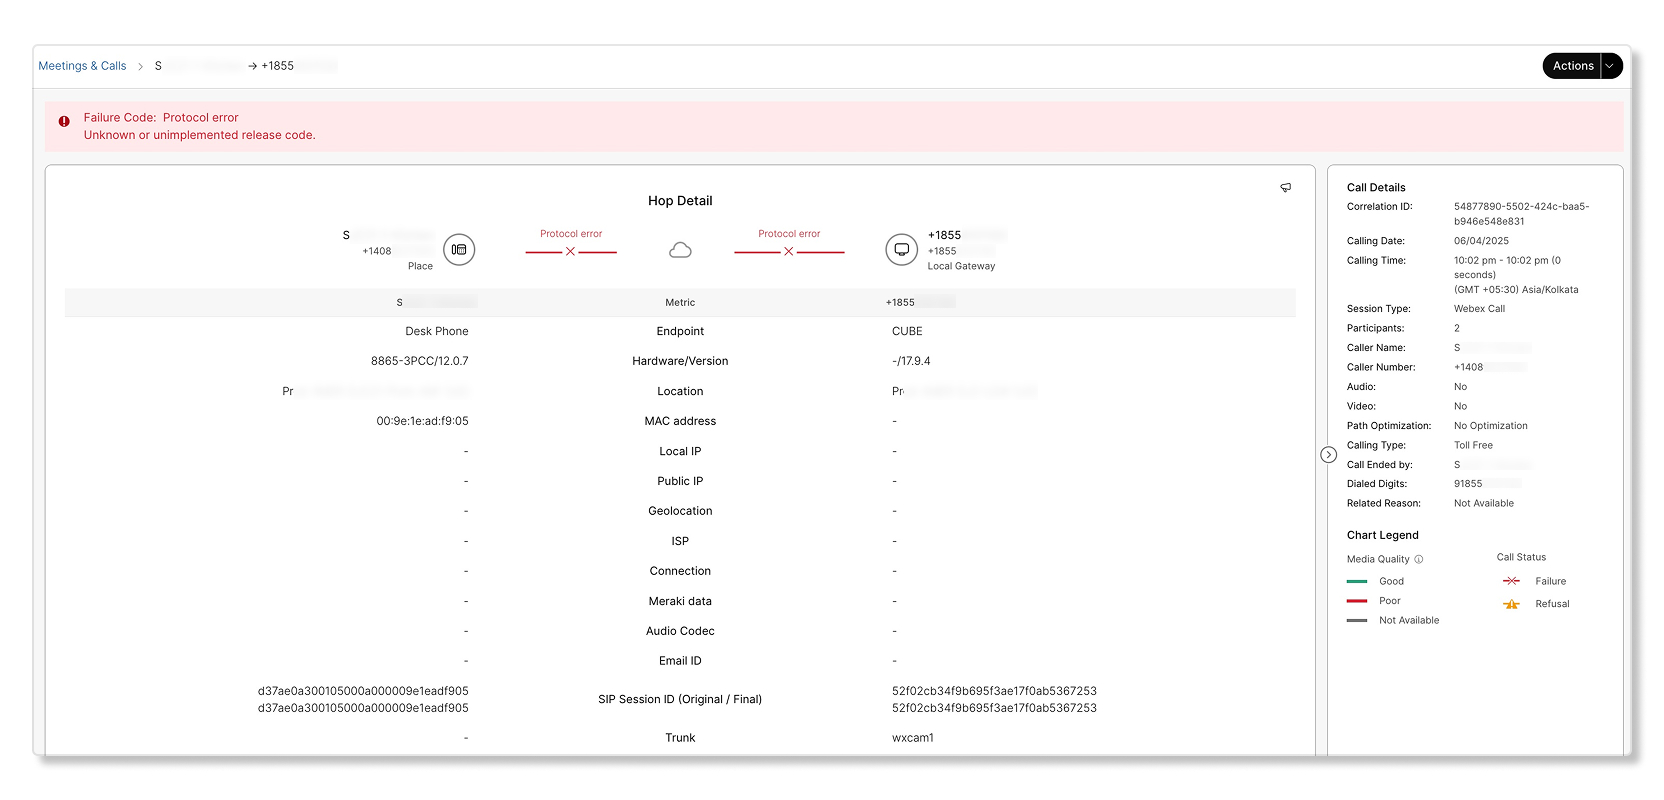
A call attempt was made by a workplace device but failed due to a protocol-related error.
Failure Code: Internal error
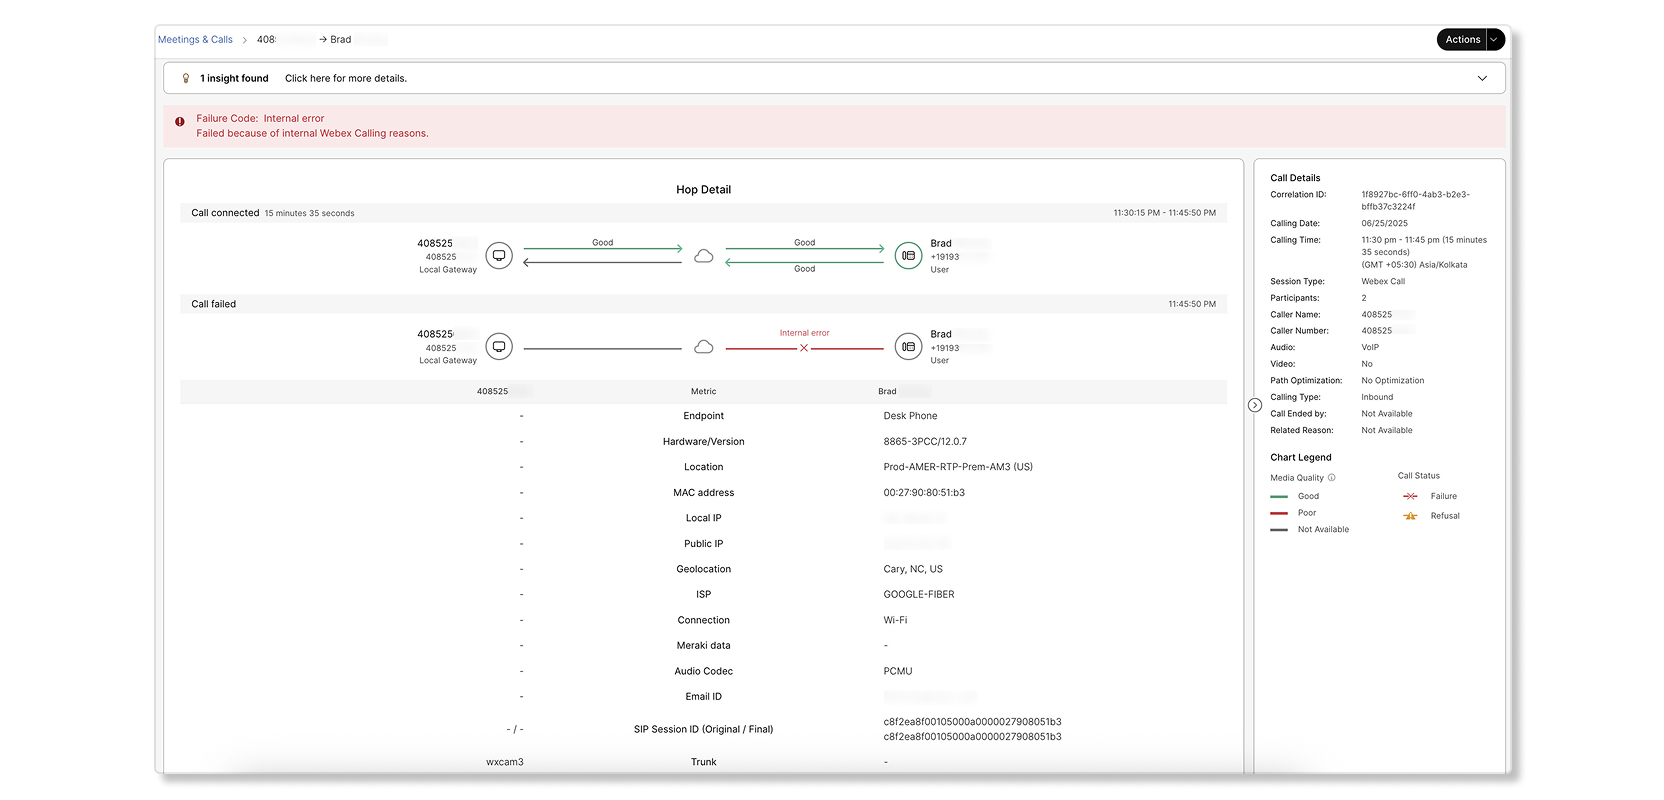
A call was made from a local gateway but failed due to internal errors with the workplace device at the destination. The call was established for 14 minutes before resulting in an internal error.
Example of refusal call scenarios
Refusal Code: Call rejected
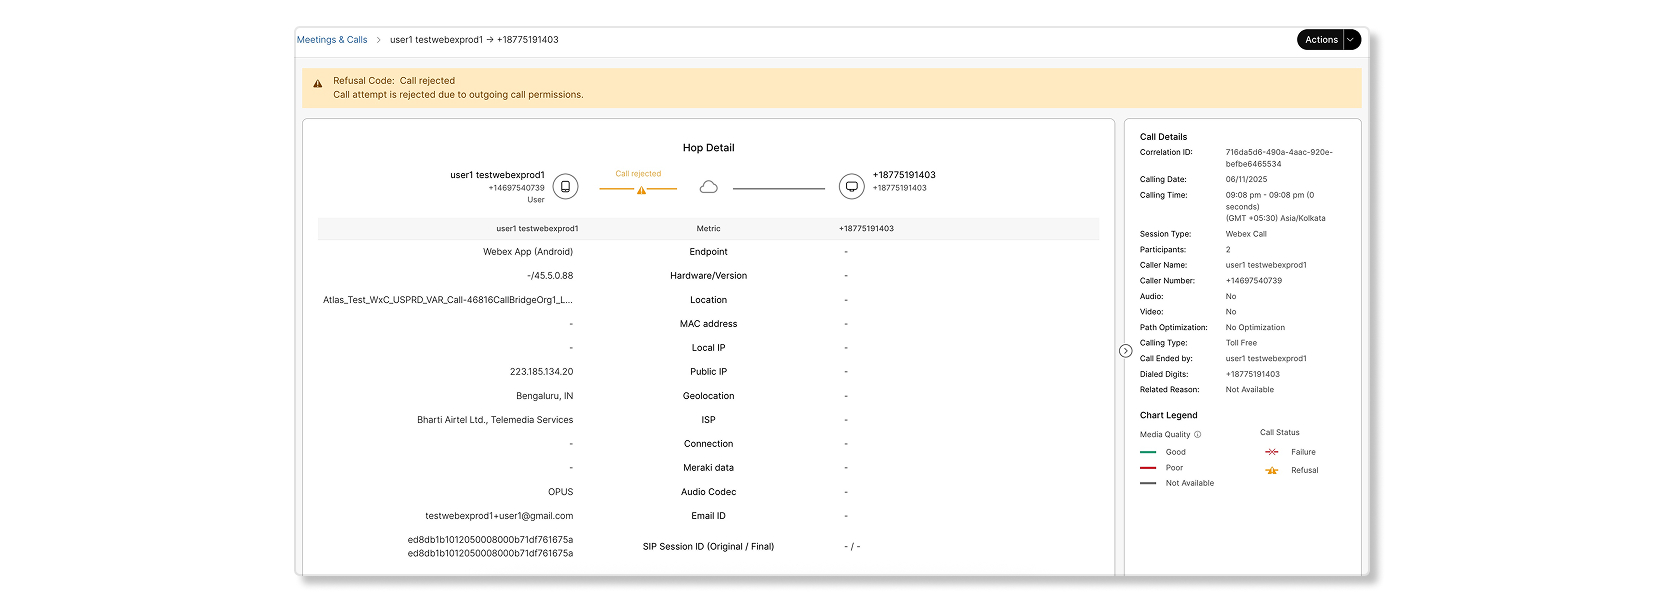
A call attempt failed because the attempt couldn't reach the destination or the interface to the destination wasn't functioning correctly. Examples of rejected scenarios are the following:
-
Call attempt is rejected due to anonymous call rejection.
-
Call attempt is rejected due to incoming call permissions.
-
Call attempt is rejected due to outgoing call permissions.
-
Call attempt is rejected due to outgoing call permissions.
-
Call attempt is rejected due to call intercept configured.
-
Call attempt is rejected due to call park or call retrieve failure.
-
Call attempt is rejected due to push-to-talk rejection.
-
Call attempt is rejected due to selective call acceptance.
-
Call attempt is rejected due to selective call rejection.
-
Call attempt is rejected due to errors like unknown number, insufficient permissions, etc.
Failure Code: Unassigned number
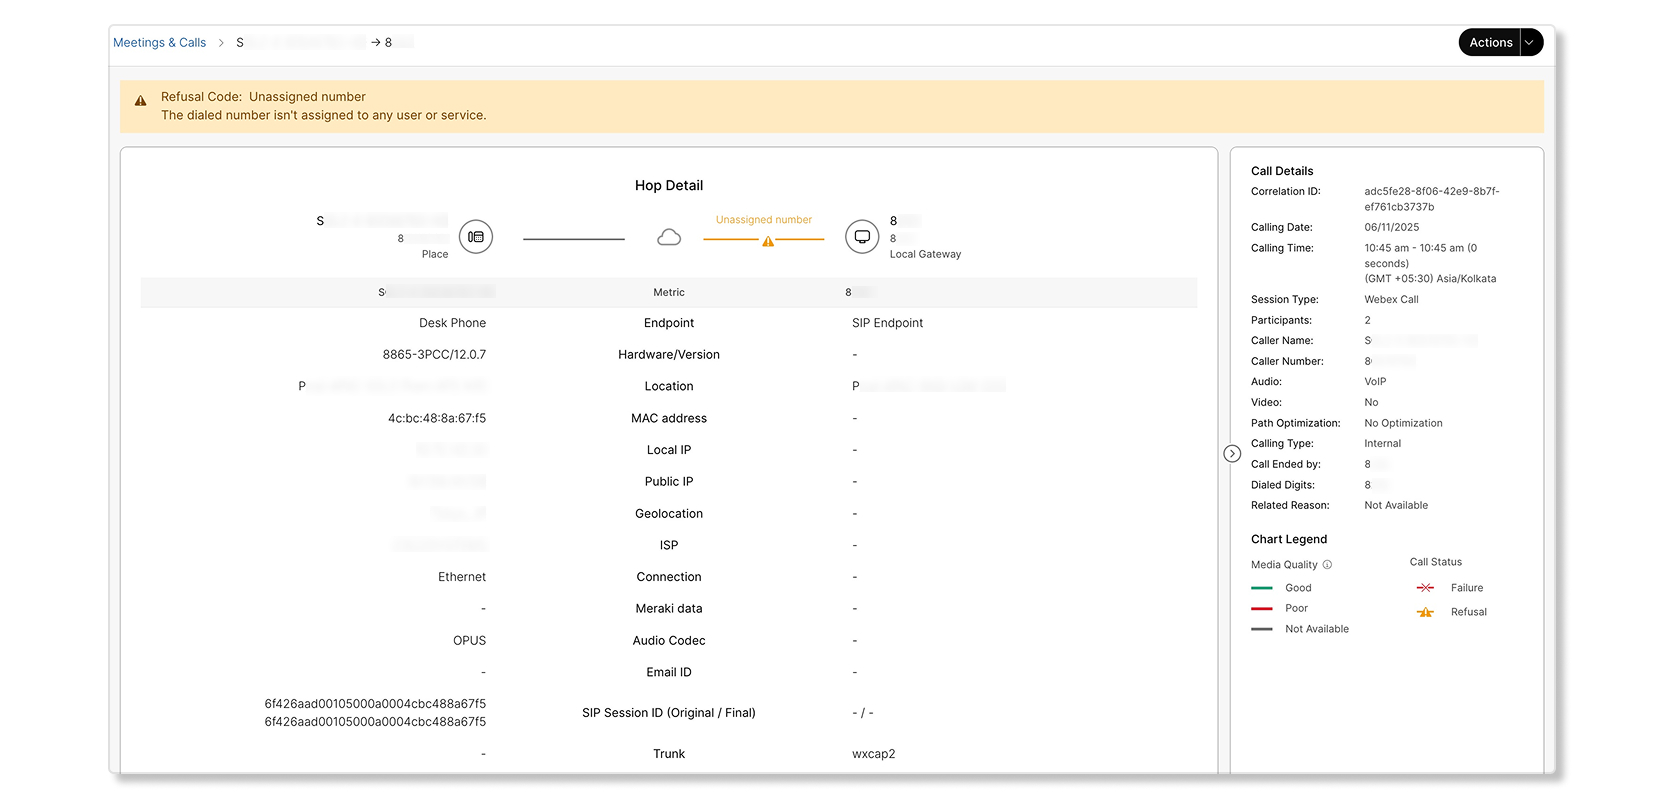
A call attempt was made by a caller but was rejected because the destination was to an unassigned number.
Call outcome reasons
The following table lists the Refusal and Failure codes available for unsuccessful calls.
| Call outcome reason | Definition |
|---|---|
|
Success |
Call was successful. Possible codes are:
|
|
Refusal |
Call was refused. Possible codes are:
|
|
Failure |
Call failed. Possible codes are:
|


