We’re constantly updating and improving the Webex Analytics and Troubleshooting platform that’s available in Control Hub. Check back to learn about new features available in Analytics and Troubleshooting.
For more information about these new features, see Analytics for Your Cloud Collaboration Portfolio, Reports for Your Cloud Collaboration Portfolio, and Advanced Diagnostics and Troubleshooting in Control Hub.
February 2024
Calling engagement analytics in Partner Hub
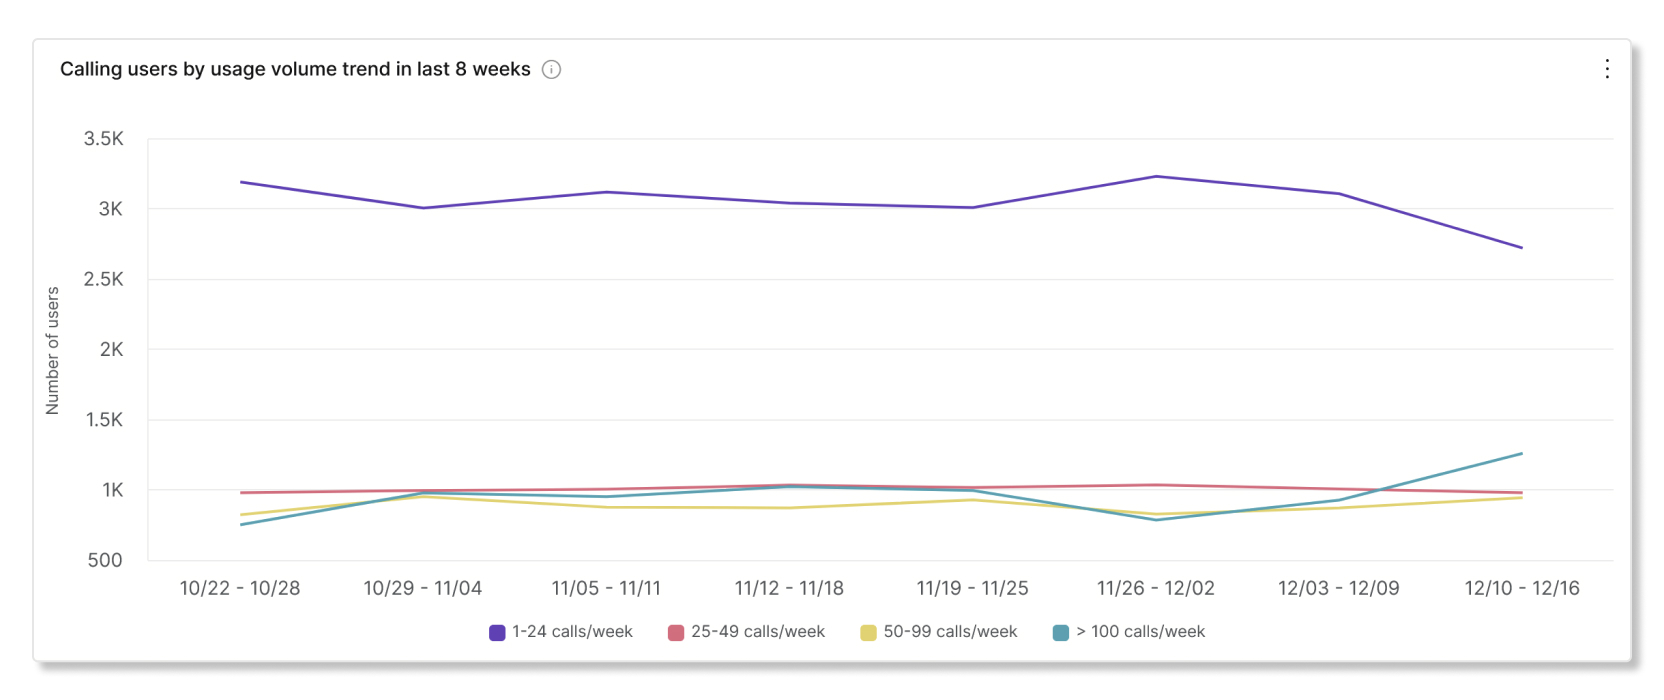
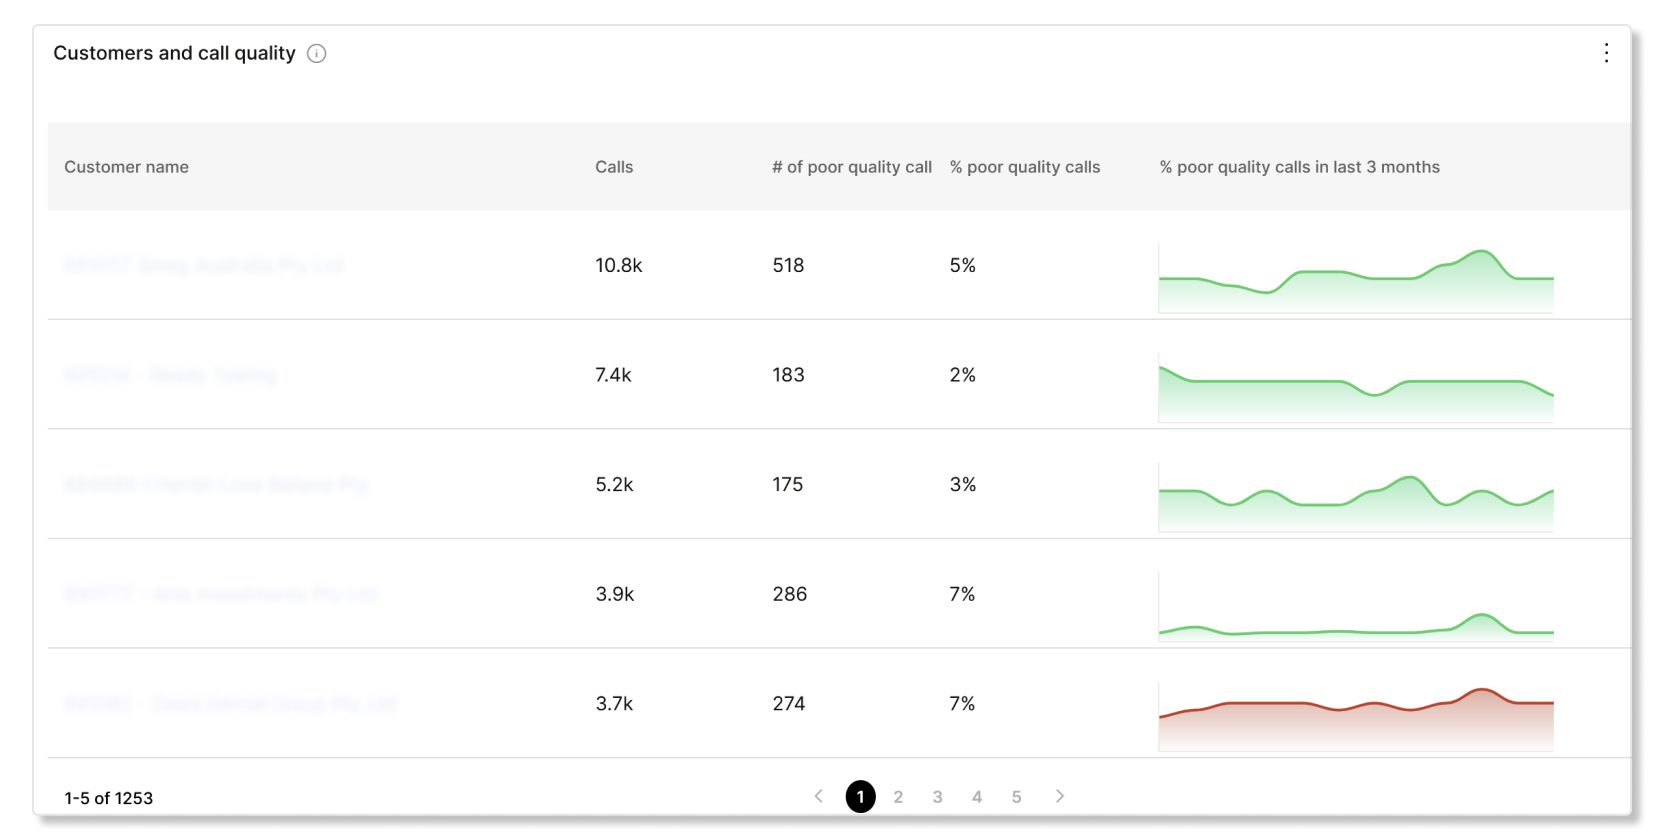
Calling engagement analytics is now available in Partner Hub. Data in this section shows the call usage rate and call quality of the customers that have purchased Webex Calling in your organization. This data shows how you can proactively help your customers, such as if you notice their call quality is trending downwards, you can reach out and troubleshoot their issues before it gets even worse.
January 2024
Reports API will only support ZIP file format when downloading reports after January 31, 2024
Currently, the CSV file format is the default when you download Control Hub reports with the Reports API. Starting December 31, 2023, CVS files will be zipped before they'll be available to download. By January 31, 2024, we'll no longer support unzipped CVS file downloads.
You may start downloading reports as a ZIP file format prior to January 31, 2024 by
setting zipEnable=true to prepare for this change. For example:
https://reportdownload-a.webex.com/api?reportId=Y2lzY29zcGFyazovL3VzL1JFUE9SVC82YWZiZTg0MTY4OTU0MTA0OThiYTcyZGM4N2FlODE2Yg&zipEnable=true
You can also use zipEnable=false to download files in the CSV file
format until January 31, 2024. After January 31, 2024, the
zipEnable=false flag will be ignored and all reports will be downloaded
in the ZIP file format only.
Slido analytics
Slido analytics is now available. You can use this data to see if hosts are incorporating Slido features into their meetings and how often users are engaging with those features.


December 2023
Updated fields in Webex for Government reports
The following Webex for Government reports have been updated with more fields:
- Webex Meetings Attendees
WEBEX_ASSISTANTBREAKOUT_USEDIS_E2EESI_USED
- Webex Meetings Details
VIRTUAL_BACKGROUND_USEDHOST_INDICATORIS_COHOSTCLIENT_TYPESUB_CLIENT_TYPECLIENT_BROWSER_DETAILS
- Webex Calling Engagement
Caller
Troubleshooting data for devices on Cisco Meraki platform
Troubleshooting now shows data path visibility of users who are on the Cisco Meraki platform.

November 2023
Fixed an issue with the Answered Calls KPI in the Detailed Call History dashboard of Webex Calling analytics
We've released a fix to the Answered Calls KPI in the Detailed Call History dashboard of Webex Calling analytics. For users on mobile devices, previously an extra notification record was included when the call was answered. For clarity, this record is now not counted towards the total number of records, which may cause a slight adjustment to the Answered Calls KPI.
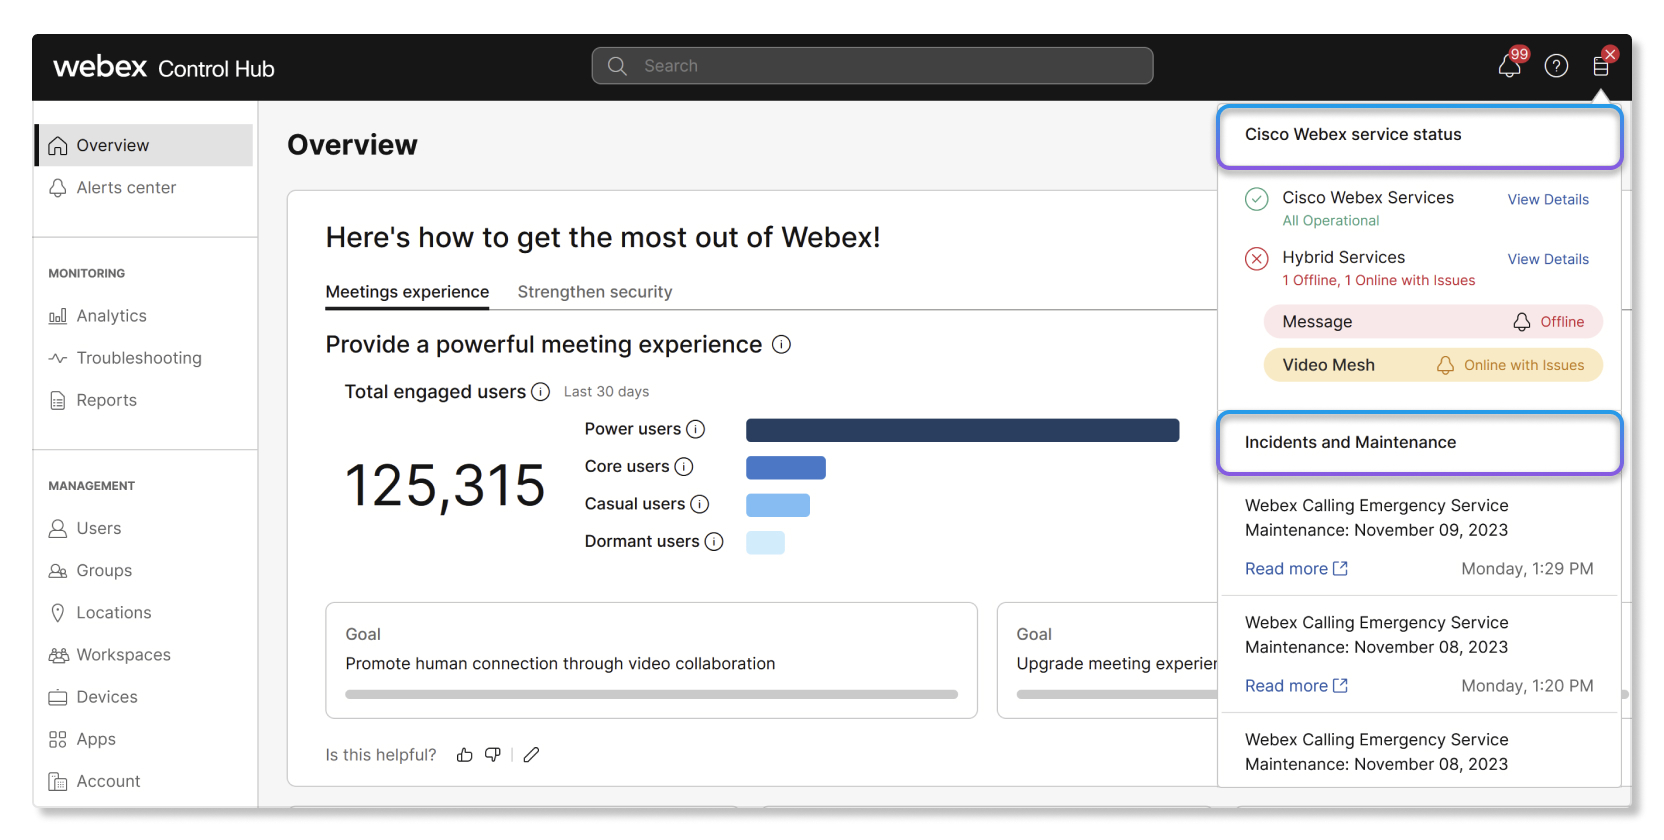
Webex service status information now located in a new toolbar menu
To improve user experience, we've moved the following information to a new toolbar menu located in the header of Control Hub:
- Webex Service and Hybrid services cards in the Overview page.
- Cisco Webex Status card in the Troubleshooting > Status page.
- Incident data information in Alerts page.
This toolbar shows high-level status information of Webex services and links to status.webex.com if you want to view detailed information.
Widgets now available for custom dashboards
You can now add widgets from a catalog to your custom dashboards.

Linux client type now included in Messaging App Version report
The client type field in the Messaging App Version report now includes Linux.
October 2023
New fields in Webex Calling Detailed Call History report
The Webex Calling Detailed Call History report has been updated with the following fields:
- Ring duration
- Release time
- Answer indicator
- Final local sessionID
- Final remote sessionID
These new fields help you better assist customers by pinpointing when a call transfer happened, which you can then use to example the relevant records more easily to find the necessary information.
New API parameters for Webex Calling Detailed Call History report
The following Webex Calling API parameters have been added to the Detailed Call History report:
- Ring duration
- Release time
- Answer indicator
- Final local sessionID
- Final remote sessionID
September 2023
Device power consumption report
We've added a new device power consumption report to Devices analytics. This report provides details about the energy consumption of Cisco devices in your organization, which can help with green initiatives.
August 2023
Device usage by meeting service and trend chart
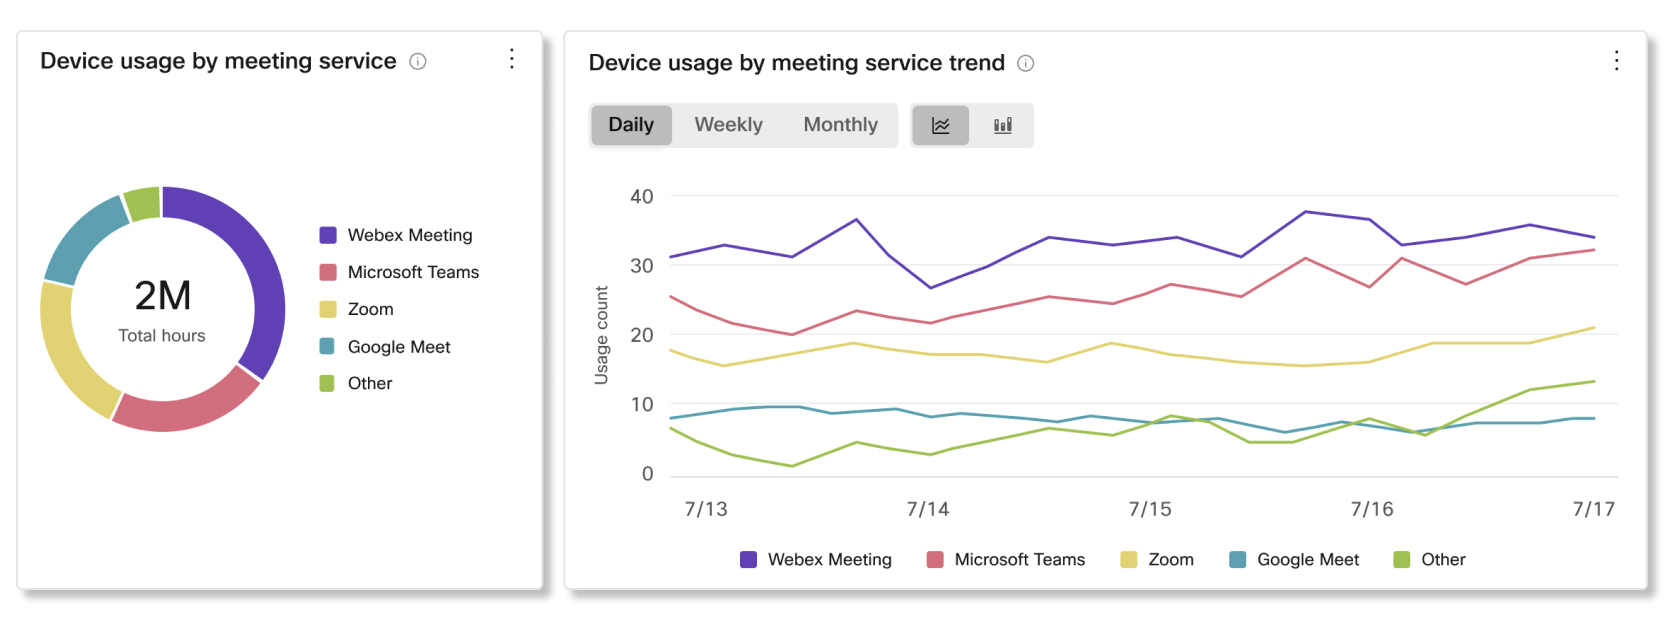
We've added a new Device usage by meeting service and trend chart to Devices analytics, which breaks down the different meeting services that users in your organization are hosting and joining with Cisco devices. You can use this chart to help drive adoption with the meeting service that you want users to focus on.
Device-centric troubleshooting
Device-centric troubleshooting is now available. When you search for a device name, you can see a high-level overview of their media quality metrics in meetings and calls.
Device live meeting monitoring alert
You can now set up live meeting monitoring alerts for Cisco devices in Alerts center. This alert helps you know right when devices are having poor media quality meetings so you can provide quick support to users.
New tracking code fields in Meetings Telephony report
The Meetings Telephony report has been updated with tracking code fields that go up to 10.
New call ID fields in Calling Detailed Call History report
The Calling Detailed Call History report has been updated with the following call ID fields to help you better correlate between originating and terminating call records:
- Local call ID
- Remote call ID
- Network call ID
- Related call ID
- User number
- Call outcome
- Call outcome reason
New call transfer time field in Calling Detailed Call History report
You can now find out the time when a call transfer service was requested during calls
with the Call transfer time field in the Calling Detailed Call
History report. Call transfer service times are shown using the UTC/GMT time
zone.
RoomOS and ThousandEyes integration
ThousandEyes agent that is integrated with RoomOS devices offers network path visibility for active troubleshooting of meetings to pinpoint issues in real time.
Initially the integration supports Webex meetings. Other meeting types, such as Microsoft Teams, are planned for the future.
Read more about ThousandEyes integration for RoomOS devices.
New global filters in Detailed Call History analytics
The following global filters have been added to the Detailed Call History section in Calling analytics:
- User Name
- Endpoint Type
- Device Type
Webex Calling Media Quality report
You can now find out the media quality metrics of call legs, such as audio jitter, video packet loss, connection used, and more with the Webex Calling Media Quality report.
Troubleshooting in Partner Hub
As a partner admin, you can now view meeting troubleshooting details for customers that have bought a Webex Meetings subscription from your partner organization.
July 2023
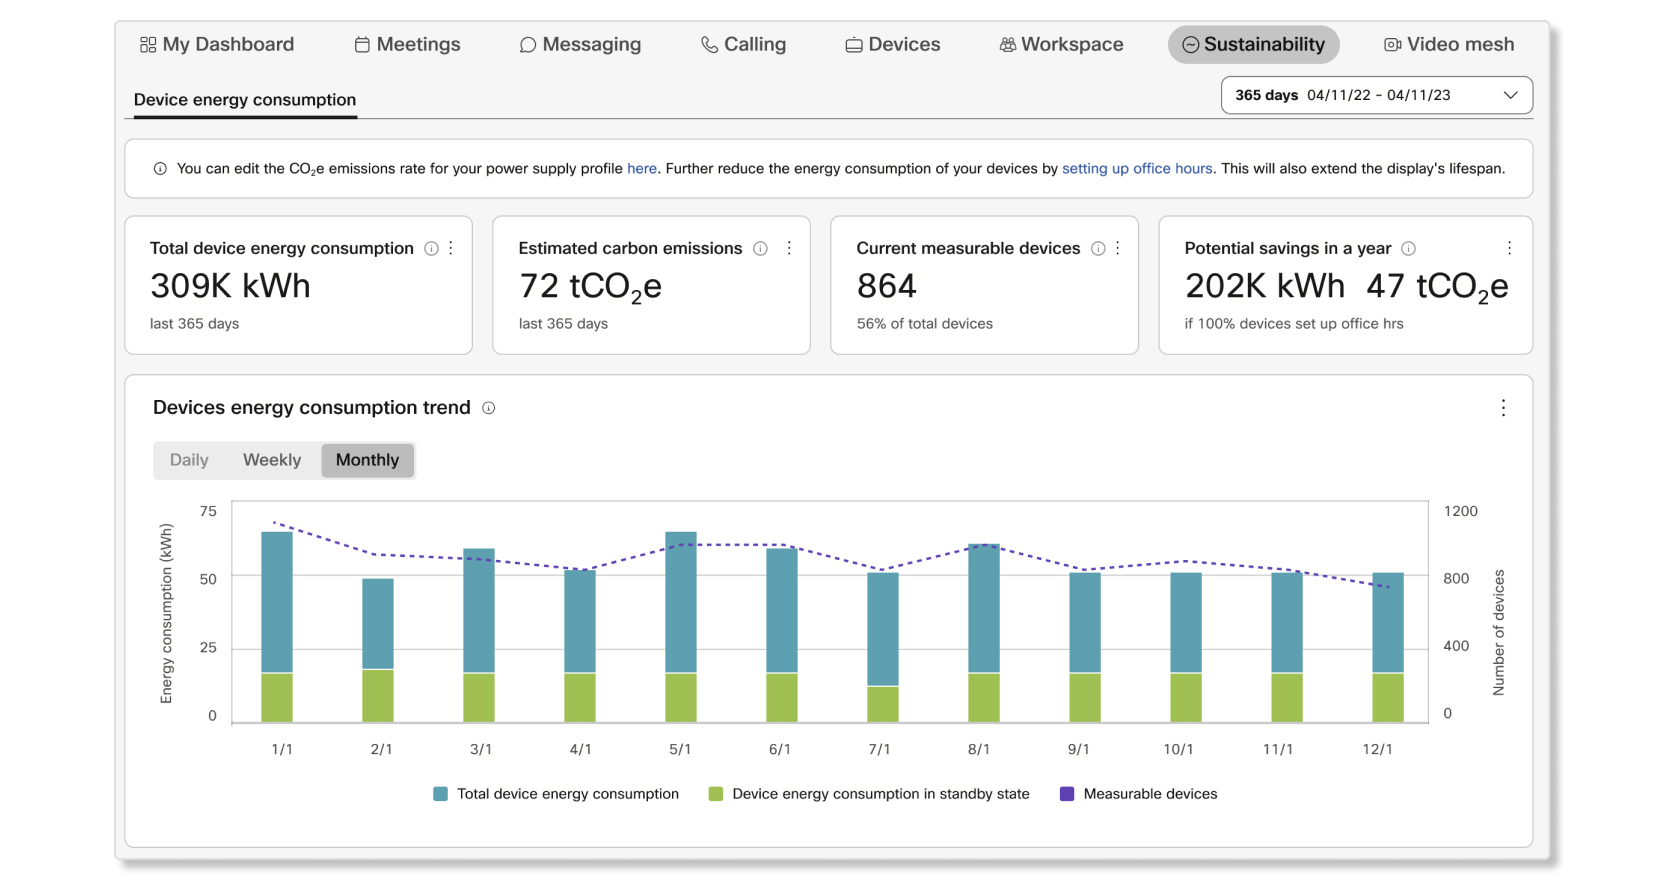
Device energy consumption analytics are now available
Device energy consumption analytics models the estimated energy that current measurable devices in your organization are consuming over a selected date range and the estimated greenhouse gas emissions (measured in CO2e) associated with their energy consumption.
June 2023
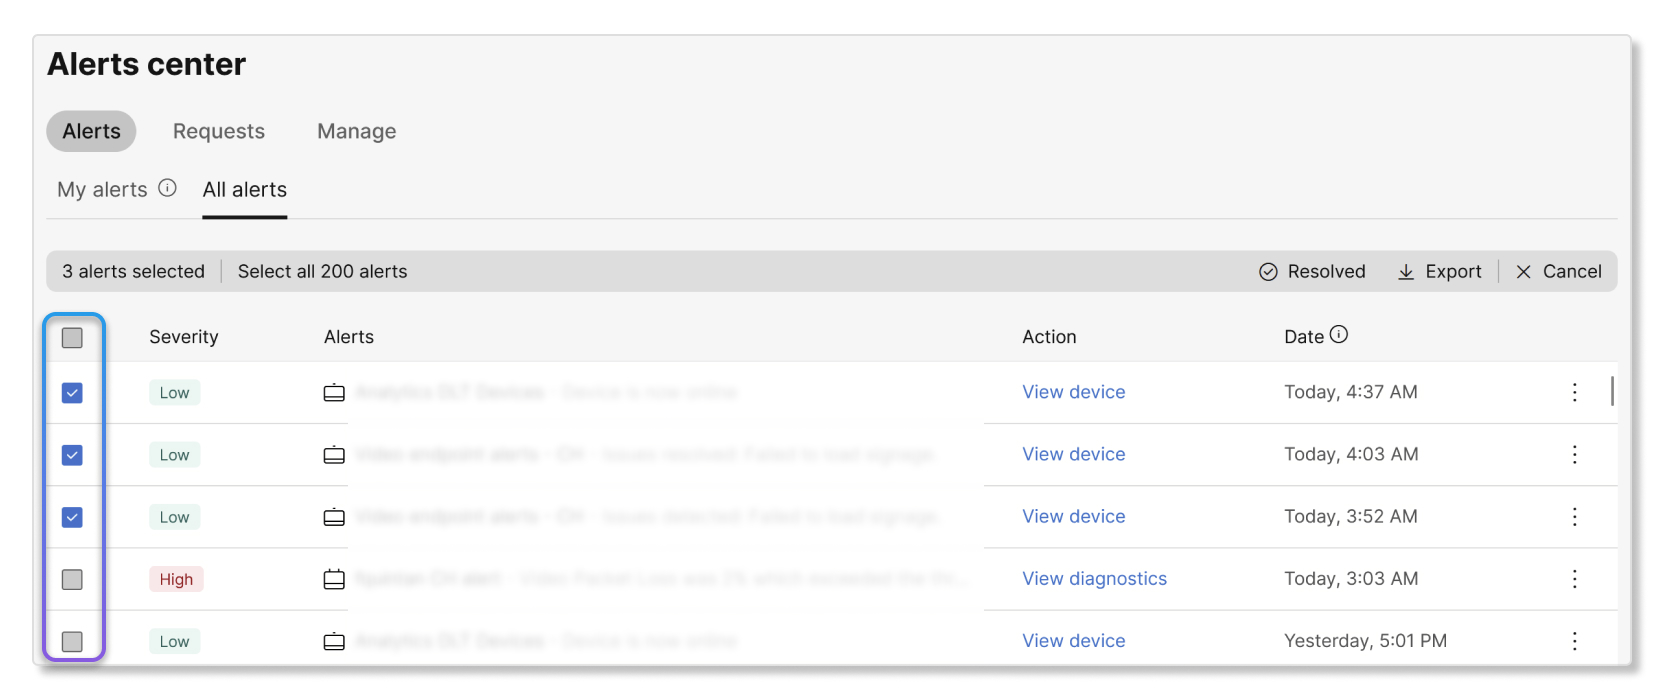
Manage multiple alerts in Alerts center
You can now select multiple alerts in Alerts center to resolve them all at once or to export certain groups.
May 20223
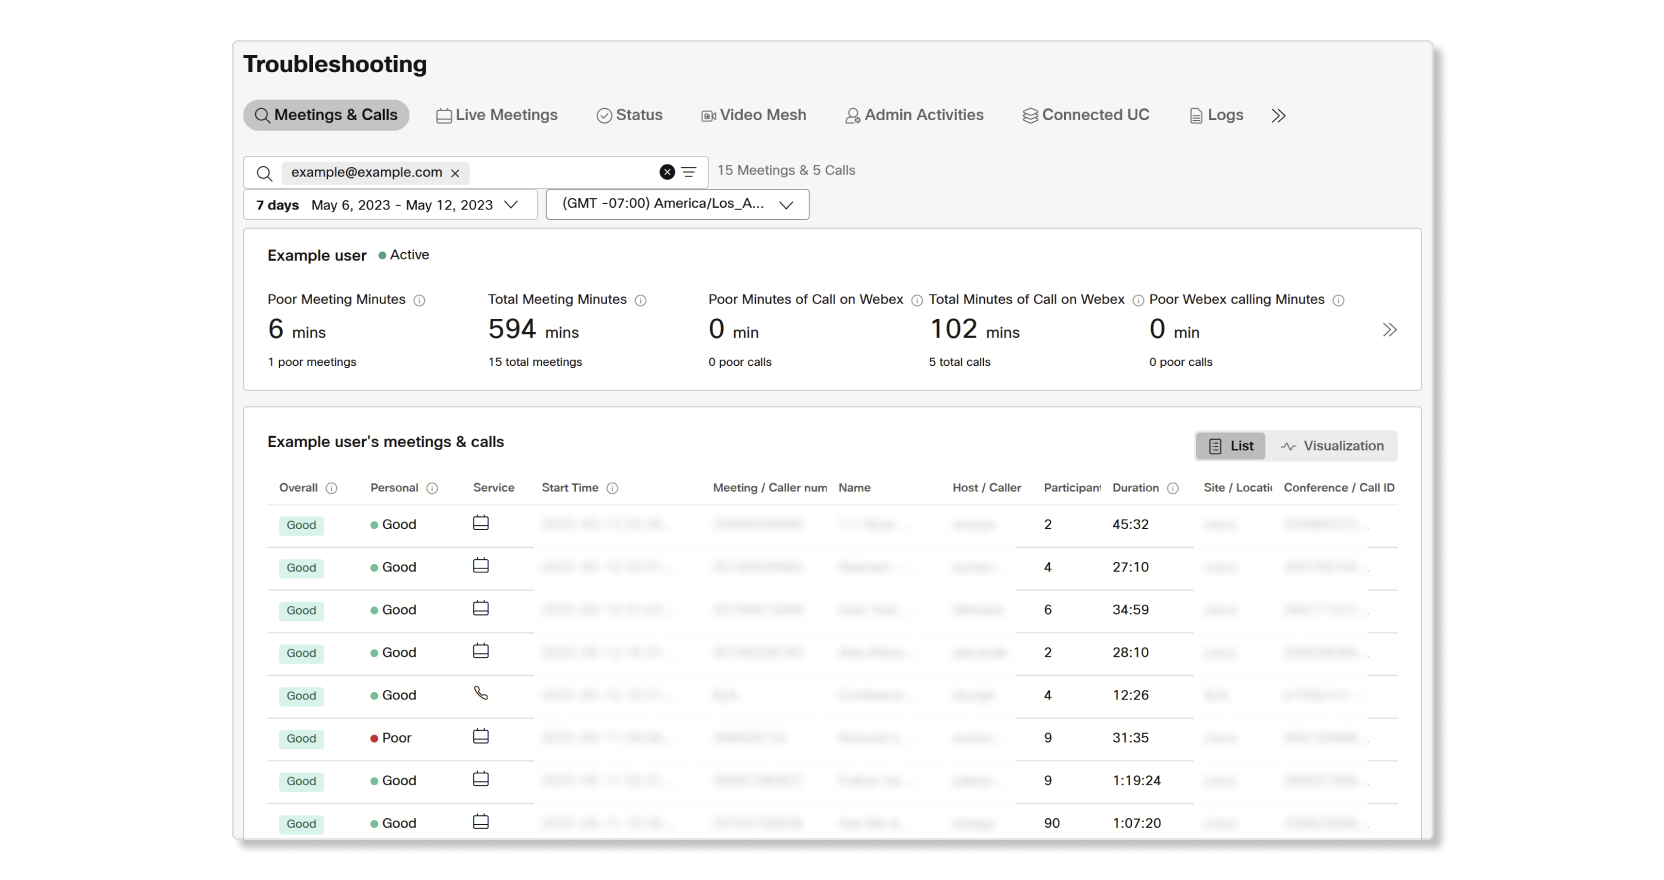
User-centric troubleshooting
User-centric troubleshooting is now available. When you search for a user's e-mail address, you can see a high-level overview of their media quality metrics in those meetings and calls.
April 2023
New columns in Meetings Attendees report
Three new columns have been added to the Meetings Attendees report:
- Client_Type—Client that the participant used to join the meeting.
- Sub_Client—Method that the participant used to join the meeting.
- Client_Browser_Details—App or browser that the participant used to join the meeting.
Call Legs by ISP chart in Calling analytics
We've added a Call Legs by ISP chart in the Media Quality section of Calling analytics. You can use this chart to help you determine if media quality issues are coming from specific internet service providers.

New UI tooltips and validation messages to indicate report limit of 50
We've added new UI tooltips and validation messages to let you know that you can save or generate up to 50 reports before having to delete existing ones to create new reports.
Meetings Embedded Apps report
You can now find out what embedded apps are being used by participants during meetings with the Meetings Embedded Apps report.
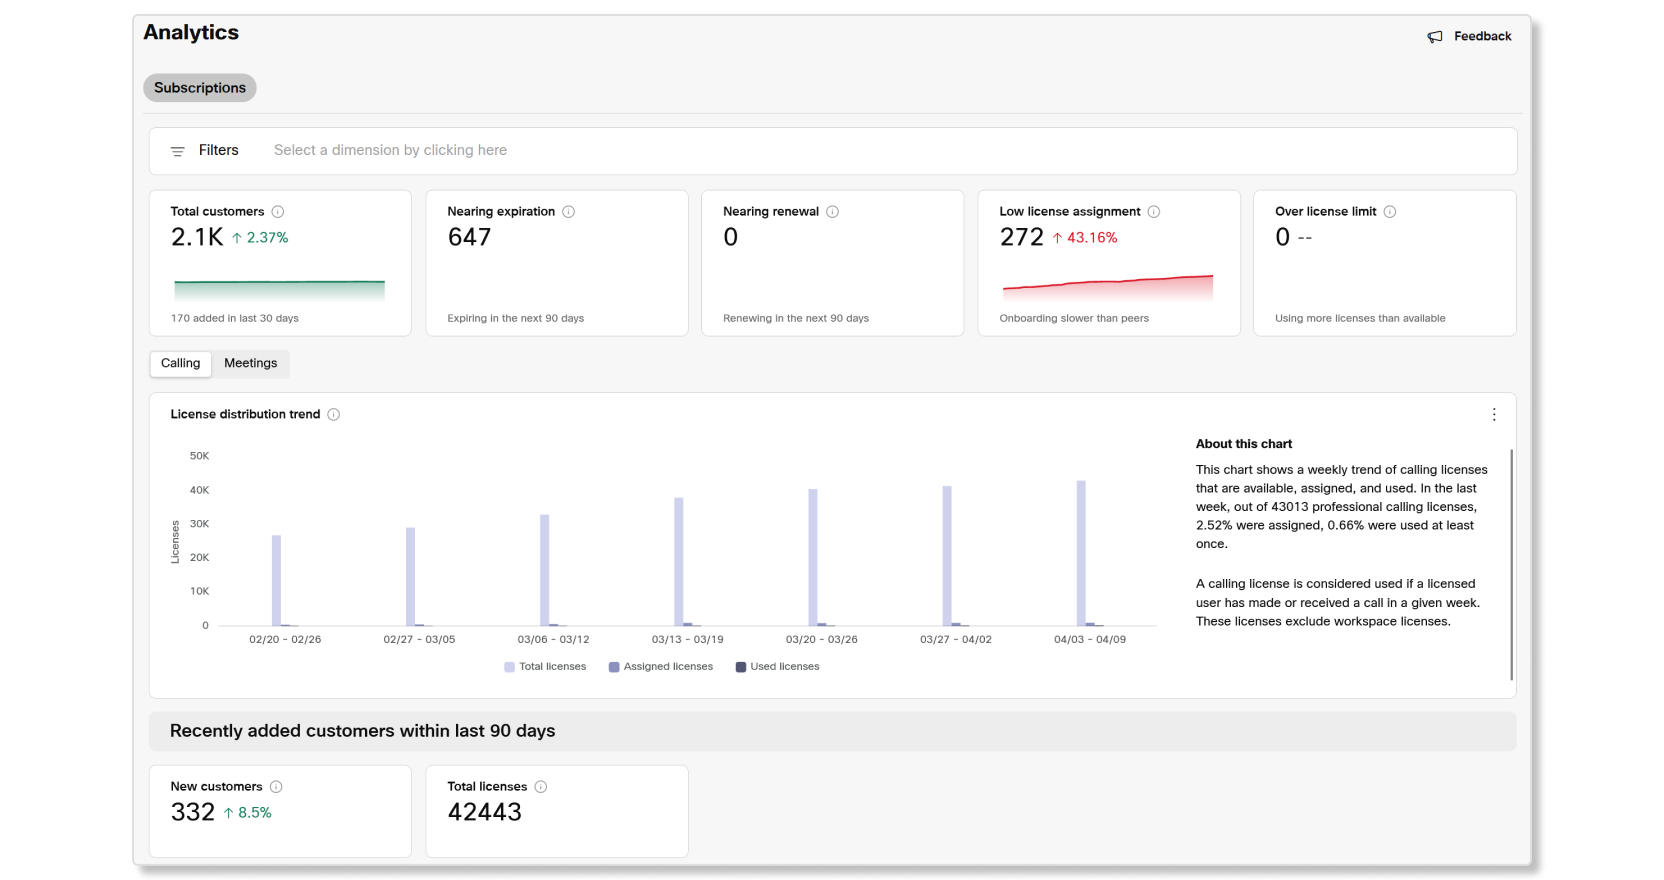
Subscriptions analytics for Partner Hub
Analytics data for subscriptions with Webex Calling and Webex Meetings is now available to partner administrators. You can use subscriptions analytics to help drive customer adoption, measure a customer's use of licenses, see if there's an upsell opportunity, and more.
March 2023
Report notifications are now sent from a new email address
Currently, report notifications are sent from pda@cisco.com. These
notifications are now sent from reports_controlhub@webex.com. Make sure
to note this change and that the new email address isn't marked as spam by accident.
Meeting Future Schedules report now includes Webex Webinars
The Meeting Future Schedules report has been updated to include a new value in the ServiceType column called WB. WB indicates that the future meeting is a Webex Webinar.
UI tooltips for features and capabilities in Reports that are only available for Pro Pack
When downgrading from Pro Pack to Standard or if you have a Standard licenese by default, UI tooltips are now shown if a feature or capability in Reports is only available for Pro Pack.
In-Meeting Feature Usage Report now available to EU customers
EU customers now have access to the previously released In-Meeting Feature Usage report.
February 2023
Updated naming format for downloaded reports
Currently, when you download a report, the file uses alphanumeric characters_download date as the naming format. Reports now use the following format for their file names when you download them:
- Default report template—
Default Template Name_alphanumeric characters_Download Date - Custom report template—
Custom Template Name_alphanumeric characters_Download Date
January 2023
ThousandEyes Cloud Agents can now be deployed to Webex Calling data centers
You can now deploy ThousandEyes Cloud Agents to Webex Calling data centers. The agents capture RTP traffic in a bidirectional way to help determine issues in the network path between the Webex Calling data center and the enterprise network.
Read this article for best practices on how to set up tests with Cloud Agents for Webex Calling.
Troubleshooting now supports Basic Meetings
You can now see Troubleshooting details for users with Basic Meetings licenses.
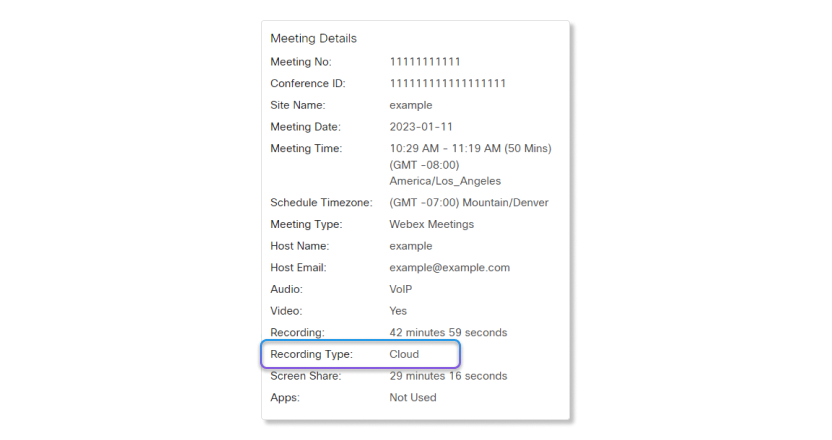
Troubleshooting now shows if a recording was saved to the cloud or to a local machine
Recording Type has been added in Meetings Details, which shows if the meeting was recorded to the cloud or to a local machine.
December 2022
Meetings In-Meeting Feature Usage report is now available
You can now find out what collaboration features are being used by users during meetings with the Meetings In-Meeting Feature Usage report.
Reports are now only available as compressed files
To improve performance, all reports now download as compressed files.
November 2022
New cohost column added to the Meetings Attendees report
You can now find out if an attendee was a cohost with the new IS_COHOST column in the Meetings Attendees report.
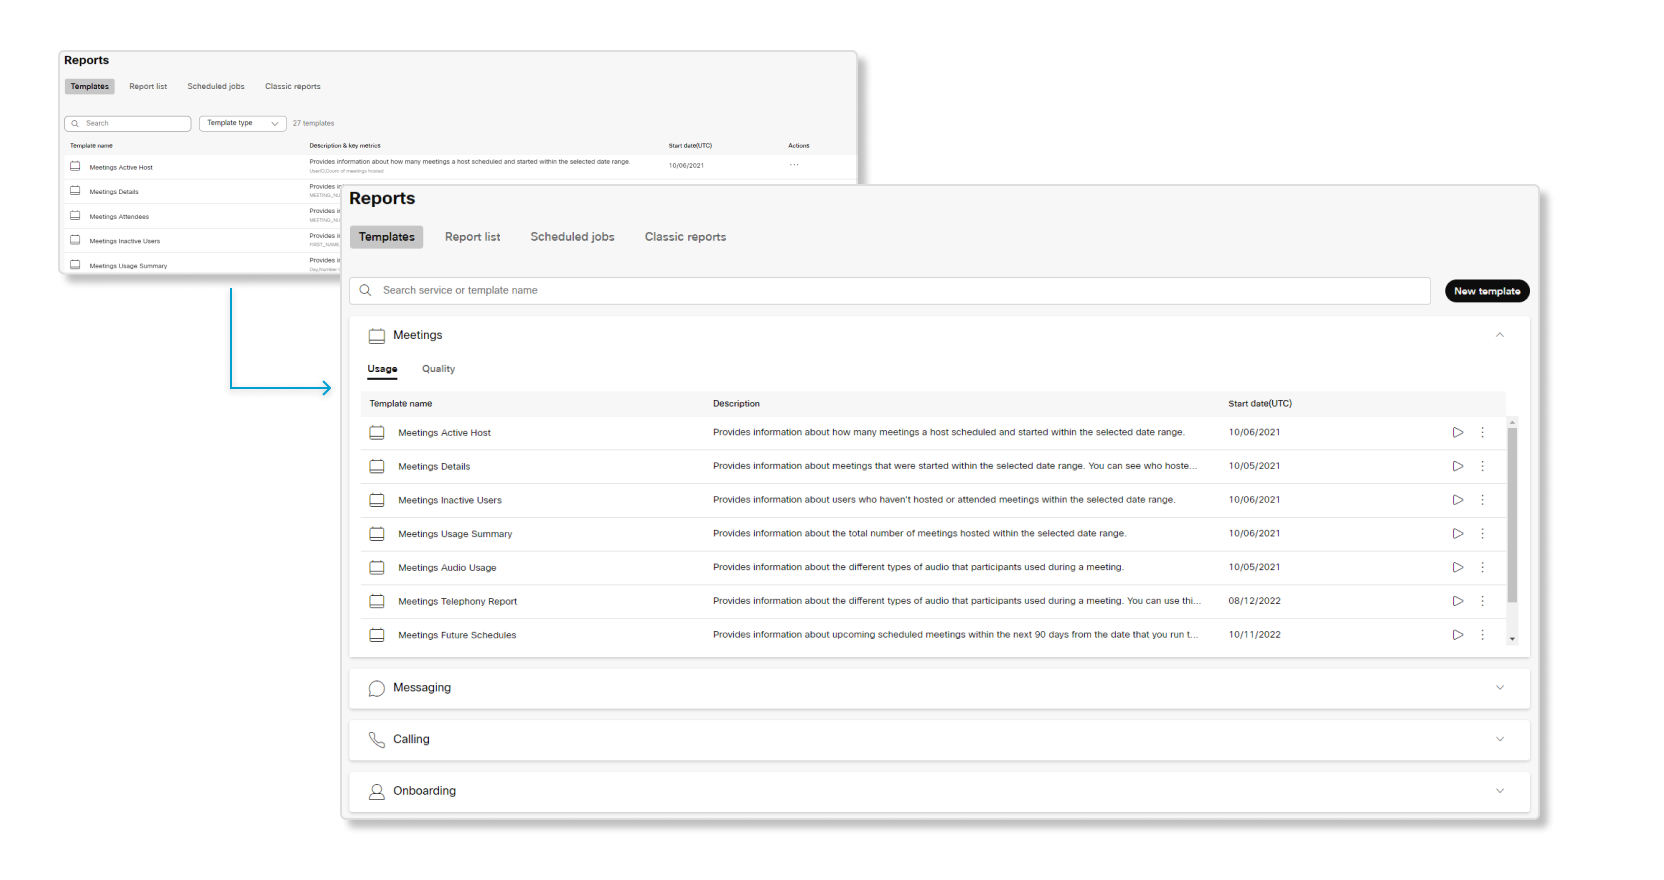
UI enhancements for Reports
UI enhancements have been made in the Reports section for an improved end-user experience. Admins can access the information they're interested in with a more simplified workflow and easier readability. Improvements include:
- Reports have been split into categories for optimal grouping and sorting.
- Each category has sub-categories for additional optimal grouping.
- New search features.
- New right-hand panel is displayed when clicking on a template This panel provides a high-level overview of the report and includes key metrics in the report.
Webex Calling and ThousandEyes Cloud Agent integration
You can now connect ThousandEyes Enterprise Agents to Cloud Agents located in the Webex Calling cloud to perform bidirectional network performance testing. Currently, the Webex Calling data centers that support ThousandEyes Cloud Agents are Amsterdam, Frankfurt, and Singapore.
Webex Calling Cloud Agents are managed and accessed in the ThousandEyes dashboard. |
Read ThousandEyes integration with Webex Services in Control Hub for more information.
October 2022
Webex Calling call queue analytics and reports are now available
You can now view data for call queues set up in your organization, such as how many calls were abandoned, the average minutes that callers spent waiting in call queues, total number of incoming calls, and more.
Read the Call Queue section of Analytics for Your Cloud Collaboration Portfolio and the Webex Calling section of Reports for Your Cloud Collaboration Portfolio for more information.
Webex Calling auto-attendants analytics and reports are now available
You can now view data for auto-attendants set up in your organization, such as number of calls during and after business hours, number of calls routed to auto-attendants, busiest time of the day, and more.
Read the Auto-Attendant section of Analytics for Your Cloud Collaboration Portfolio and the Webex Calling section of Reports for Your Cloud Collaboration Portfolio for more information.
External domain report is now available
You can now download an external domain report, which gives you details on which external domains are collaborating with your organization in Webex App and which users in your organization are in external spaces.
Read the Webex Messaging section of Reports for Your Cloud Collaboration Portfolio for more information.
August 2022
Retiring the Engagement and Quality tabs in Calling analytics
The Engagement and Quality tabs in Calling analytics will be retired on September 30, 2022. You can continue using the Media Quality dashboard to get call quality and usage information.
Share custom dashboards with other administrators
As a full administrtaor, you can now share custom dashboards that you created with other administrators in your organization.
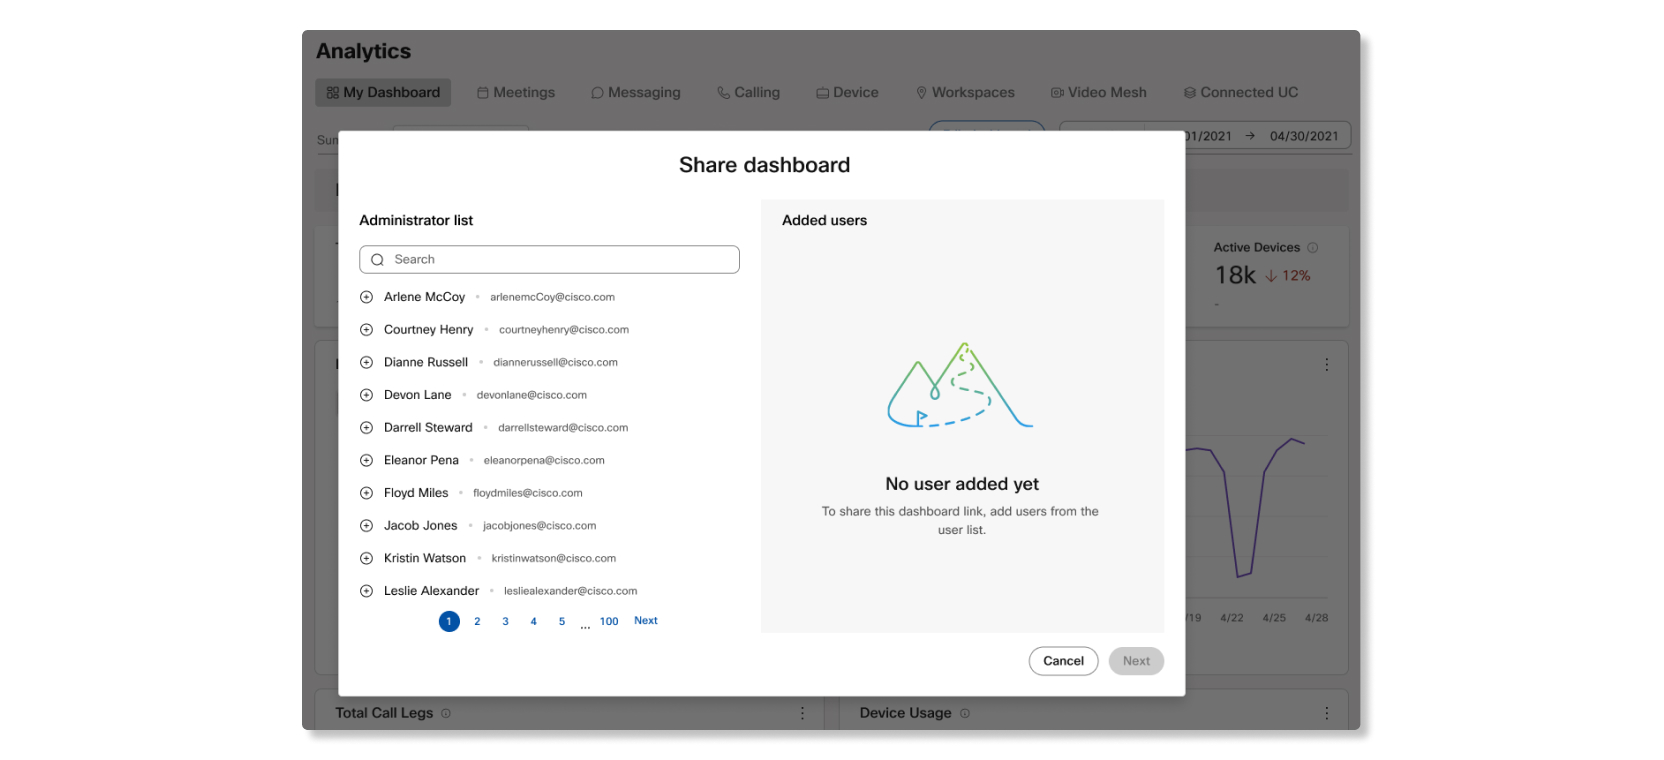
Read the Share dashboards section of Custom analytics dashboards for more information.
User feedback in Troubleshooting
You can now provide feedback on how we can improve the information available in Troubleshooting.

July 2022
New Webex Meetings telephony report
A new telephony report for Webex Meetings is now available. This report shows you the different audio options that participants used during a meeting, such as callback, VoIP, premium toll, and more.
Workspaces analytics
With the new workspaces analytics, you can improve the hybrid work experience in your office and understand your workspace usage, bookings, occupancy, and trends over time. Detailed information along with charts and graphs give you the tools to effectively manage the locations where your employees work. Having knowledge of workspaces allows administrators to provide rooms when needed and reallocate poorly utilized locations.
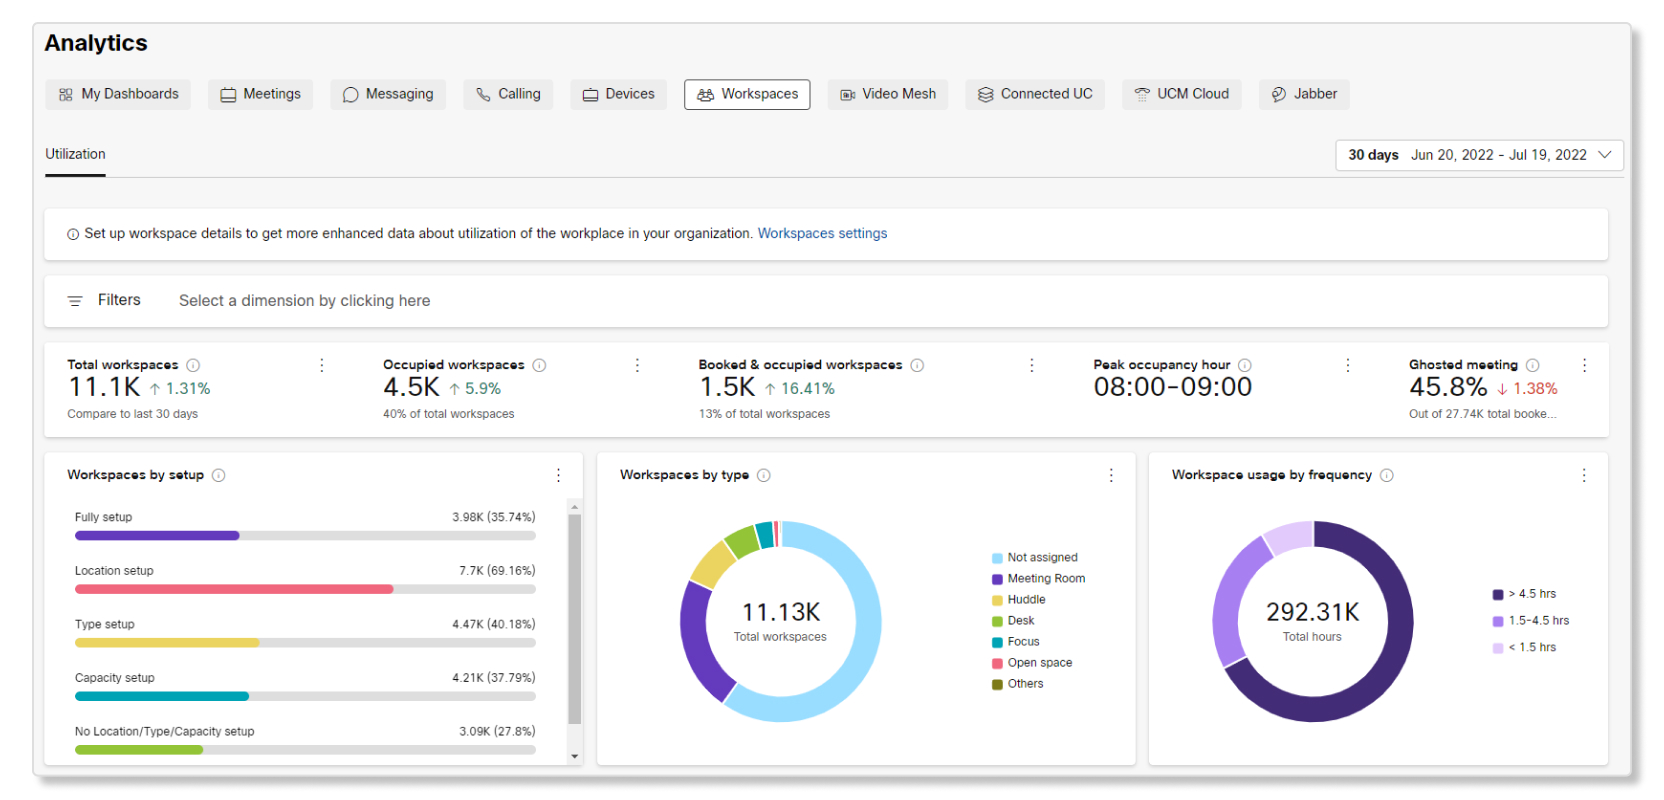
Read the Workspaces section of Analytics for Your Cloud Collaboration Portfolio for more information.
ThousandEyes integration with Troubleshooting
You can now integrate ThousandEyes with Troubleshooting. ThousandEyes offers a a way for you to see full path visibility of users across the network to isolate issues with greater clarity. You can also cross launch to the ThousandEyes dashboard from Troubleshooting to see more details for each path.
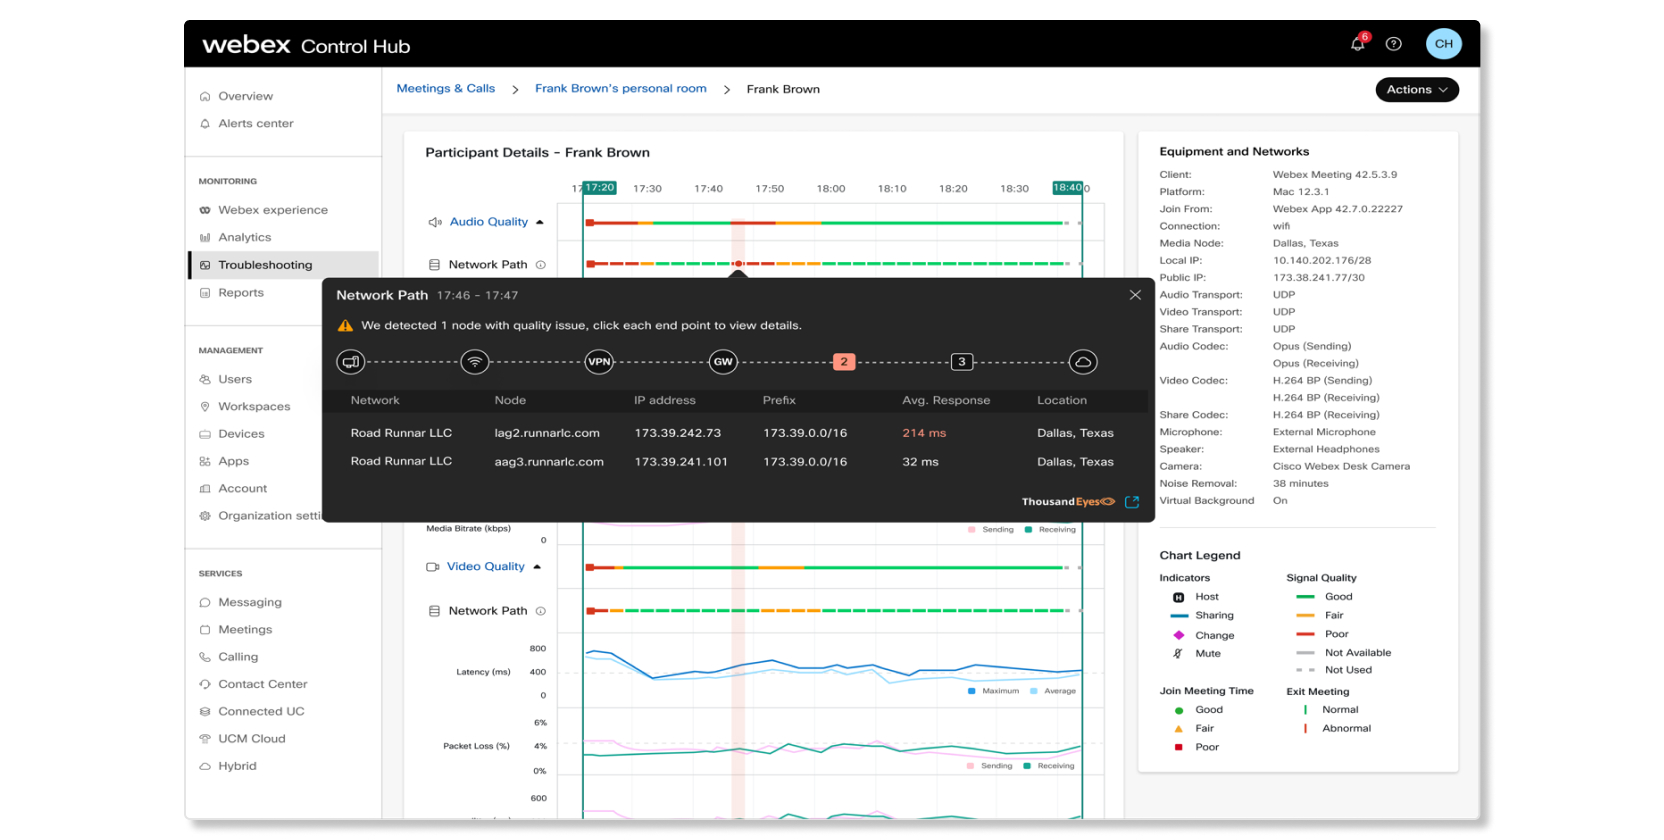
Read Integrate ThousandEyes with Troubleshooting in Control Hub for more information.
June 2022
New enhancements for Media Quality in Calling analytics
The Media Quality tab in Calling analytics have had these following enhancements made:
Users with worst calling experience table
We added a table that lets you see the top 300 users in your organization who experienced the most poor quality call legs. This table can help you quickly see which users to focus on and find out why they might be having poor quality call legs as opposed to other users.
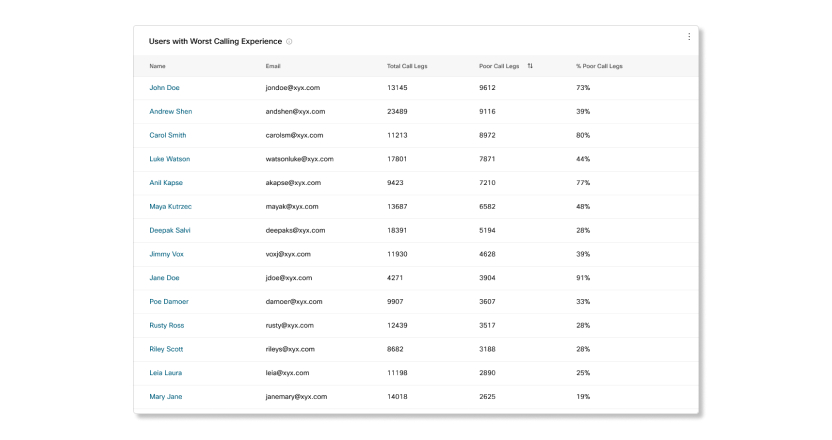
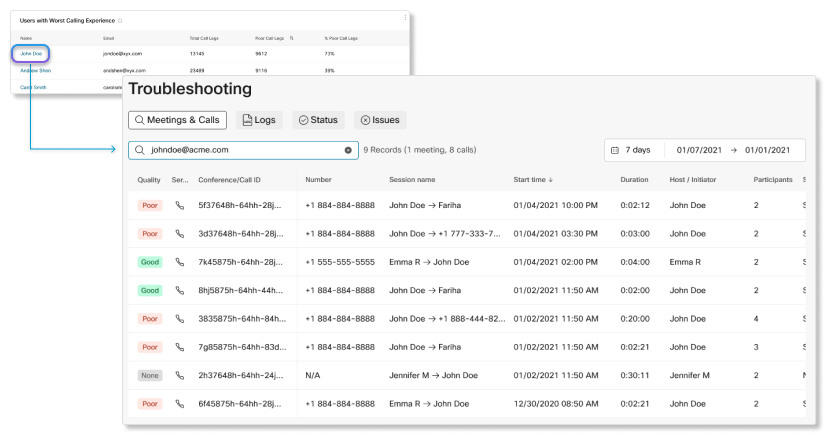
Cross launch into Troubleshooting from Calling analytics
When you click on a name in the Users with Worst Calling Experience table, a new tab opens up to Troubleshooting that shows you all the call legs that the user made within the date range that you selected, up to 21 days.
Filter by user name or email address
We added the option to filter all charts by specific user names or email addresses.
You must enter the user's full name or email address to apply the filter. For example, if you want to filter the data for John Doe, but only type in John or johndoe, the filter for that user won't show up. |

Data for Calls on Webex in Calling Media Quality analytics
Data for call legs that use Call on Webex is now available for all charts in the Media Quality tab of Calling analytics.
Read the Calling section of Analytics for Your Cloud Collaboration Portfolio for more information.
May 2022
Download custom dashboards as a PDF
You can now download custom dashboards as a PDF to take a snapshot of the current data.
Read Custom analytics dashboards for your cloud collaboration portfolio in Control Hub for more information.
April 2022
Build your own dashboards in Analytics
You can now build your own customized dashboards in Analytics using the KPIs and charts available for Meetings, Messaging, Calling, and Devices analytics.
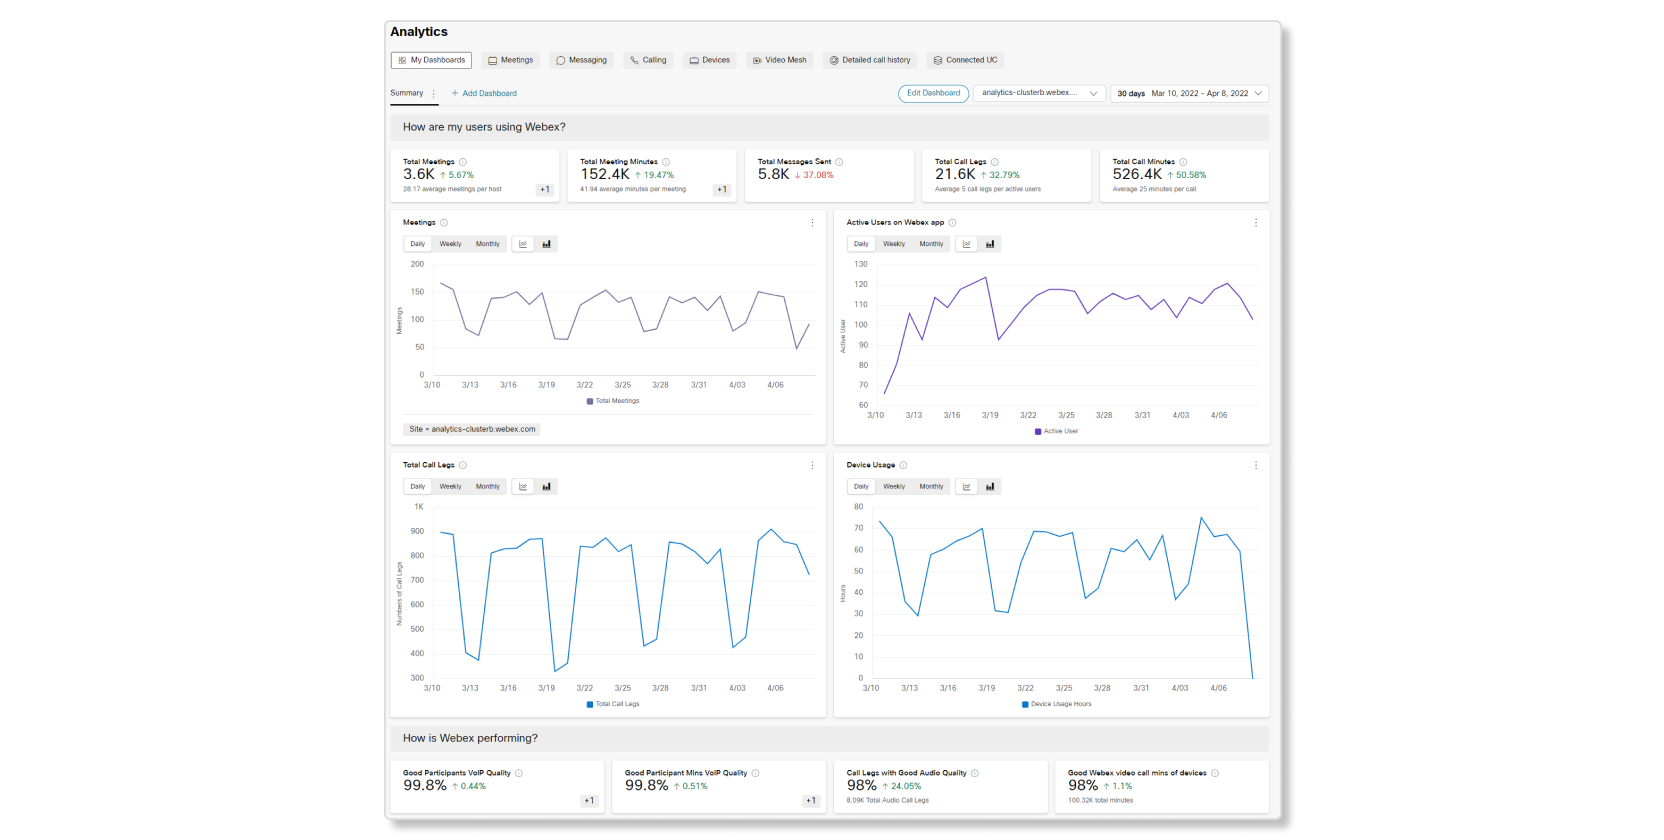
Read Custom analytics dashboardsfor your cloud collaboration portfolio in Control Hub for more information.
March 2022
New Media Quality tab in Calling analytics
Our new Calling Media Quality dashboard in Control Hub makes it easy to manage Webex Calling call quality across your organization. High level key performance indicators (KPIs) give administrators a quick view of global call quality. Our charts provide detailed views of this data by location, IP address, media type, connection type, codec, endpoint type, and IP phone model. Data is also now updated near real-time. You can see call quality data within 15 minutes of when a call ends.
Administrators can use filters for even more granularity, such as isolating call quality data by location and IP phone type in just seconds. These tools enable our customers to deliver a consistent, high quality calling experience, and resolve issues before users complain.
Data for this tab is only available for Webex Calling calls, not for Call on Webex calls. |
Read the Calling section of Analytics for Your Cloud Collaboration Portfolio for more information.
Troubleshooting for Webex Calling calls
A new way to visualize your Webex Calling calls. Use the troubleshooting tool to look up Webex Calling calls, and see hop-by-hop packet loss, jitter, and latency information. The troubleshooting view displays useful call information, pinpoints media quality issue, and aid in speedy resolution. Available in all regions and for calls involving desk phones and soft clients both desktop and mobile.
Read Troubleshoot Webex Calling Media Quality in Control Hub for more information.
Analytics for Webex for Wholesale and Webex for Broadworks partners
As a partner, you can now view package assignment metrics for your customers. These charts show you all the packages you’ve assigned to customers, and can help you see if your customers are open to adopting more Webex services.
To see partner analytics, you must have the feature toggle enabled for your organization. If you don't see the Analytics tab in Partner Hub, then talk to the Partner Onboarding team on how to enable this feature. |
Read Analytics for Webex for Wholesale and Webex for Broadworks packages in Partner Hub for more information.
February 2022
Create customized templates
Custom templates are now available in Reports. You can use existing templates to reorder or remove certain columns to view the data that you want to focus on.
Read the custom templates section in this article for more information.
Focus on media quality issues for Webex Room and Desk series devices with the quality tab
The Quality tab in Devices Analytics is now available. The charts in this tab focus on the audio and video quality minutes for Webex Room and Desk series devices to help you see if there are any media quality issues when they’re used during Webex calls.
January 2022
New host indictor column added to Meetings Attendees report
A new HOST_INDICATOR column has been added to the Meetings Attendees report to show which participant was the host in a meeting.
December 2021
New VIMT License and VIMT Usage Reports for Webex Devices
Two new reports are now available for you to view how Video Integration for Microsoft Teams (VIMT) is being used in your organization. The VIMT license report shows you license usage for unique active devices that use VIMT in your organization, and the VIMT usage report provides you details about calls here Webex Devices used VIMT to join Microsoft Teams meetings.
New simultaneous interpretation column added to Meetings Details report
A new SI_USED column has been added to the Meetings Details report to show if meetings had the simultaneous interpretation feature enabled by hosts.
October 2021
Meetings analytics enhancements
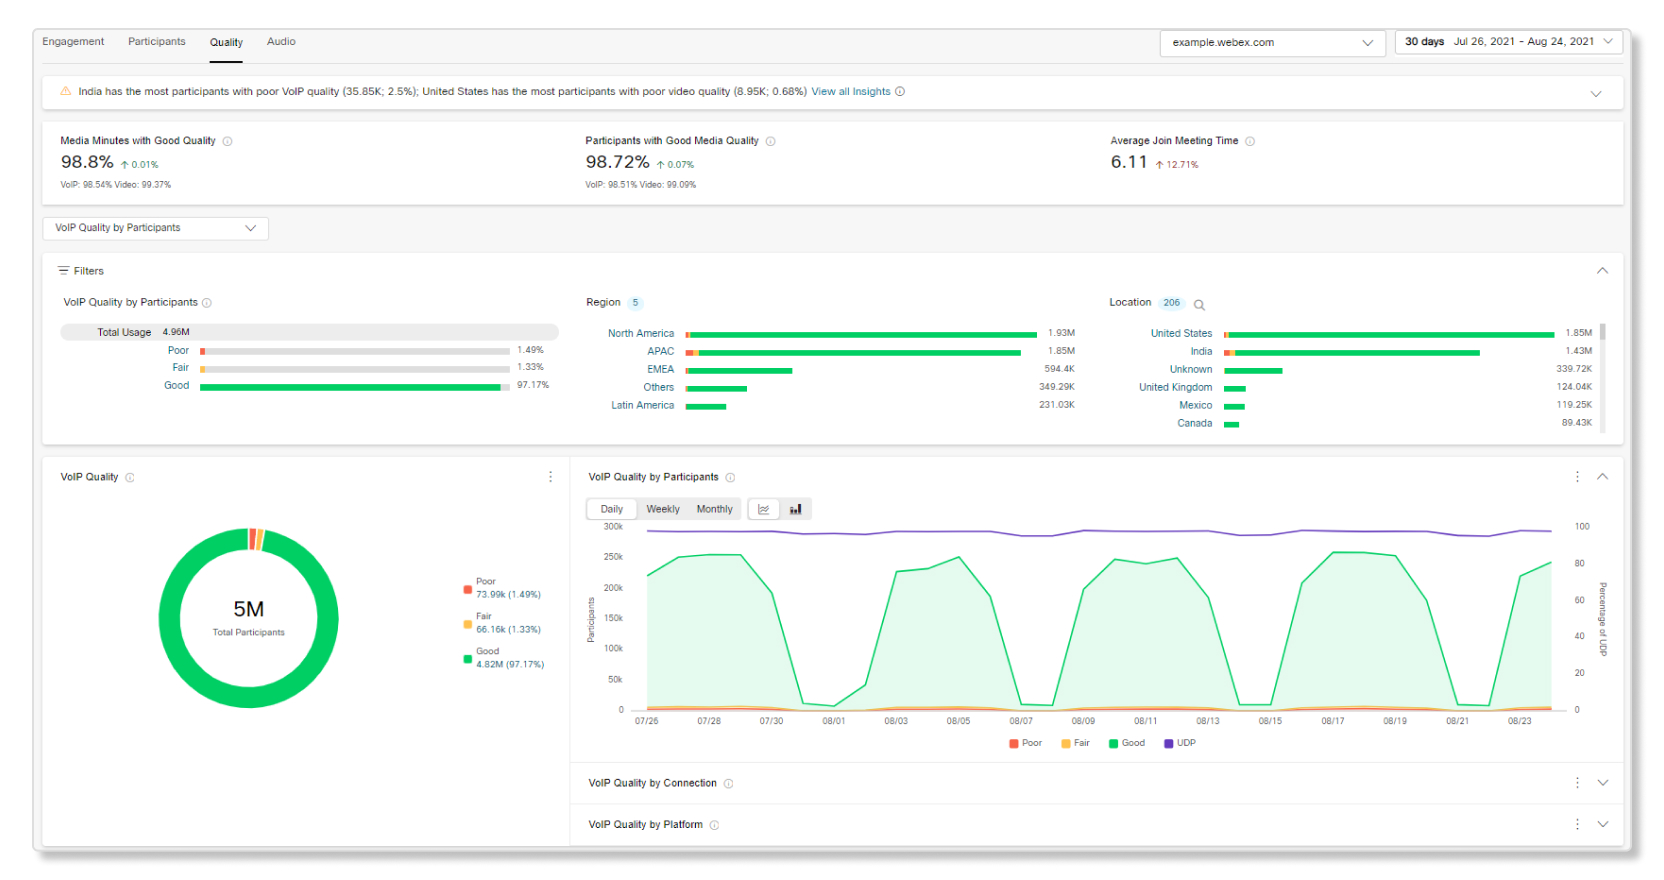
The quality page in Meetings analytics has been split up into three sections to get a more deeper understanding of quality of service for VoIP, video, and join meeting times, along with new charts added for each section.
-
New charts for VoIP quality, video quality, and join meeting time sections
-
Added a chart that compares internal and external users.

-
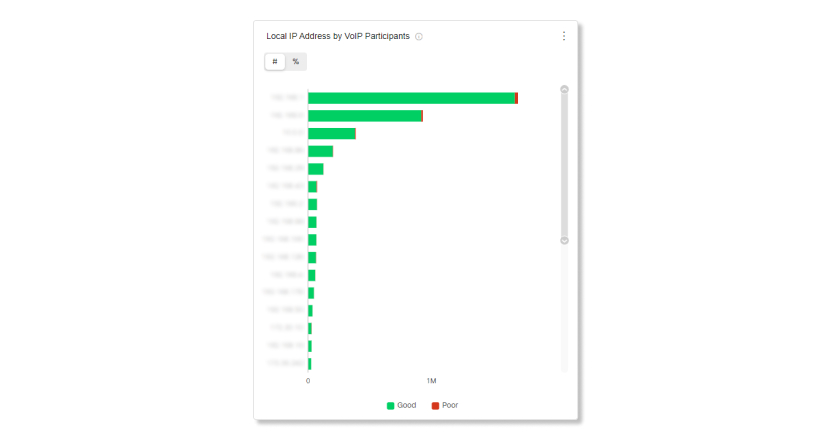
Added a chart that shows the local IP addresses of participants.
-
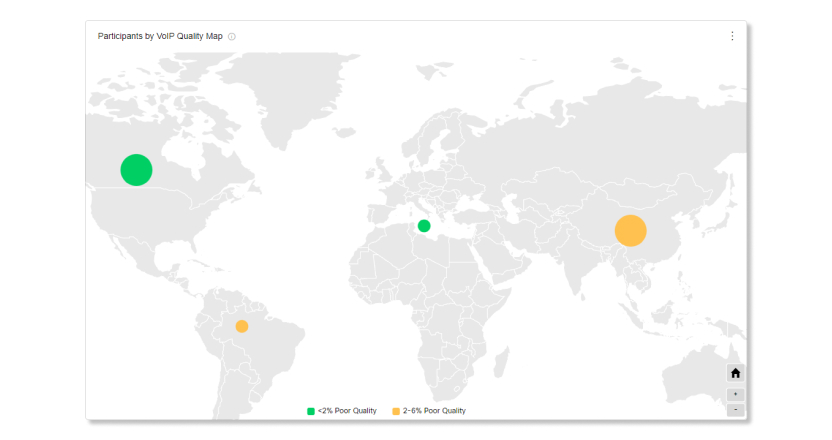
Added a world map that shows the number of participants and media quality by location.
-
Added a chart that show trending data for packet loss, latency, and jitter.

-
Added a chart that shows the average join meeting time and percentiles.

-
September 2021
View troubleshooting data for webcasts
You can now search for and view media quality data for webcasts hosted in Webex Events (new).
View troubleshooting data for Webex Room Devices used in Microsoft's Cloud Video Interop
You can now view media quality data for cloud-registered Webex Room devices that were used in Microsoft Teams meetings through Microsoft's Cloud Video Interop (CVI).
Historical Meetings Data API Now Available
You can now access analytics data related to Webex Meetings with the new Historical Data related to Meetings API. This allows you access to pull large-scale data into your own business intelligence system.
For more information, see the Historical API developer page.
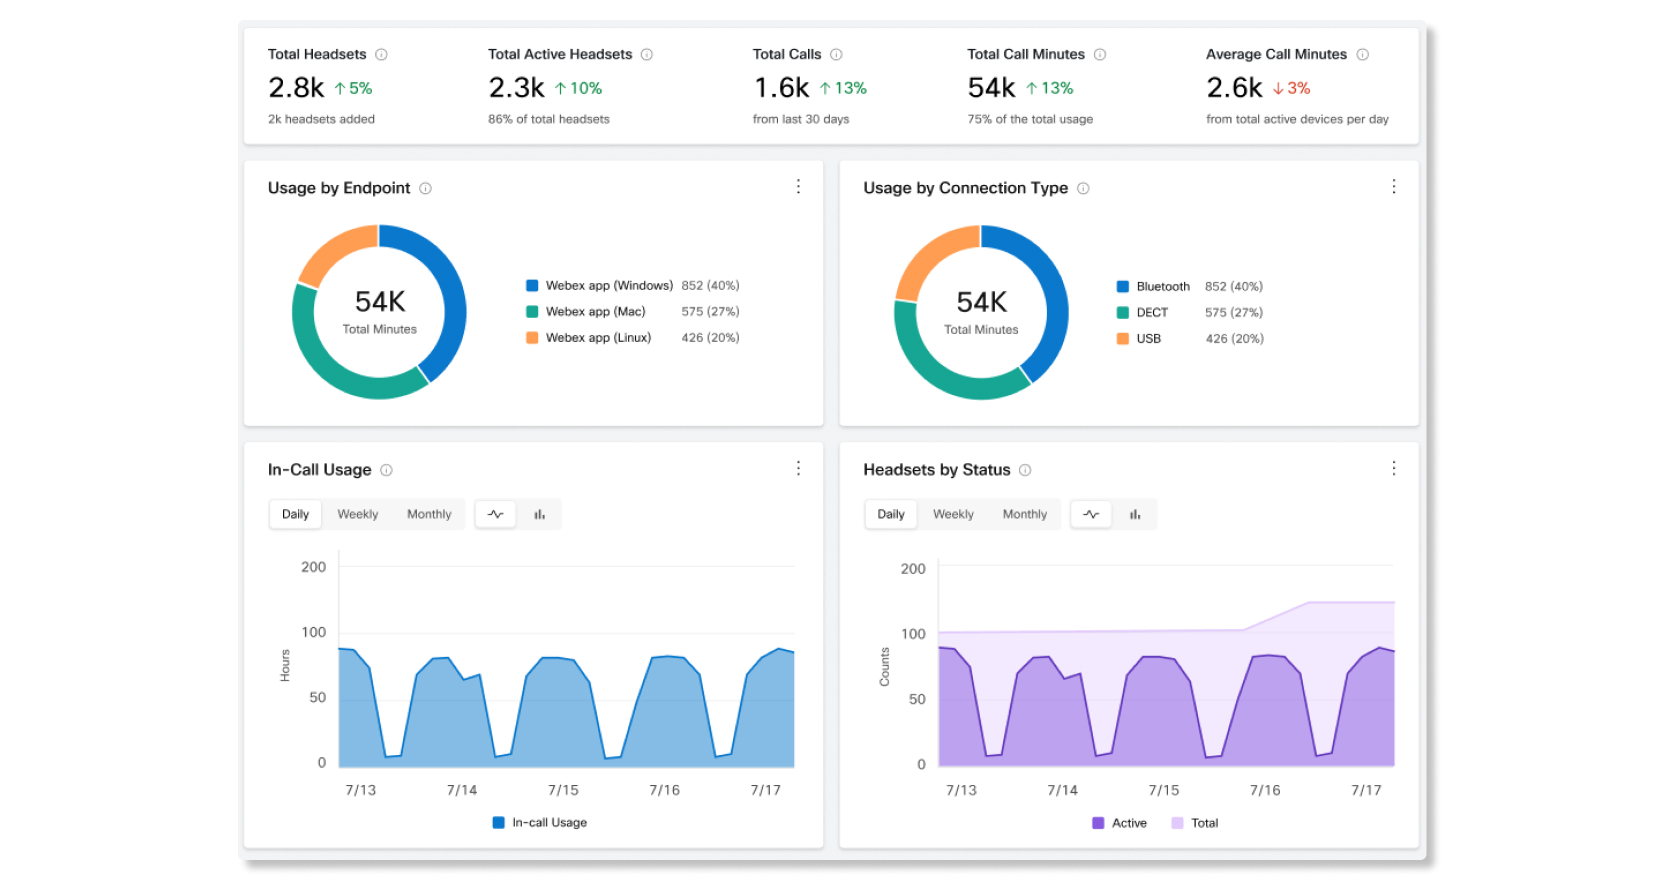
Cisco Headsets Analytics
You can now view usage data for Cisco Headsets by country, model, and connection type to help determine how your organization is utilizing all the headsets.
Personal Insights for Users in Your Organization
You can now enable Personal Insights for your organization. Personal Insights allow users to get insights and analysis on how they're spending their time in meetings. They can set and achieve goals, see how their work-life balance can be improved, build better quality connections, and a more inclusive work experience for all.
For more information, see Enable Personal Insights.
End-to-end Encryption Column Added to Meetings Details Report
The Meetings Details report now shows if meetings had end-to-end encryption enabled in the IS_E2EE column.
Messaging Analytics Enhancements
The following enhancements were made to get more visibility into messaging users:
-
Added web client and Linux platform data.
-
New chart that shows how many local files have been shared.
-
New chart that shows the top 300 users that sent messages in the last 30 days.
-
New chart that shows the top 300 users that shared files in the last 30 days.
August 2021
Webex for Government: New Features for Analytics, Diagnostics, and Reports
Analytics, Diagnostics, and Reports for Webex for Government organizations have been updated to the latest designs that match up to the July release in commercial organizations.
Data for Join Meeting time and Webex Events (new) in Diagnostics and API support in Reports will be available at a later time for Webex for Government organizations. |
-
Webex for Government Meetings Analytics
-
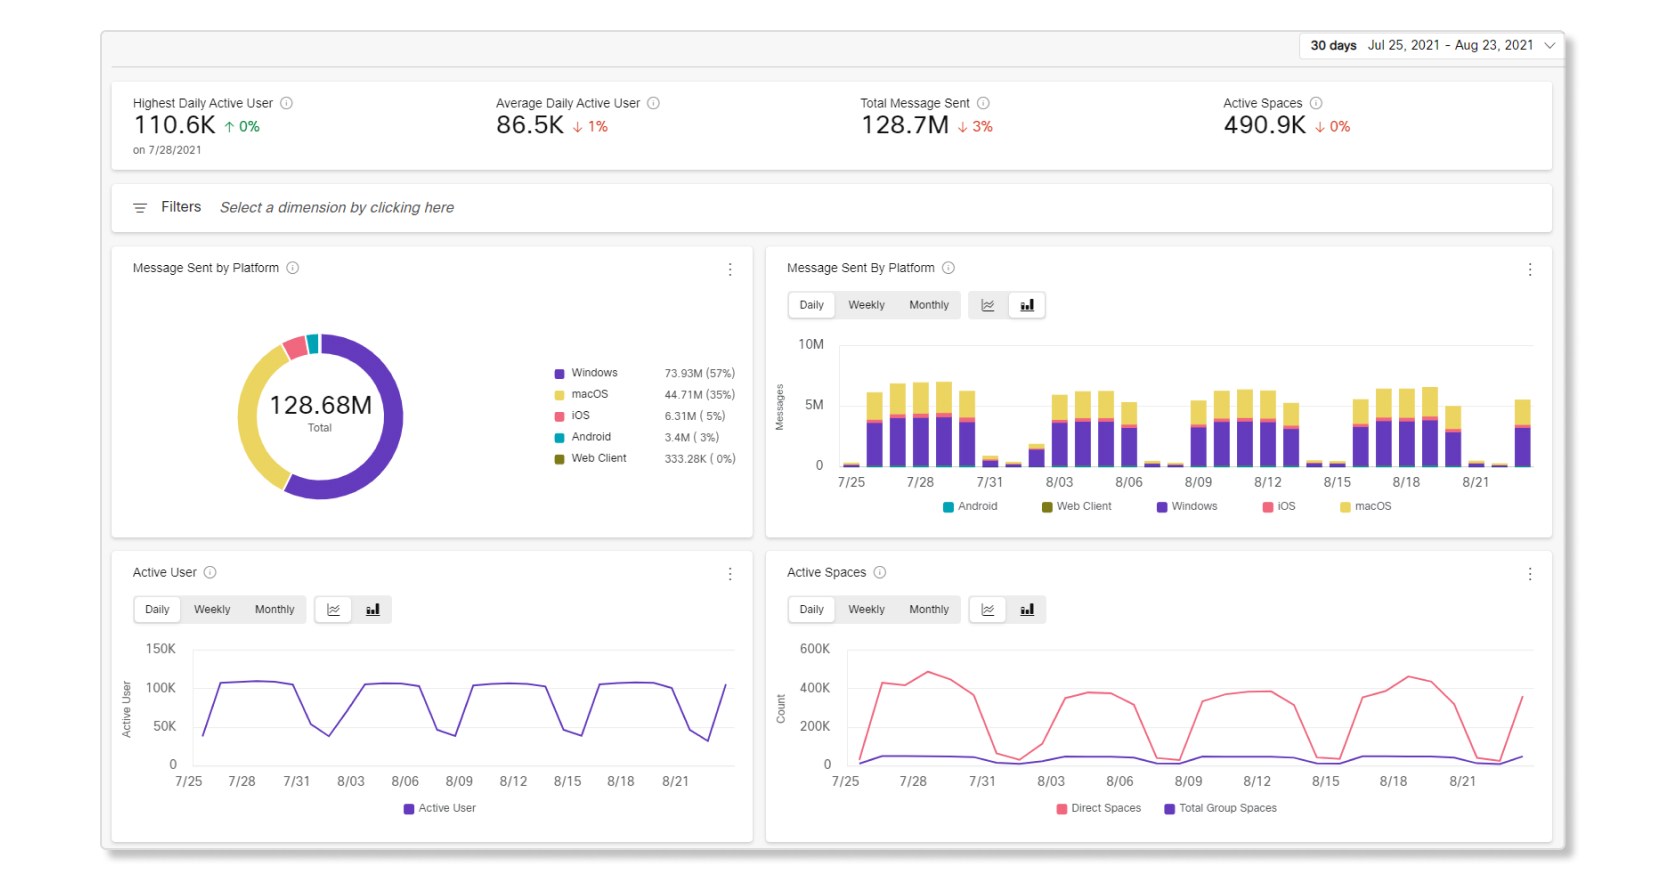
Improved loading time performance when viewing data to seconds.
-
Updated designs for charts and KPIs.
-
-
Webex for Government Messaging Analytics
-
Improved loading time performance when viewing data to seconds.
-
Updated designs for charts and KPIs.
-
-
Webex for Government Calling Analytics
-
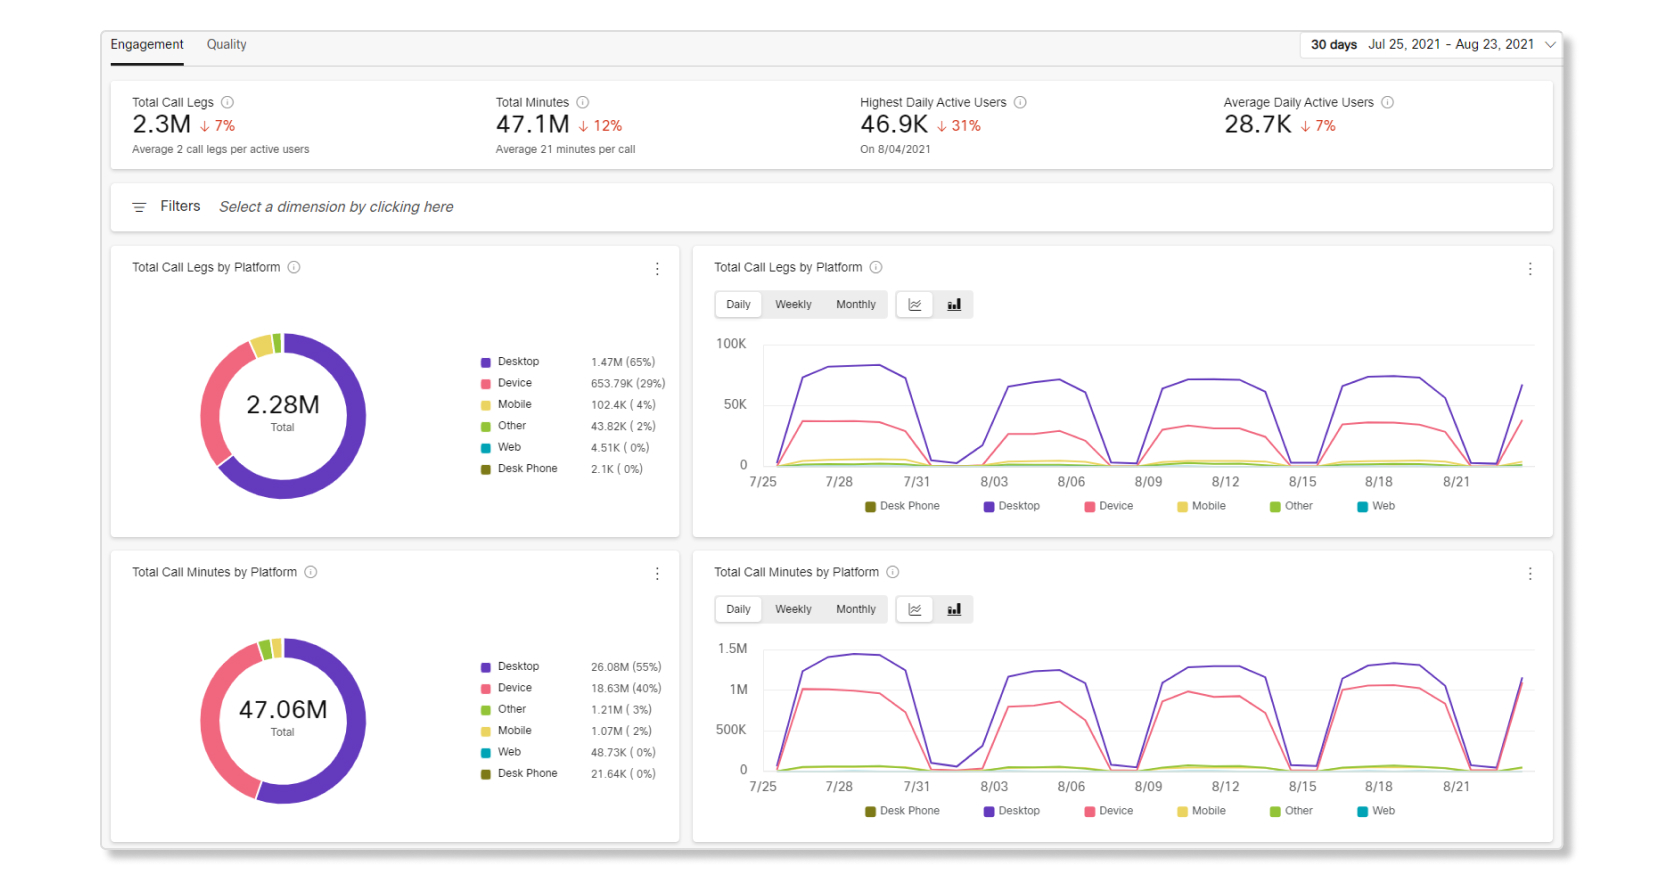
New page for analytics about calls when using Call on Webex in the Webex app. You can track which platforms users are calling from and the quality of their calls.
-
-
Webex for Government Devices Analytics
-
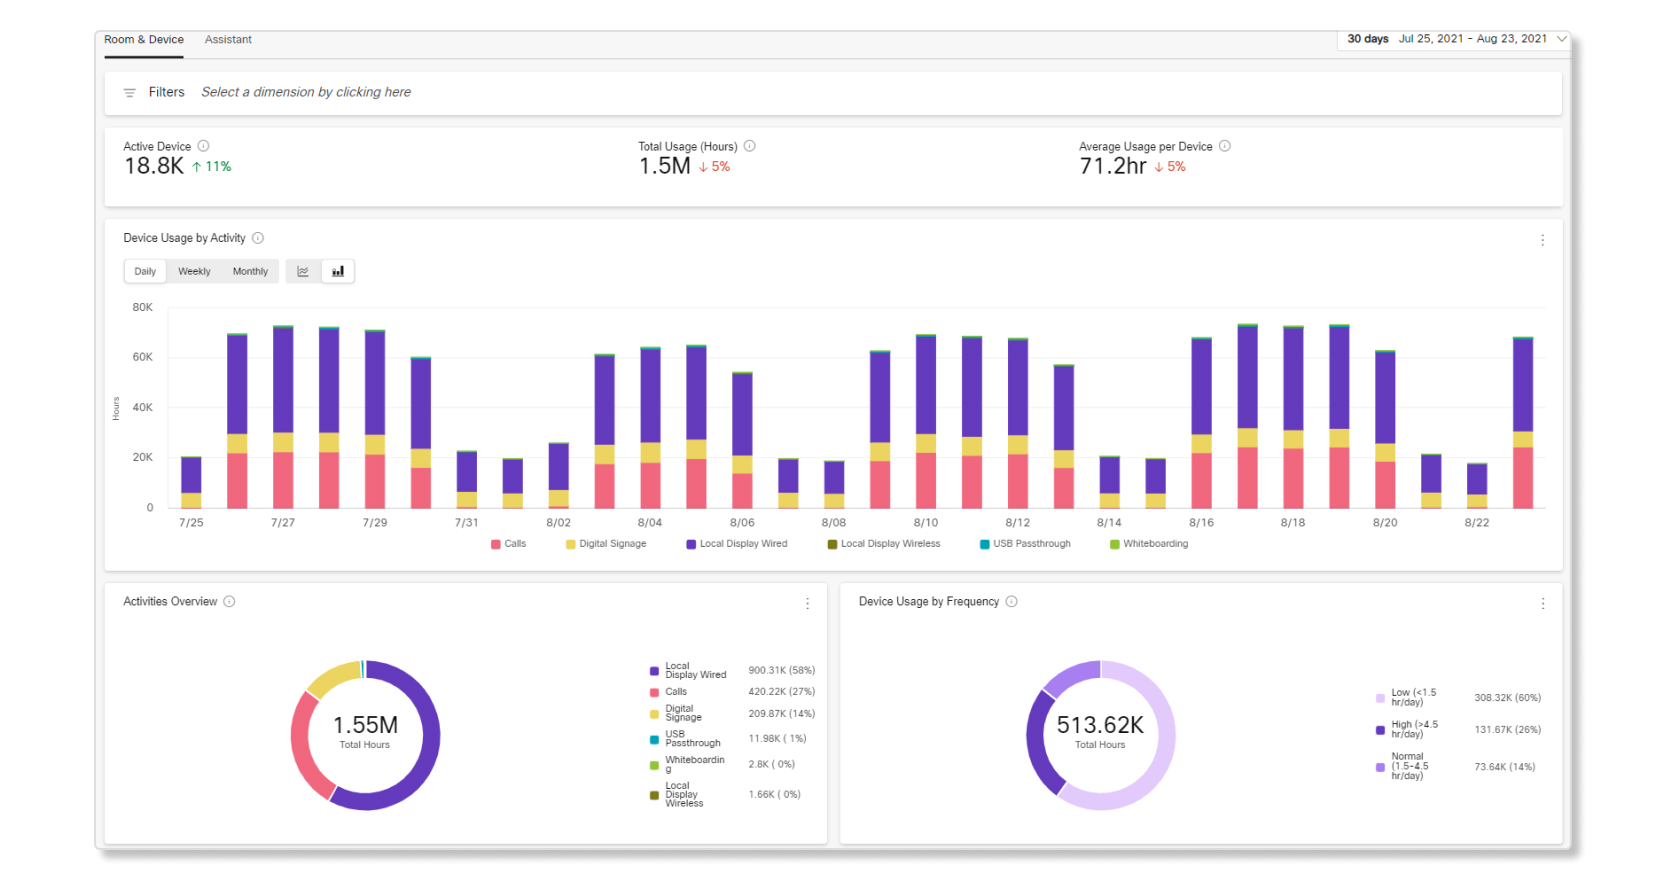
New page for analytics about device usage. You can track which devices are being used for what activities and how often they're being used.
-
-
Webex for Government Reports
-
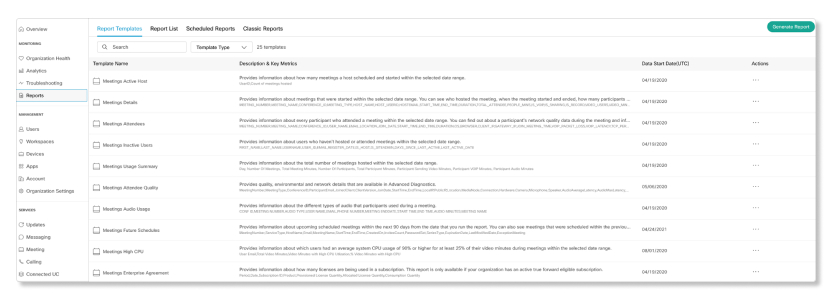
The Reports tab in Analytics now has its own section under Monitoring on the left navigation of Control Hub. You can also now schedule reports to run automatically in a daily, weekly, or monthly format.
-
Added new Meetings and Messaging CSV reports.
-
-
Webex for Government Diagnostics
-
New KPIs and a meeting summary have been added in the meeting details page.
-
You can now click on a filter that shows all participants with network quality issues.
-
You can now search for a specific participant or filter participants by a certain category when looking in the meeting details page.
-
New Devices CSV Report
A new report that provides historical data about the devices set up in your organization is now available. This report helps you see which devices are being used for what activity, and can help you see if there are devices that are being underutilized.
New Onboarding Summary Report
A new report that provides data about the count of users that were onboarded to your organization is now available.
July 2021
Unified Search for Webex Meetings and Webex App to Webex App Calls
You can now search and view media quality data for direct calls made using Call on Webex in Diagnostics.
Support for Webex Events (New) and Webex Events (Classic) in Diagnostics
You can now view media quality data for events in Webex Events (new) and Webex Events (classic).
Virtual Background and Breakout Sessions Indicator in Reports
The Meetings Attendees report has been updated to include a column that lets you know when attendees used a virtual background and if they joined a breakout session.
June 2021
Search and Filter Participants in Diagnostics
You can now search for a specific participant or filter participants by a certain category when looking at the meeting details page.
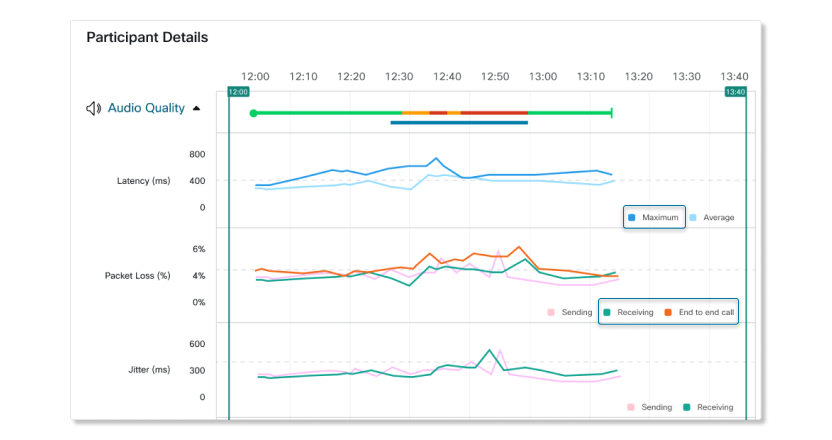
Max Latency and Average Packet Loss Details
You can now see the maximum latency and the average receiving packet loss of participants in Diagnostics. Both of these metrics are captured every minute. These metrics can help you figure out where the source of network issues is coming from faster.
Events Report
A new report that provides historical data for events hosted in Webex Events (new) is now available for you to download. You can use this report to get a list of all the past events hosted in your organization to find out the event ID, who the host was, when the event started and ended, if it was a webcast or event, and more.
Real-Time Data for Audio tab in Meetings Analytics
The Audio tab in Meetings Analytics now has near real-time data available within 10 minutes of when a meeting starts, just like the Engagement, Participants, and Quality tabs.
Meeting Analytics Multi-Site Selection
You can now combine Meetings data from multiple Webex sites into one dashboard with the Webex site selection in Meetings Analytics.
Improved Navigation for Reports
The Reports tab in Analytics now has its own section under Monitoring on the left navigation of Control Hub.

Updated Quality Data in Meetings Attendees Report
The Meetings Attendees report now shows each participant's media quality metrics like the max and average packet loss, jitter, and latency, hardware, CPU information, data center that they connected to, and the client type and version used to join the meeting.
The following column names have also been renamed:
-
CLIENT_IPtoLOCAL_IP -
GATEWAY_IPtoPUBLIC_IP -
VOIP_PACKET_LOSStoVOIP_RECEIVING_AVERAGE_PACKET_LOSS -
VOIP_LATENCYtoVOIP_AVERAGE_LATENCY
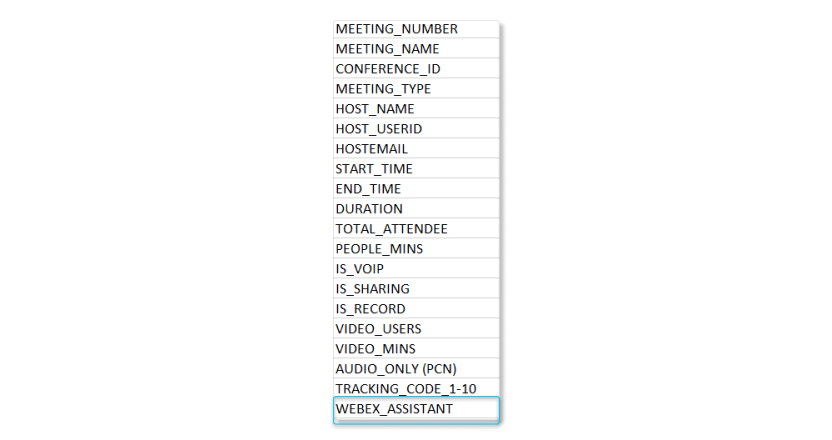
In addition, the calculation for VOIP_RECEIVING_AVERAGE_PACKET_LOSS and VOIP_AVERAGE_LATENCY have been changed to align with the same calculation in Analytics and Troubleshooting. The following table compares the previous and updated column names for the Meetings Attendees report.
|
Previous Column Names |
Updated Column Names |
|---|---|
|
MEETING_NUMBER |
MEETING_NUMBER |
|
MEETING_NAME |
MEETING_NAME |
|
CONFERENCE_ID |
CONFERENCE_ID |
|
USER_NAME |
USER_NAME |
|
|
|
|
LOCATION |
LOCATION |
|
JOIN_DATE |
JOIN_DATE |
|
START_TIME |
START_TIME |
|
END_TIME |
END_TIME |
|
DURATION |
DURATION |
|
OS |
OS |
|
BROWSER |
BROWSER |
|
CLIENT_IP |
LOCAL_IP |
|
GATEWAY_IP |
PUBLIC_IP |
|
JOIN_MEETING_TIME |
JOIN_MEETING_TIME |
|
VOIP_PACKET_LOSS |
VOIP_RECEIVING_AVERAGE_PACKET_LOSS |
|
VOIP_LATENCY |
VOIP_AVERAGE_LATENCY |
|
TCP_PERCENTAGE |
TCP_PERCENTAGE |
|
UDP_PERCENTAGE |
UDP_PERCENTAGE |
|
IS_CMR |
IS_CMR |
|
IS_SHARING |
IS_SHARING |
|
IS_RECORD |
IS_RECORD |
|
VIDEO_MINUTES |
VIDEO_MINUTES |
|
CLIENT | |
|
CLIENT_VERSION | |
|
MEDIA_NODE | |
|
CONNECTION | |
|
HARDWARE | |
|
CAMERA | |
|
MICROPHONE | |
|
SPEAKER | |
|
VOIP_AVERAGE_LATENCY | |
|
VOIP_MAX_LATENCY | |
|
VOIP_RECEIVING_AVERAGE_PACKET_LOSS | |
|
VOIP_RECEIVING_MAX_PACKET_LOSS | |
|
VOIP_SENDING_AVERAGE_PACKET_LOSS | |
|
VOIP_SENDING_MAX_PACKET_LOSS | |
|
VOIP_RECEIVING_AVERAGE_JITTER | |
|
VOIP_RECEIVING_MAX_JITTER | |
|
VOIP_SENDING_AVERAGE_JITTER | |
|
VOIP_SENDING_MAX_JITTER | |
|
VIDEO_AVERAGE_LATENCY | |
|
VIDEO_MAX_LATENCY | |
|
VIDEO_RECEIVING_AVERAGE_PACKET_LOSS | |
|
VIDEO_RECEIVING_MAX_PACKET_LOSS | |
|
VIDEO_SENDING_AVERAGE_PACKET_LOSS | |
|
VIDEO_SENDING_MAX_PACKET_LOSS | |
|
VIDEO_RECEIVING_AVERAGE_JITTER | |
|
VIDEO_RECEIVING_MAX_JITTER | |
|
VIDEO_SENDING_AVERAGE_JITTER | |
|
VIDEO_SENDING_MAX_JITTER | |
|
CPU_APPLICATION_AVERAGE | |
|
CPU_APPLICATION_MAX | |
|
CPU_SYSTEM_AVERAGE | |
|
CPU_SYSTEM_MAX | |
April 2021
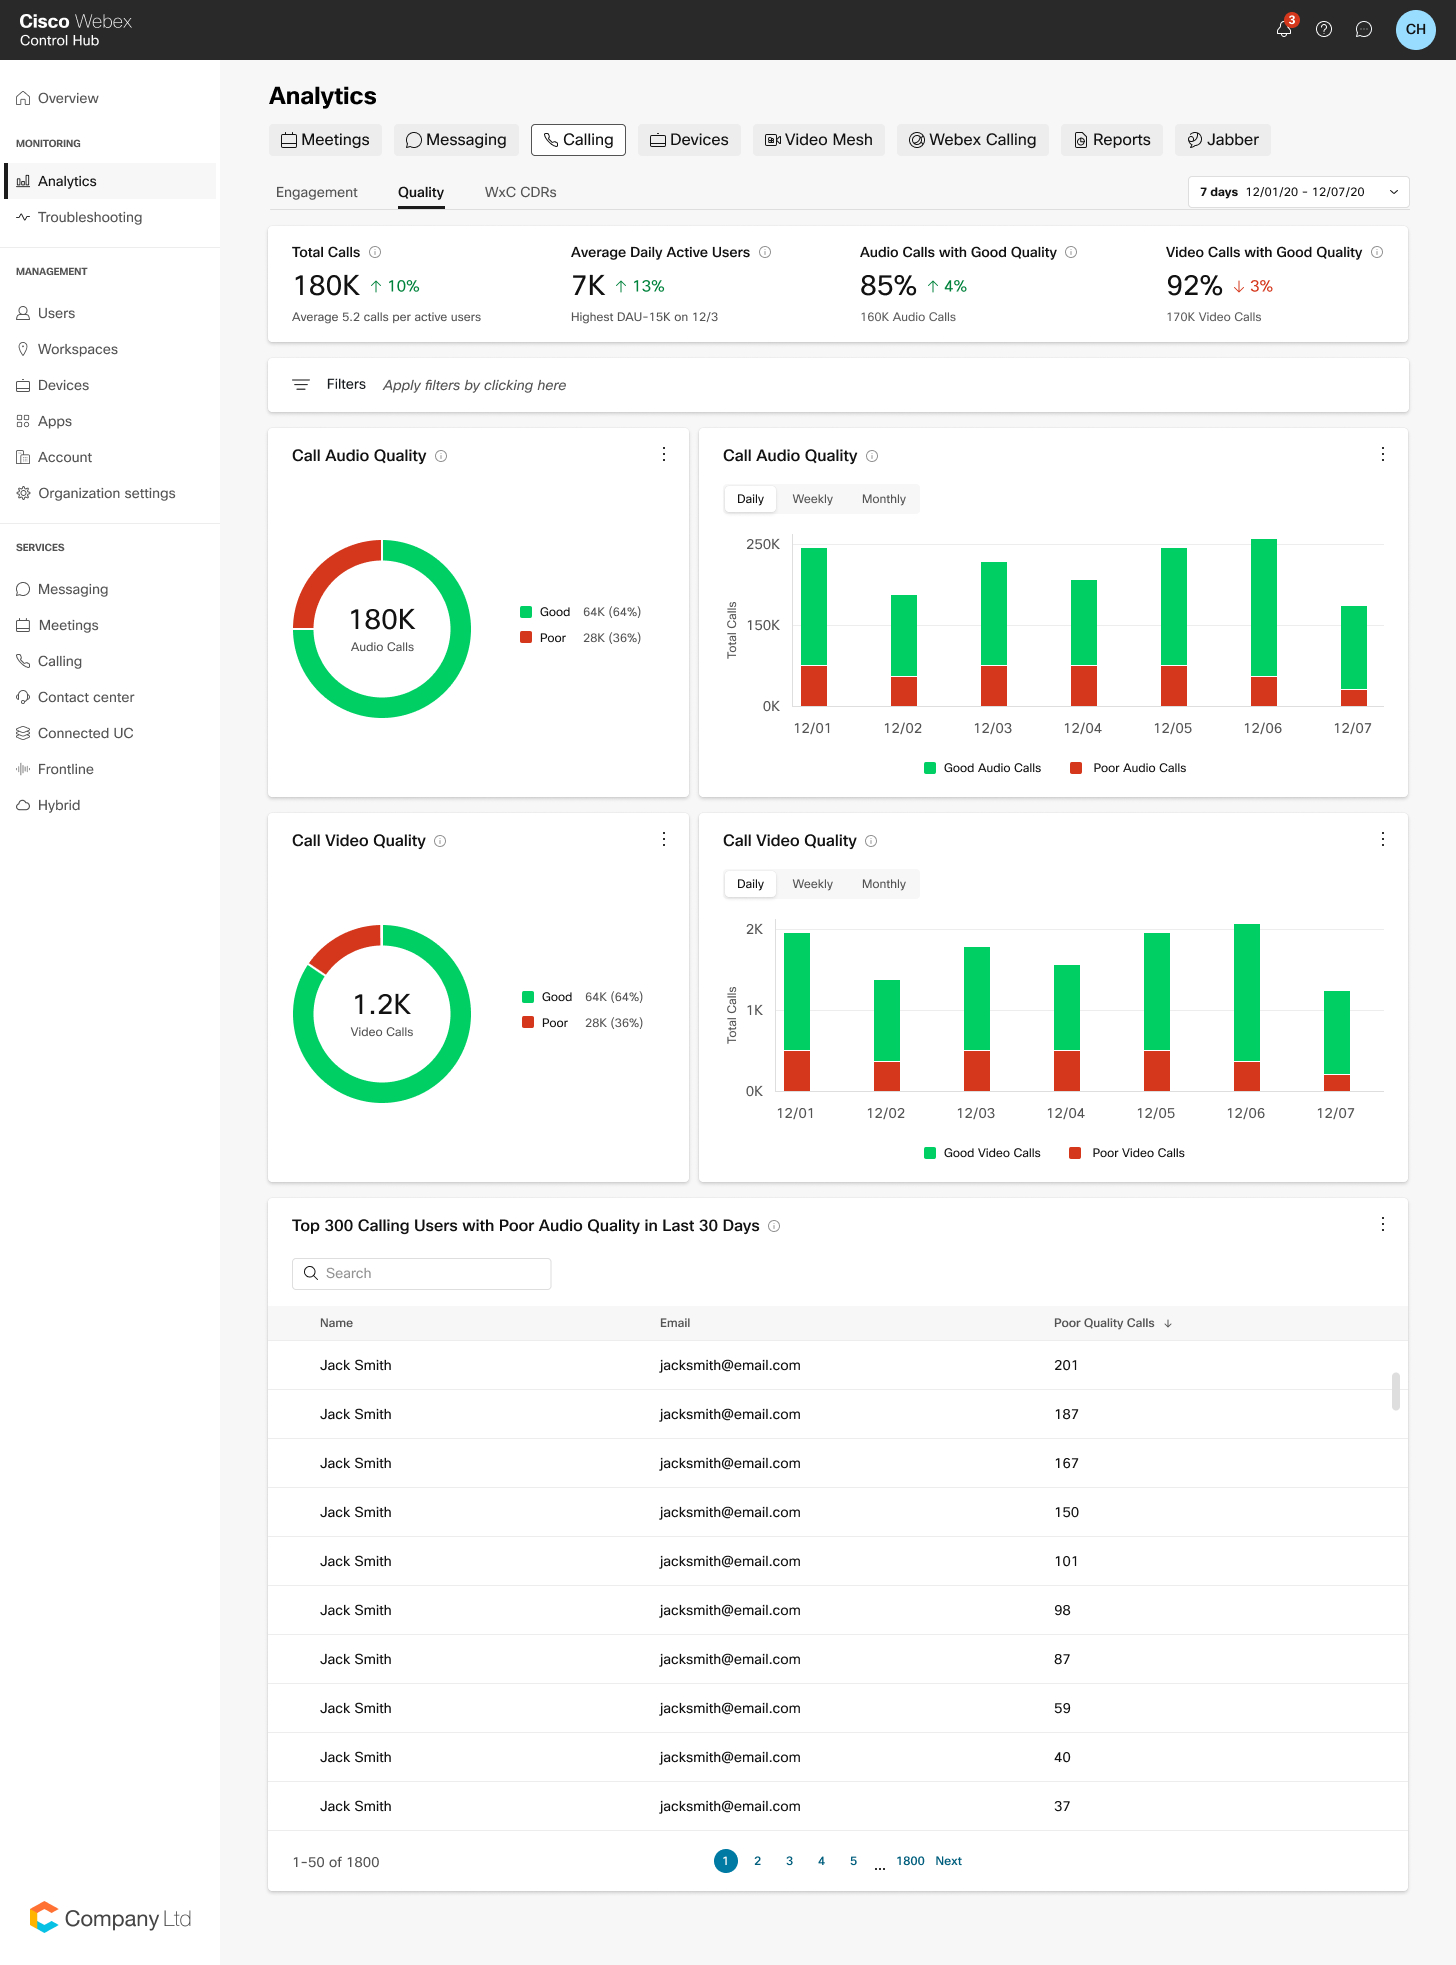
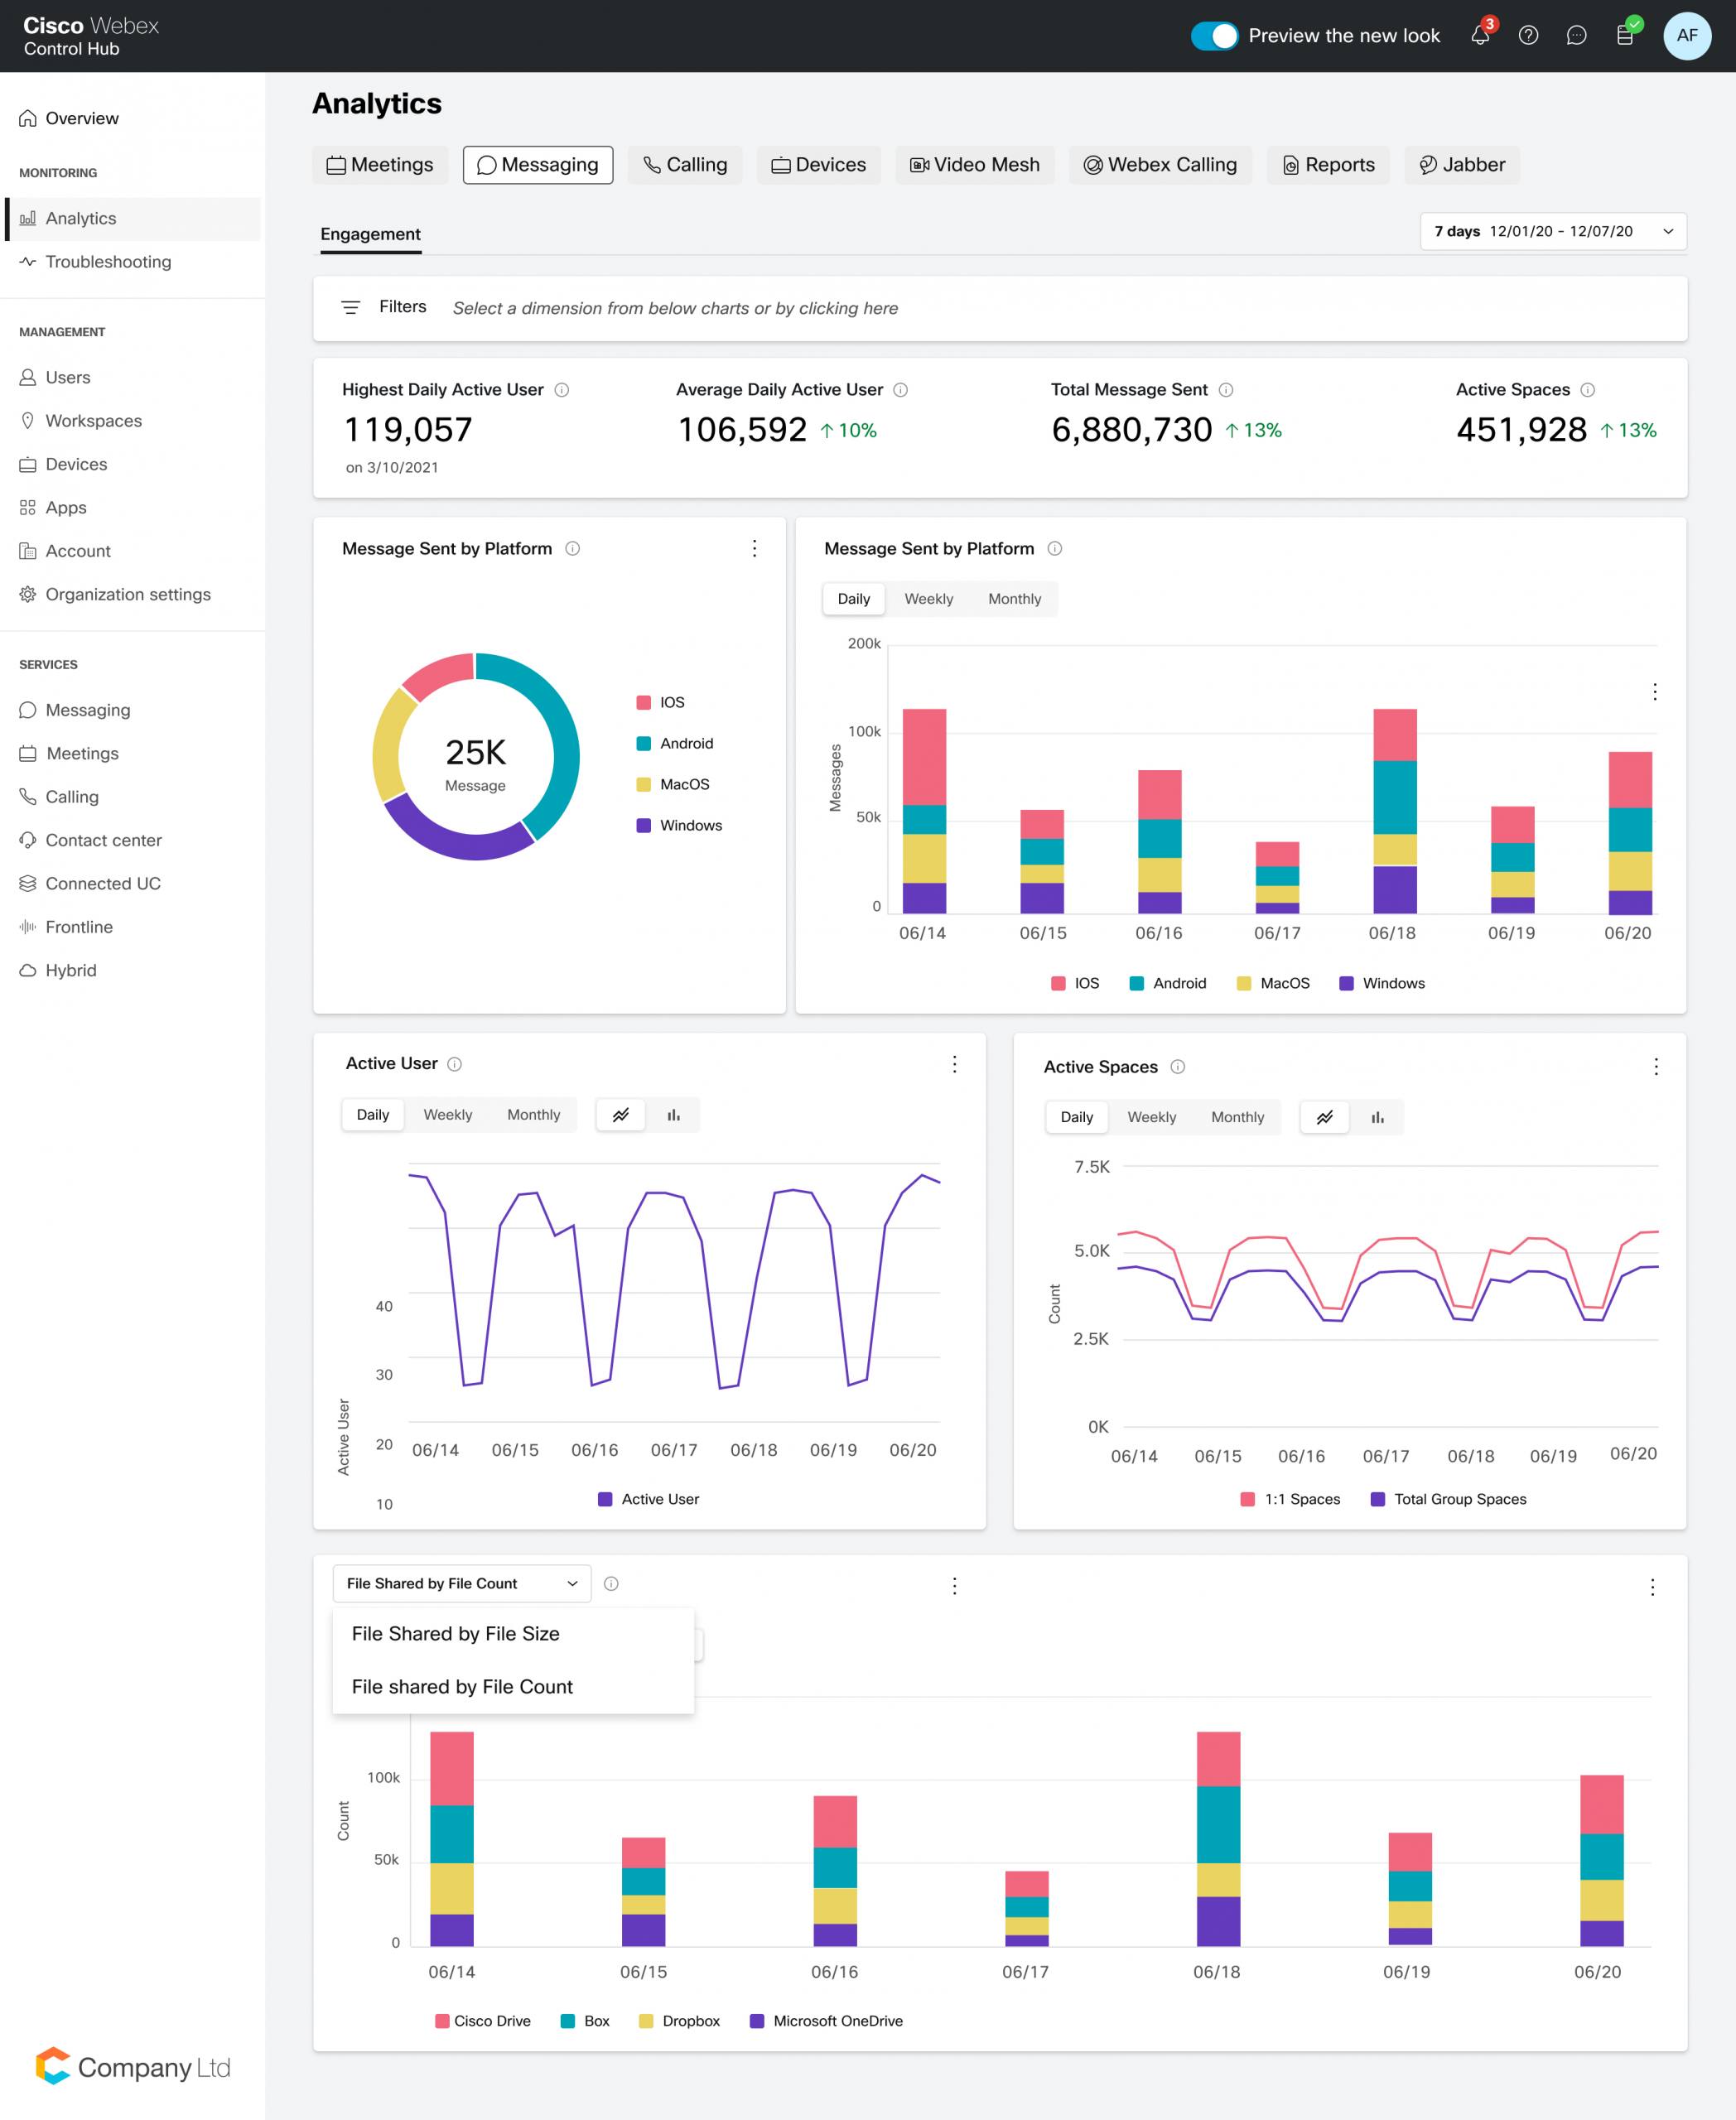
Redesigned Analytics: Calling and Messaging
We're adding redesigned analytics for messaging and calling, expanding a better analytics experience across the suite of services. The Analytics pages are designed with a user-friendly layout showing key performance metrics, contextual filtering, and faster load times.
Revamped Video Mesh Analytics Page
The Video Mesh Analytics page is getting updated with separate KPIs for the Engagement, Resources, and Bandwidth Usage tabs, updated charts with more detailed data, and faster load times for the data.
Video Mesh Engagement Tab Redesign
Added the following KPIs that provide data on activities used during meetings:
-
Total Call Legs
-
On-Premises Call Legs
-
Cloud Call Legs
-
Overflowed to Cloud Call Legs
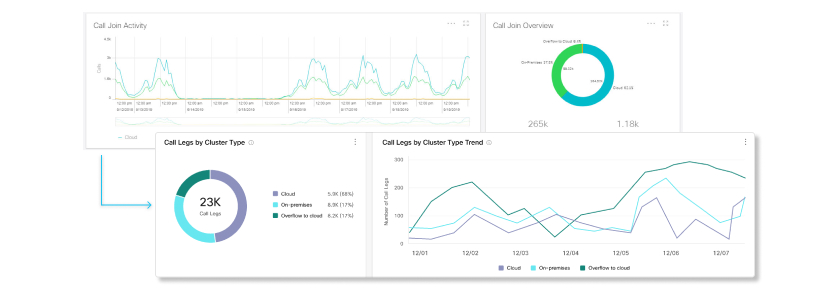
The Call Join Overview and Call Join Activity charts have been updated to the Call Legs by Cluster Type and Call Legs by Cluster Type Trend charts.
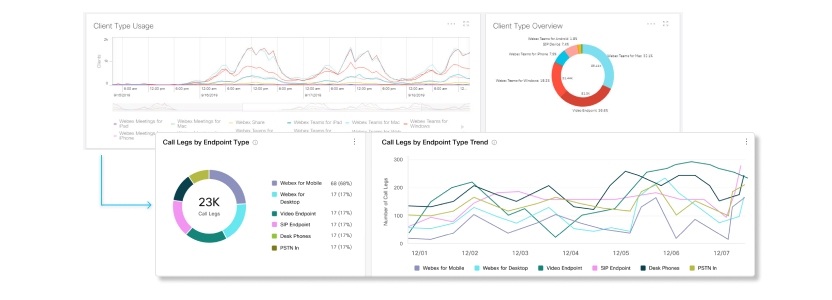
The Client Type Overview and Client Type Usage charts have been updated to the Call Legs by Endpoint Type and Call Legs by Endpoint Type Trend charts.
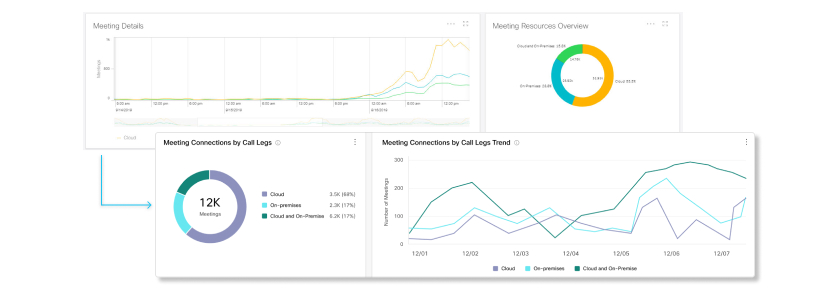
The Meeting Resources Overview and Meeting Details charts have been updated to the Meeting Connections by Call Legs and Meeting Connections by Call Legs Trend.
Video Mesh Resources Tab Redesign
Added the following KPIs that provide data on Video Mesh clusters in your organization:
-
Avg Cluster Availability
-
Overflowed to Cloud Call Legs
-
Redirected Call Legs

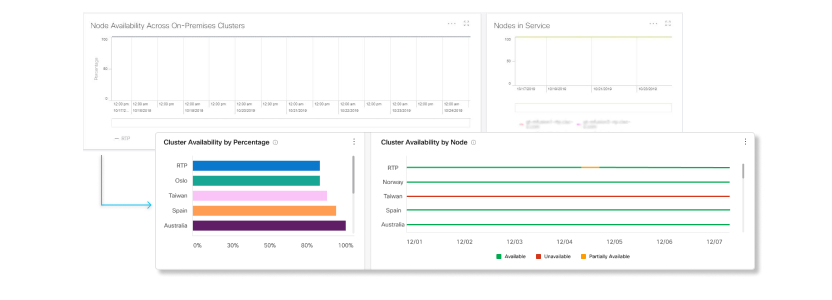
The Percentage of Node Availability Per Cluster, Node Availability Across On-Premises Clusters, and Nodes in Service charts have been updated to the Cluster Availability by Percentage, Cluster Availability by Node, and Node Availability charts.
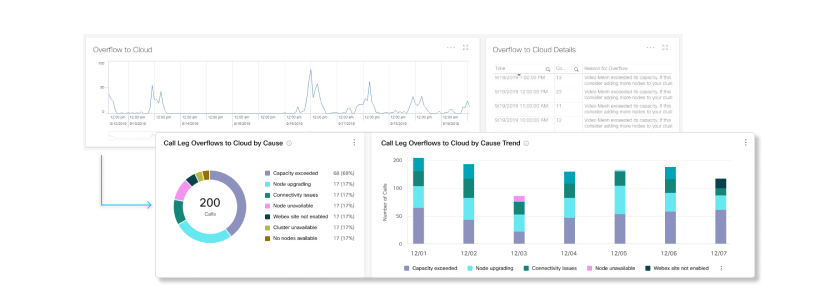
The Overflow to Cloud chart has been updated to the Call Leg Overflows to Cloud by Cause and Call Leg Overflows to Cloud by Cause Trend charts.
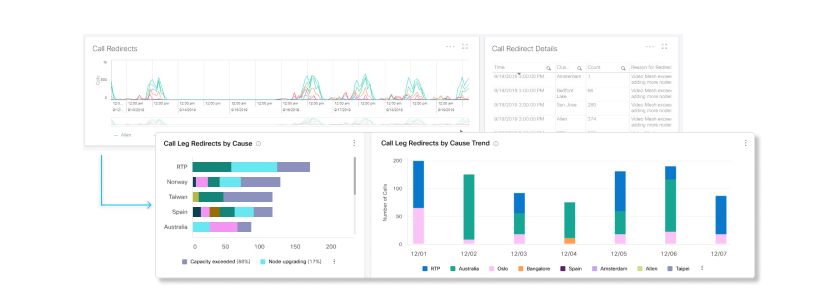
The Call Redirects chart has been updated to the Call Leg Redirects by Cause and Call Leg Redirects by Cause Trend charts.
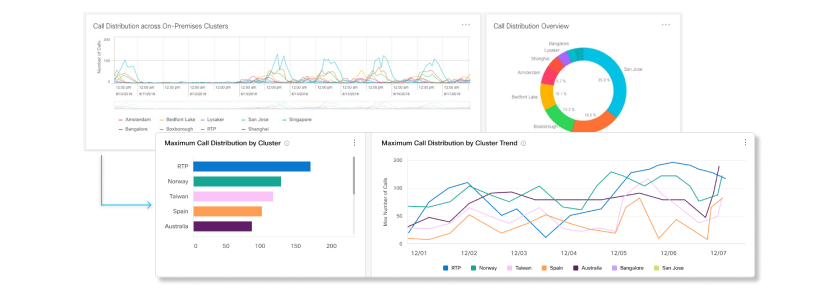
The Call Distribution Overview and Call Distribution Across On-Premises Clusters charts have been updated to the Maximum Call Distribution by Cluster and Maximum Call Distribution by Cluster Trend charts.
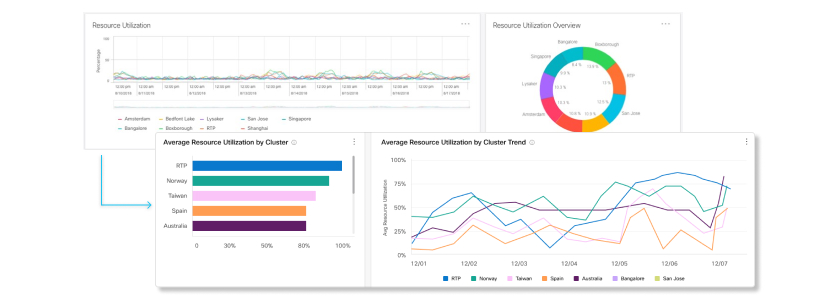
The Resource Utilization Overview and Resource Utilization charts have been updated to the Average Resource Utilization by Cluster and Average Resource Utilization by Cluster Trend charts.
Video Mesh Bandwidth Usage Tab Redesign
Added the following KPIs that provide data on the usage of Video Mesh clusters in your organization:
-
Total Data Usage
-
Transmitted Data Usage
-
Received Data Usage
-
Audio Data Usage
-
Video Data Usage

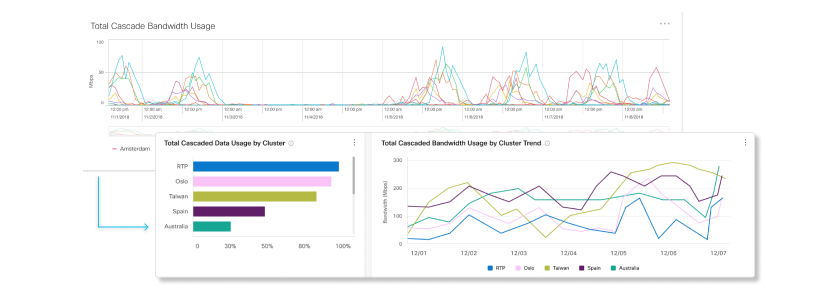
The Total Cascade Bandwidth Usage chart has been updated to the Total Cascaded Data Usage by Cluster and Total Cascaded Bandwidth Usage by Cluster Trend charts.
The Cascade Bandwidth Usage chart has been updated to the Total Cascaded Data Usage by Data Transmission and Total Cascaded Bandwidth Usage by Data Transmission Trend charts.
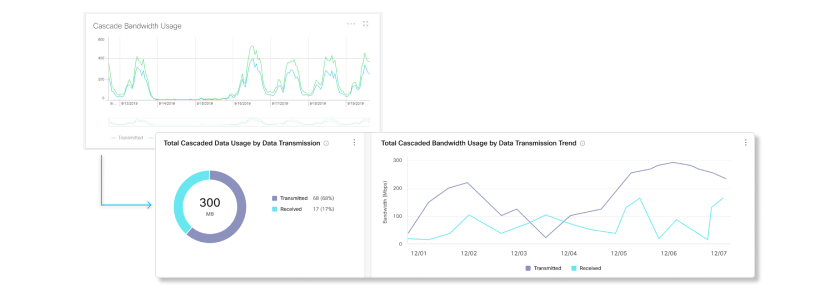
The Cascade Bandwidth Usage Across Streams chart has been updated to the Total Cascaded Data Usage by Stream and Total Cascaded Bandwidth Usage by Stream Trend charts.
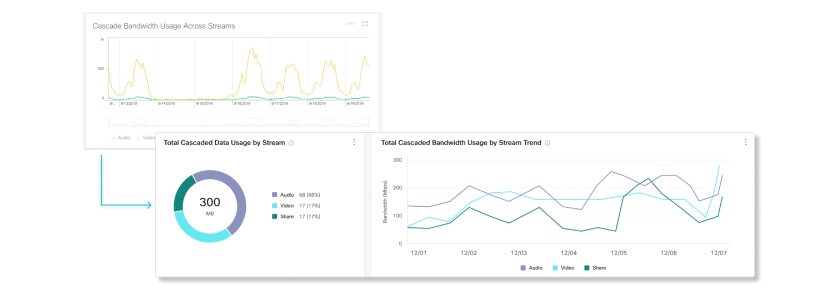
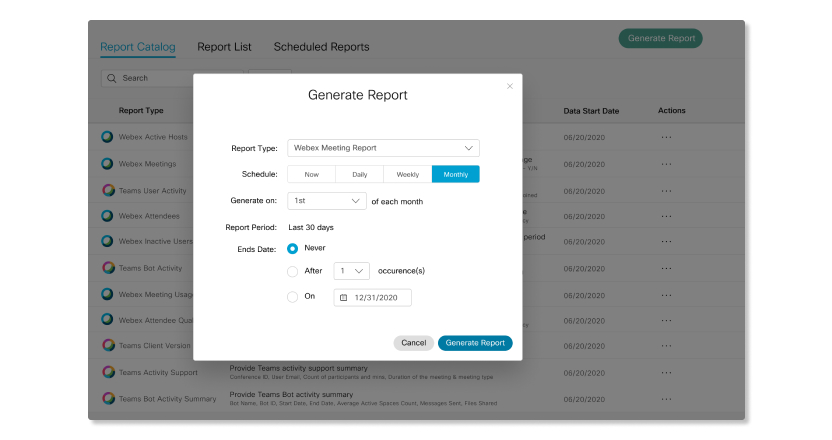
Revamped Reports and Report Scheduler
The Reports page was revamped to provide you with an easy-to-read catalog of reports that are available for you to download. You can also now schedule reports to run automatically in a daily, weekly, or monthly format instead of manually running a report each time.
Meeting Network Quality Trending Alert
The Meeting Network Quality Trending alert inspects the quality of all meetings at the end of each day and then sends out an alert if the average network performance is trending down. You can use this alert to catch possible network issues early so that future meetings can run smoothly.
Cloud-Registered Video Device Support and Average System CPU for VIP Live Meeting Quality Issue Alert
You can now monitor room devices and set a threshold for average system CPU with the VIP Live Meeting Quality Issue alert.
February 2021
Revamped Meetings Analytics Engagement Page
The Meetings Engagement page was revamped with separate KPIs and is now split into two tabs, Engagement and Participants. The Engagement tab shows KPIs and metrics for the types of activities that participants did during meetings. The Participants tab shows KPIs and metrics for how participants joined meetings.
Meetings Engagement Tab Redesign
Added the following KPIs that provide data on activities used during meetings:
-
Total Meetings
-
Total Meeting Minutes
-
Total Video Meetings
-
Total Sharing Meetings
-
Total Recording Meetings

The Usage by Meetings and Usage by Activity charts have been combined into the Meetings by Activity chart. This chart also captures data for when a meeting was recorded.

Two new Meeting Minutes by Activity charts have been added. These charts show how many minutes each activity was used for during meetings.

New Meetings Participants Tab
Added the followings KPIs that provide data about hosts and participants:
-
Total Meetings
-
Total Unique Hosts
-
Total Participants

The Join Method chart has been updated to the Participants by Join Method charts.
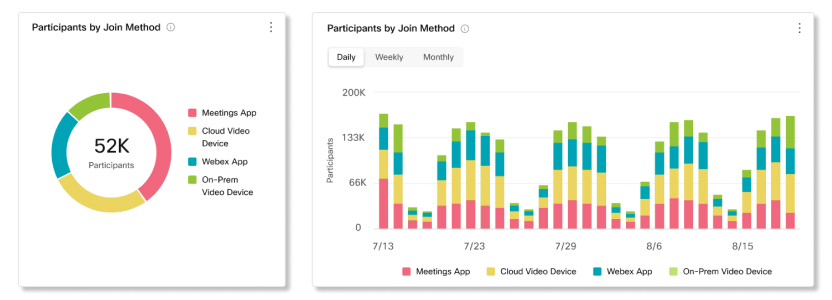
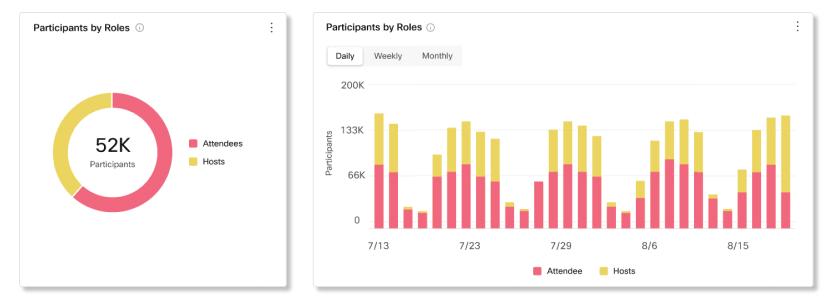
The Participants by Roles chart has been updated with a new look and now captures hosts and attendees instead of hosts and participants.
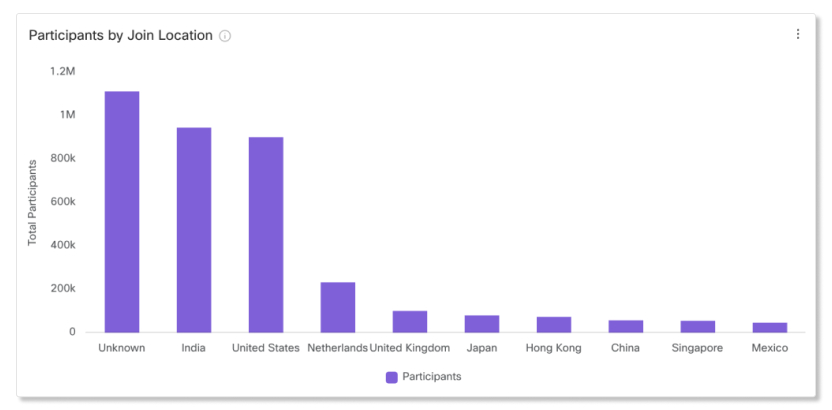
The Usage by Location chart has been updated to the Participants by Join Location charts.
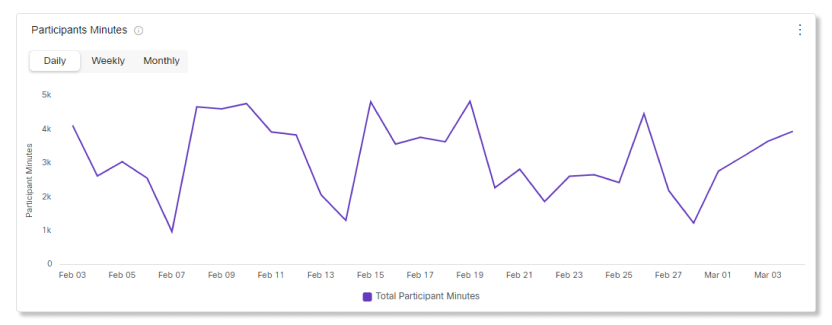
The Usage by Participant Minutes chart has been updated to the Participant Minutes chart.
Revamped Meetings Analytics Audio Page
The Meetings Audio page was revamped with separate KPIs and metrics for VoIP minutes, telephony minutes, and audio-only meetings, plus more trending charts with summary statistics. The added KPIs are:
-
Total Audio Minutes
-
Total VoIP Minutes
-
Total Telephony Minutes

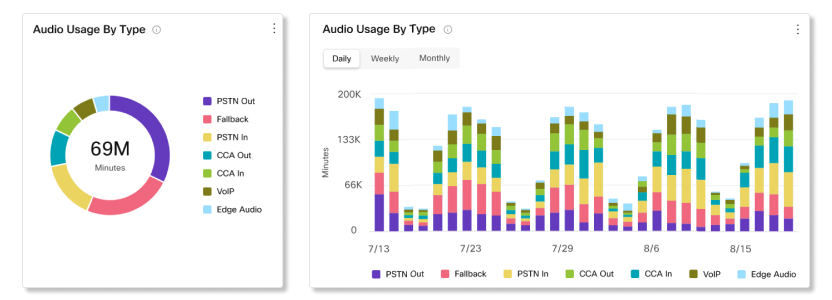
The Audio Sources chart has been combined into the Audio Usage By Type chart.
The Participant Details table has been removed and is now available as the Webex Attendee report in the Reports tab. You can also download the Webex Meeting Audio Usage report for audio details.
Webex Assistant for Meetings Indicator in Webex Meeting Report
You can now see which meetings had the Webex Assistant for Meetings enabled in the Webex Meeting report.
January 2021
View Quality Data for Breakout Sessions
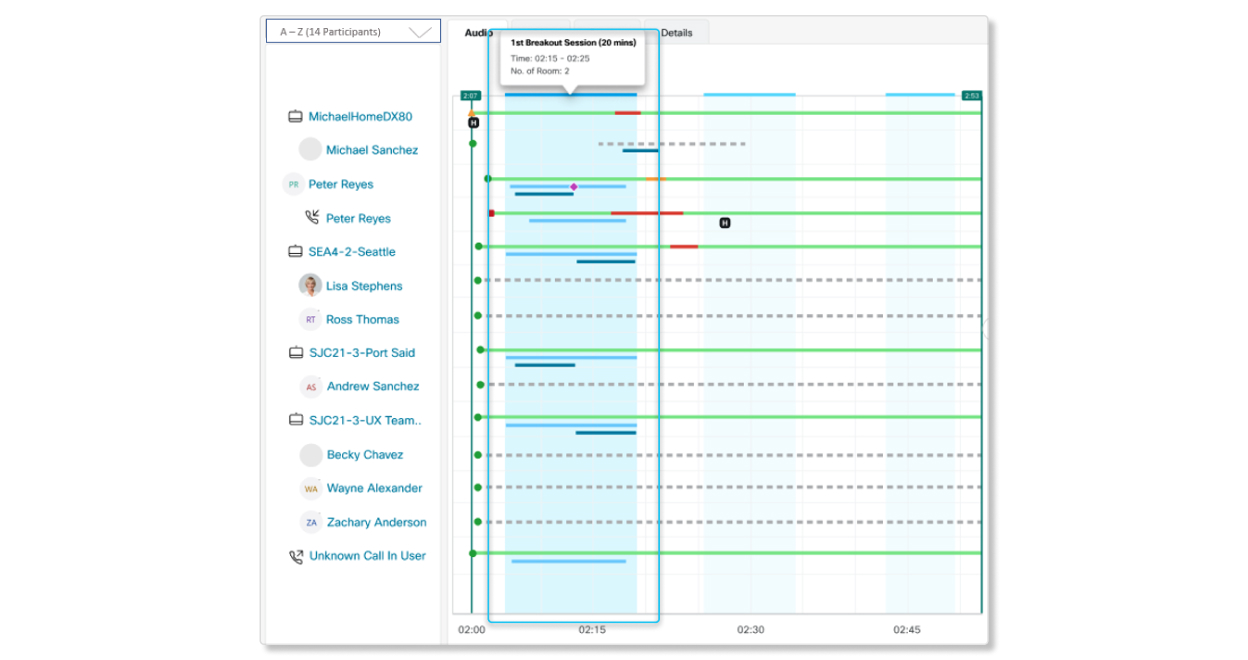
You can now see quality data for breakout sessions within a meeting. The blue line at the top of the timeline represents a breakout session. Click on the blue line to see which participants joined the breakout session and how long they were in there for to help you isolate issues within a specific breakout session.
View Which Participant Paired With a Device
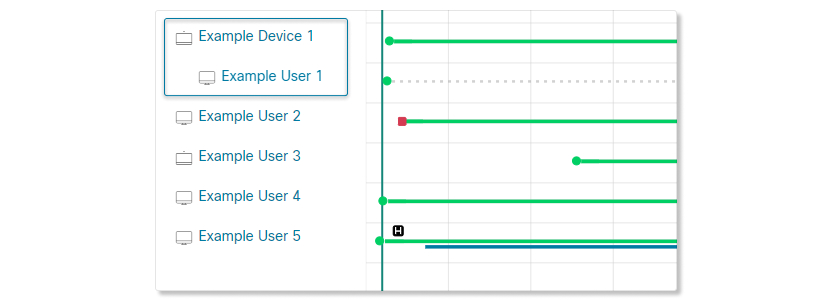
When a participant uses a device or connects through PSTN to join a meeting, the name of the participant now shows up under the device. This helps you see which participants paired with which device, making it easier for you to reach out to the correct participant to assist them.
We're sharing details about our planned releases, but keep in mind that we might need to make changes to release dates and the features themselves. You can subscribe to this article to get updated about any changes.
These features will not yet be available in Webex for Government unless specifically stated. |
March 2024
Retiring the Webex Calling Engagement and Quality reports
The Webex Calling Engagement and Quality reports will be retired on March 31, 2024. You can use the new Webex Calling Media Quality report to get call quality and usage information of call legs.
Analytics
Revamped Meetings Analytics Quality Page
The Meetings Quality page in Analytics was revamped with real-time network quality KPIs and metrics for VoIP, video, and join meeting time (JMT), plus more trending charts with summary statistics. IT admins can view real-time data, identify users with repetitive network quality issues, and cross launch into Troubleshooting to address quality issues.
Check out the Meeings Redesigned Quality infographic to see all the new stuff that's available to you.
You must be on a Webex site version 40.6 or later to view the Meetings Redesign tab. |
Microsoft and Slack Integration Support in Meeting Report
You can now see if a meeting was scheduled through Microsoft Teams or Slack in the Webex Meeting report if your organization has set up those integrations. This column helps you track and quantify integration usage for Webex Meetings.
Reports REST API
You can now create your own reports with our new Analytics Reports Rest APIs. This allows you to have access to pull large-scale data into your own business intelligence system.
For more information, see the Reports API or Report Templates API developer page.
Diagnostics
Meeting Qualities REST API
You can now access up to 14 days of Live Meetings and Post Meetings details data with the new Meeting Qualities REST API. Per minutes quality metrics are also available similar to the data presented in the Troubleshooting tab. This API provides you with a scalable and programmatic access to meetings and participants details, including per minute network quality data in real time.
For more information, see the Meetings Qualities developer page.
Analytics
Webex Future Scheduled Meetings Report
This report shows you the upcoming meetings within the next 90 days for a selected Webex site. Use this report to gain insights into how many users are scheduling meetings and understand the volume and timing of upcoming meetings. This information can help you manage the timing of a site migration or a site upgrade that might impact users. You can also identify critical meetings or events to help plan support accordingly.
Webex High CPU Report
This report shows you if participants had an average system CPU usage of 90% or higher for at least 25% of their video minutes during meetings. A high system CPU usage could cause those participants to have a lower quality meeting. You can use this report to help users on how they can reduce their system CPU usage to have a better meeting experience.
Diagnostics
Monitor All Participants with the VIP Live Meeting Quality Issue Alert
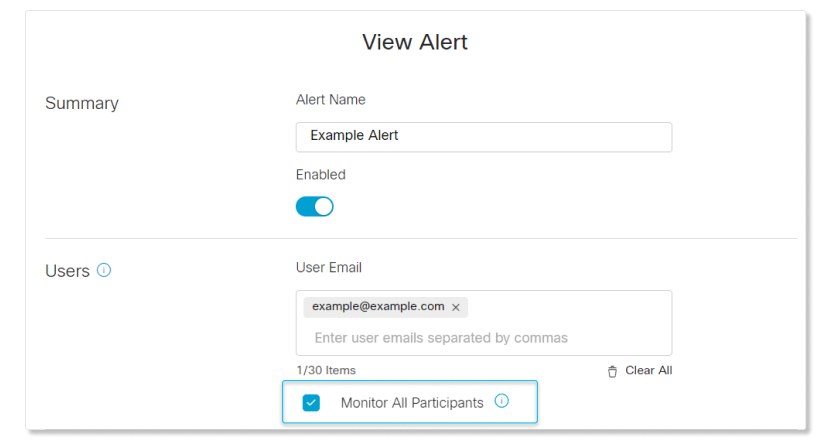
The VIP Live Meeting Quality Issue alert can now monitor all the participants in the same meetings as the users that you created the alert for.
This option is off by default. If you have an existing VIP Live Meeting Quality Issue alert set up already, then this option will be automatically turned on the next time you edit the alert. |
Transport Protocol Change Indicator
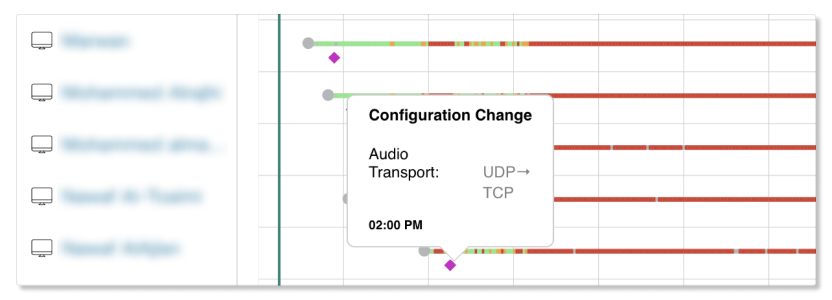
You can now see when a participant changes from UDP to TCP
during a meeting by hovering over the purple diamond  icon in the Meeting Details view and Participants Details view.
A change from UDP to TCP is usually an indication of unstable network connection, which may impact a participant's audio and video quality. You can use this information to help triage audio and video related problems for those participants.
Analytics
Devices Analytics Revamp
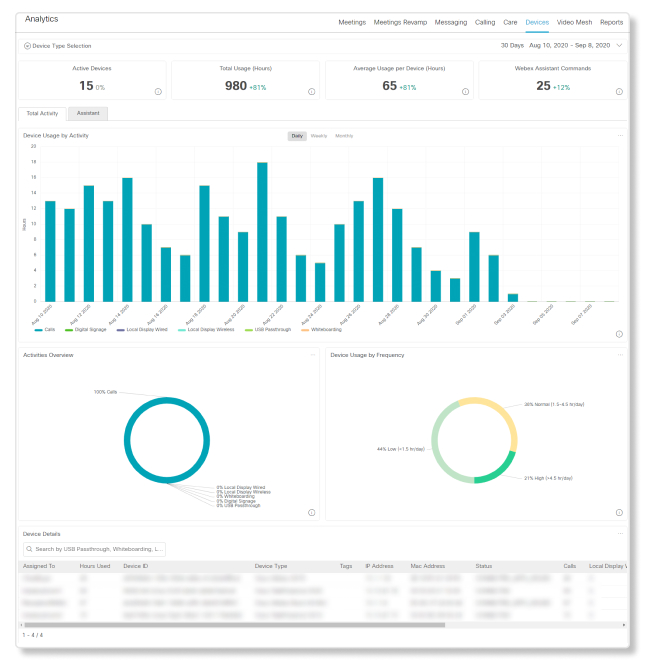
We updated the Devices tab with new key performance indicators (KPIs) and charts to help you monitor how cloud-registered devices are being used in your organization.
Webex Assistant for Devices Data
You can now view usage data for the Webex Assistant for Devices. This data helps you get insights on how users are interacting with the Webex Assistant, and how you can help users engage with it more often.
Diagnostics
Proactive Notifications
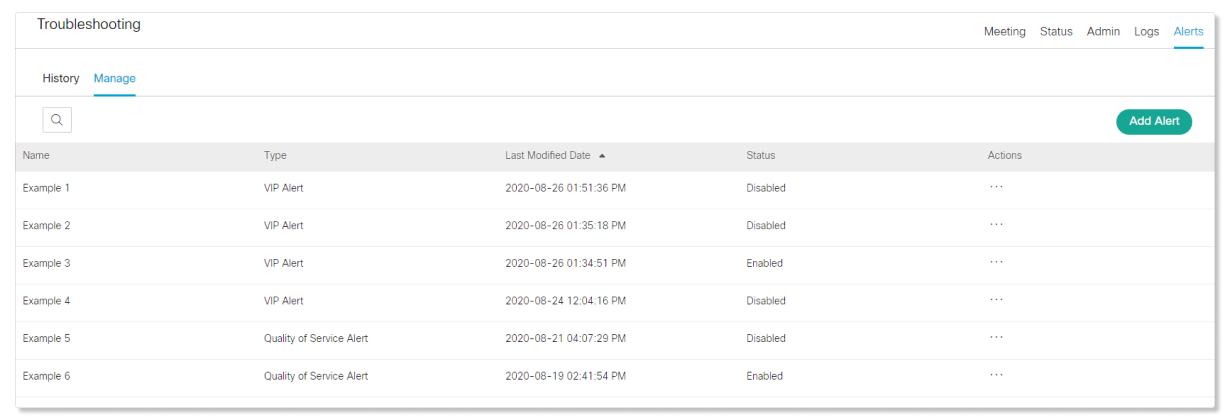
You can now set up alerts to notify you whenever participants reach a specific packet loss, jitter, or latency threshold during Webex meetings. You'll get an email with the meeting details that the participant is in so you can jump in and provide troubleshooting support.
You must be a full administrator, and have a Webex site that's on version 40.4.0 or higher to set up alerts. Alerts only trigger for participants who attend meetings through the Webex Meetings and Webex Teams app. The minimum app versions that participants must use are:
|
View Live Meetings
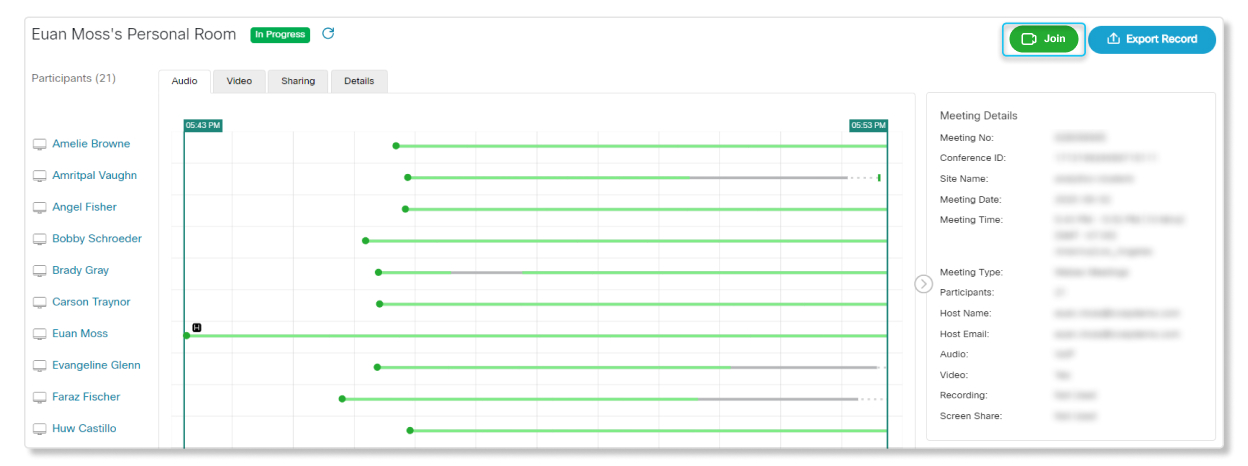
You can now see a list of all the meetings that are in progress for a Webex site. This list allows you to proactively monitor and troubleshoot meetings that may have issues.
You must be a full administrator, read-only administrator, or support administrator with the Advanced Troubleshooting Access role to view live meetings. |

Join In Progress Meetings
You can now join meetings that are in progress with just the click of a button in the Meeting View of Troubleshooting. This feature lets you quickly help out participants who are having trouble during a meeting.
You must be a full administrator with the Advanced Troubleshooting Access role to join in progress meetings. |
Analytics
Meetings Usage Summary Report
This report shows you the details of all the meetings held in your organization for each day. At a quick glance, you can find out the total number of meetings and participants, and the total number of VoIP, PSTN, and video participant minutes for a specific date.
Teams Client Version Report
Want to find out who’s not clicking that update button? The Teams Client Version report shows you which Webex Teams client version users are on. Users on older versions don't have all the up-to-date features and fixes, so you can help them with their problems by finding out if it’s because of the version they're on.
Teams Summary - Bot Activity Report and Teams Summary - User Activity Report
Similar to the Teams Bots Activity report and Teams User Activity report, these reports show you a summarized view of the data for the selected date range instead of the data for each day. Use this report if you want to get a high level view of how effective bots are, and how users are adopting Webex Teams.
True Forward Active User Report and True Forward Enterprise Agreement Report
These two True Forward reports show you your subscription information for your product, and how many licenses you've allocated to users. If you went over your provisioned license quantitiy, you can track the consumption quantitiy in the report to give you an idea on how your subscription will change.
These reports are only available to customers that have an active true forward eligible subscription. |
Webex Meeting Audio Usage Report
This report shows you the details of the different audio types used by participants during meetings within a selected date range. You can use this report to get insights on which audio type is the most used in your organization.
Reports Available for Standard License
Customers with a standard license for Control Hub now have access to three months of data for:
-
Webex Meeting Usage Summary Report
-
Webex Active_Hosts Report
-
Webex Inactive Users Report
-
True Forward - Active User Rolling Average Report
-
True Forward - Enterprise Agreement Report
Diagnostics
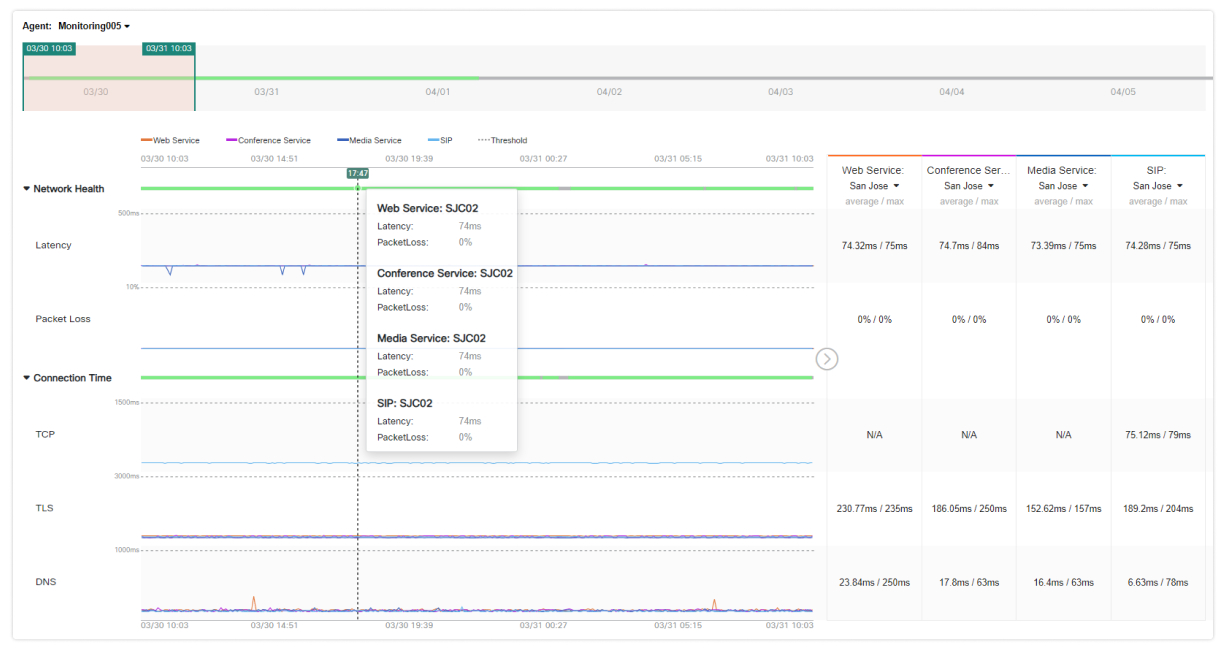
Webex Monitoring Service
The Webex Monitoring Service is now available in Control Hub. You can use this service to collect baseline data on your organization's network when using Webex services. This data can help you troubleshot meetings by seeing if problems are coming from your organization's network or from Webex data centers.
For more information, see how to set up the Webex Monitoring Service and how to view the Webex Monitoring Service data.
Mute Indicator
Ever had a moment in a meeting where you were talking, but didn't realize you were muted? We've all been there, which is why we added a mute indicator. This indicator helps you determine if participants had audio quality issues, or just forgot to click that mute button.
The mute indicator only shows for participants who mute themselves through the Webex Meetings desktop and mobile app, the Webex Teams desktop and mobile app, and cloud-registered room devices. If a participant was muted through an external hardware, like a microphone, then the mute indicator doesn't show. |

Meeting End Indicator
We added an indicator that lets you know when a participant left a meeting on purpose or unexpectedly. When monitoring meetings, you can use this information to help troubleshoot problems if you notice that lots of participants are dropping from meetings unexpectedly.
The meeting end indicator only shows for participants who use VoIP to join meetings with the Webex Meetings app, the Webex Teams app, or a video system. |

Memory Usage for Participants
You can now see the system and Webex app memory usage for participants in the Participant View. This information can help you figure out if participants are having trouble with their meetings due to their network connection or high memory usage.

Analytics
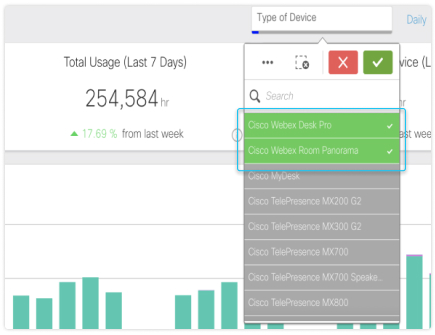
Cisco Webex Desk Pro and Cisco Webex Room Panorama Support
We now bring the power of analytics to two new devices, the Cisco Webex Desk Pro and Cisco Webex Room Panorama. You can use data from these new devices to see how they're being used across your organization and help drive adoption.
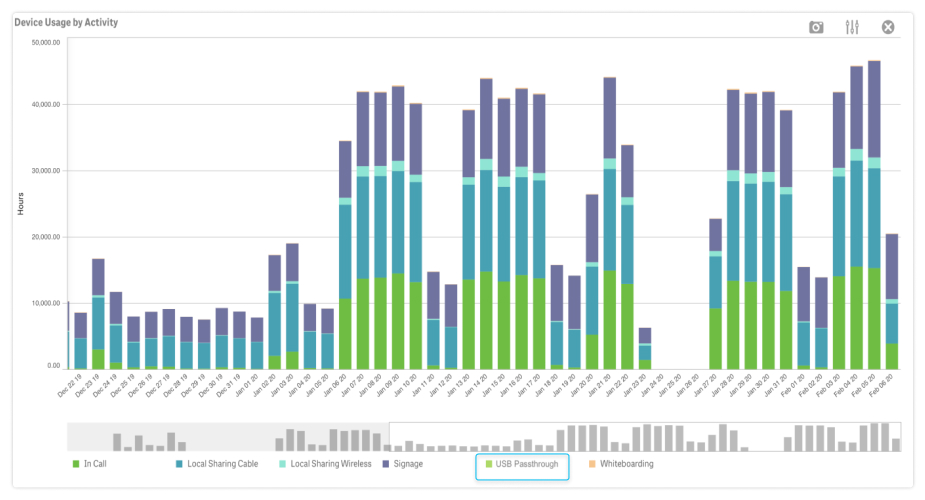
USB Passthrough Mode Data Support
The Cisco Webex Room Kit Mini has a mode called USB Passthrough, which lets anyone join a meeting with the device by connecting its USB cable to a computer. You can now see data for when the USB Passthrough mode is used to get a better understanding of how often the mode is used in your organization.
Active Devices Key Performance Indicator (KPI) for Devices Analytics
We've replaced the Online Devices KPI on top of the Devices Analytics page with the Active Devices KPI. Don't worry, you can still find out how many online devices there are in the Devices tab. Instead of showing you how many devices were just online, the Active Devices KPI provides a better insight by showing you how many devices were actually used in meetings based on the previous day, with a trending comparison from the past week. You can use this information to see how often devices are being used and see how you can increase adoption for your organization.

Tracking Codes in Webex Meeting Report
Tracking codes are now included in the Webex Meeting report in Analytics. Tracking codes help you analyze usage by different groups within an organization—for example, by department or division. Now that you can track these tracking codes in the report, you can use the data to help with adoption insights for cost accounting or other internal billing processes across different groups.

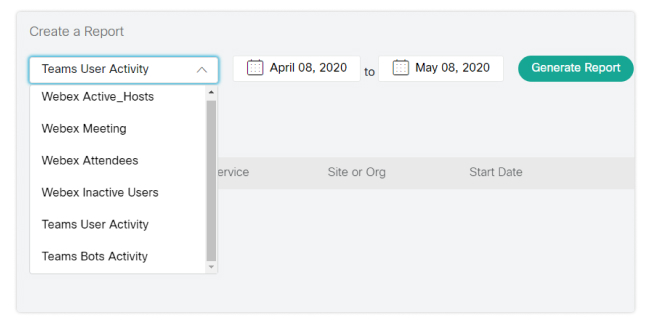
Teams Bots Activity Report
Bots in Webex Teams can improve productivity and help reduce costs, but how can you tell if they really do that? With the new Teams Bots Activity report, you can get metrics for these useful automated helpers, such as how many spaces a bot joined, how many messages a bot sent, how many files a bot shared, and more. These metrics help you see how effective bots are, or if they just want to be your friends.
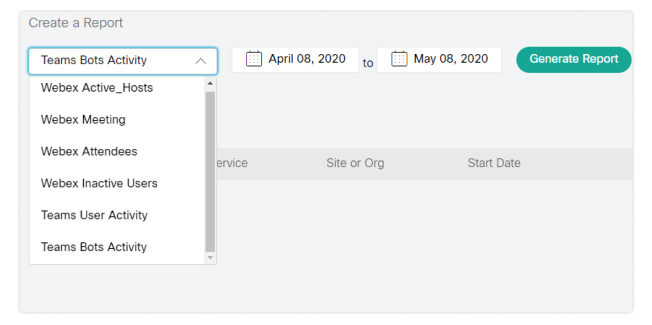
Teams User Activity Report
Want to find out how people are using Webex Teams? Then check out the Teams User Activity report, which shows you how many spaces they're a part of, the number of files they shared, how many spaces they created, and more. These metrics help you analyze user activity patterns across your organization.
Diagnostics
3rd Party Session Initiation Protocol (SIP) Devices Support
Data from all devices should be equal, which is why Diagnostics now supports data from 3rd party SIP devices. You can get insights about how these devices are used to join a meeting and additional quality of service data that are updated within the meeting every minute.
Search Meetings with Names of Cloud-Registered Devices
Do you have devices that are registered up in the Webex clouds? If you do, then you can now search for any cloud-registered device by name in Diagnostics. This lets you see how often a device is being used and the quality data it experiences across multiple meetings.

Analytics
Cisco Jabber Analytics Data
Analytics data is now available for Jabber if your organization has:
-
On-premises Jabber with full Unified Communications.
-
On-premises Jabber with Instant Messaging-only.
-
On-premises Jabber with Phone-only.
-
Jabber with Webex Messenger.
You must also complete the configurations below so Jabber data is sent to Control Hub. The date for Jabber data in Control Hub starts once these configurations are complete. Jabber data doesn’t backfill.
-
TelemetryEnabledto true. -
TelemetryEnabledOverCellularDatato true. -
TelemetryCustomerIDwith the organization ID that you can find in Control Hub.
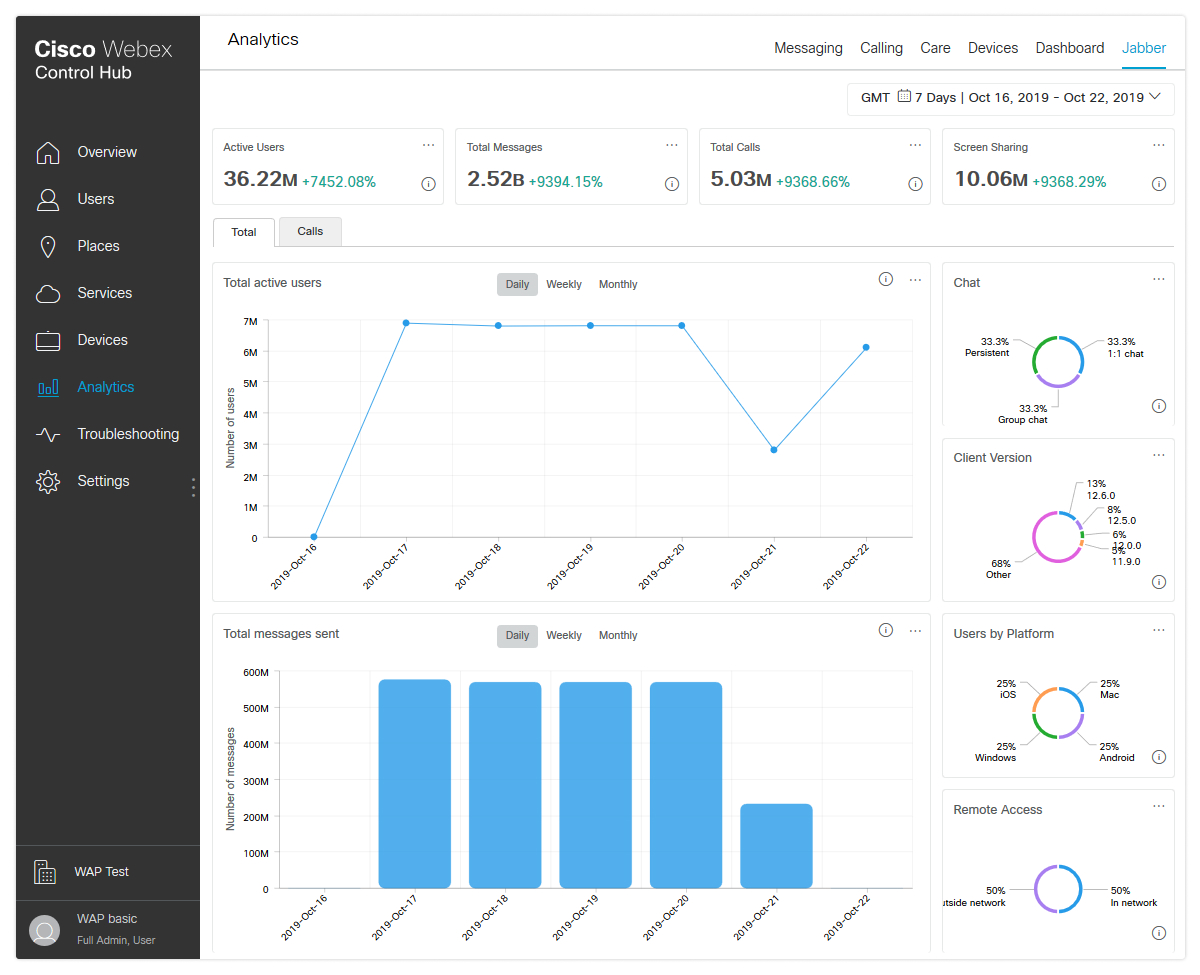
The Key Performance Indicators (KPIs) that show at the top of the Jabber Analytics page to help you better understand Jabber adoption in your organization are:
-
Active Users.
-
Total Messages Sent.
-
Total Calls.
-
Screen Sharing.
Each of these KPIs show a trending percentage from the previous time period.

There are charts that show you a daily, weekly or monthly trend for total active users, total messages sent, total call minutes, and number of active users that made a call. You can also view a breakdown of:
-
Jabber client versions used.
-
Operating systems.
-
Chat types used.
-
Video call screen resolutions.
-
Audio or video calls made.
-
Connections made in or outside the organization's network.
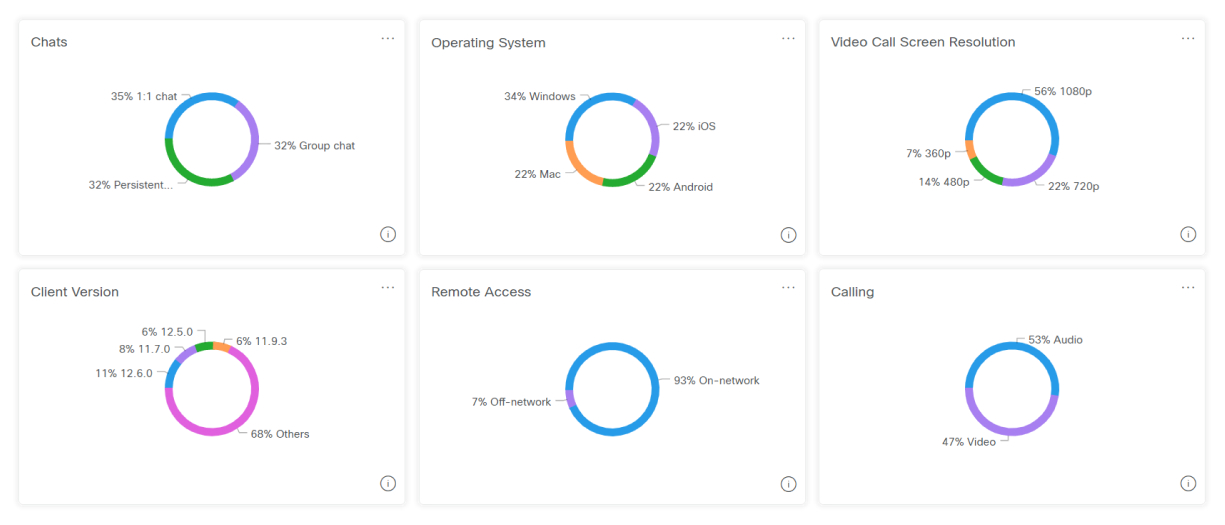
This data helps you see how often Jabber is being used and helps you create reports.
Calendar Date Selector for Messaging and Devices
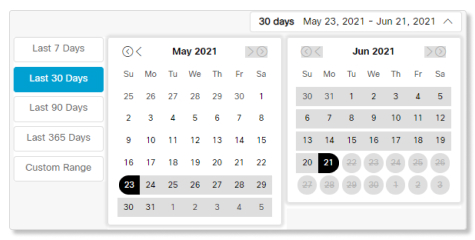
You can now use a calendar date selector to view data within a specific time frame for Messaging and Devices Analytics. The amount of data you have access to depends on the type of customer you are. If you're a standard customer, you have access to 3 months of data. If you're a Pro Pack customer, you have access to 13 months of data.
The KPIs in the Messaging and Devices tabs are fixed and don't change when you select a specific time frame. All other charts below the KPIs update based on the date you select. |
Webex Edge for Devices Support
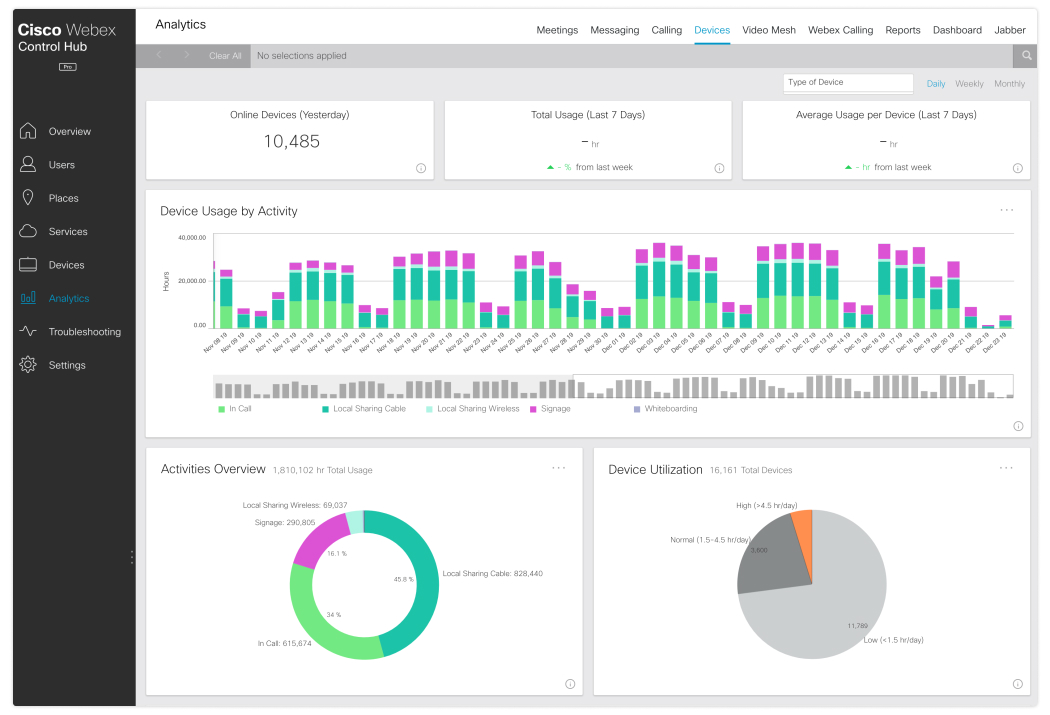
You can now see data for on-premises devices on release ID: RoomOS 2019-12-16 285a7f8edd1 or higher that linked to Webex Edge for Devices. Devices Analytics shows you a breakdown of how many devices have been used for calls, whiteboarding, and digital signage.
For more information about linking on-premises devices to the Webex cloud, see the Webex Edge for Devices White Paper.
Webex Meetings Inactive Users Report
You can now generate Webex Meetings Inactive Users Reports in Analytics. This report shows you a list of users who haven't hosted or attended Webex Meetings for a specific time period. You can use this report to help you see why those users haven't been using Webex Meetings, and what you can do to help them use it more.

Diagnostics
Thin Clients and Mobile Devices Support
You can now see rich troubleshooting data for users who join Webex meetings through thin clients or mobile devices.
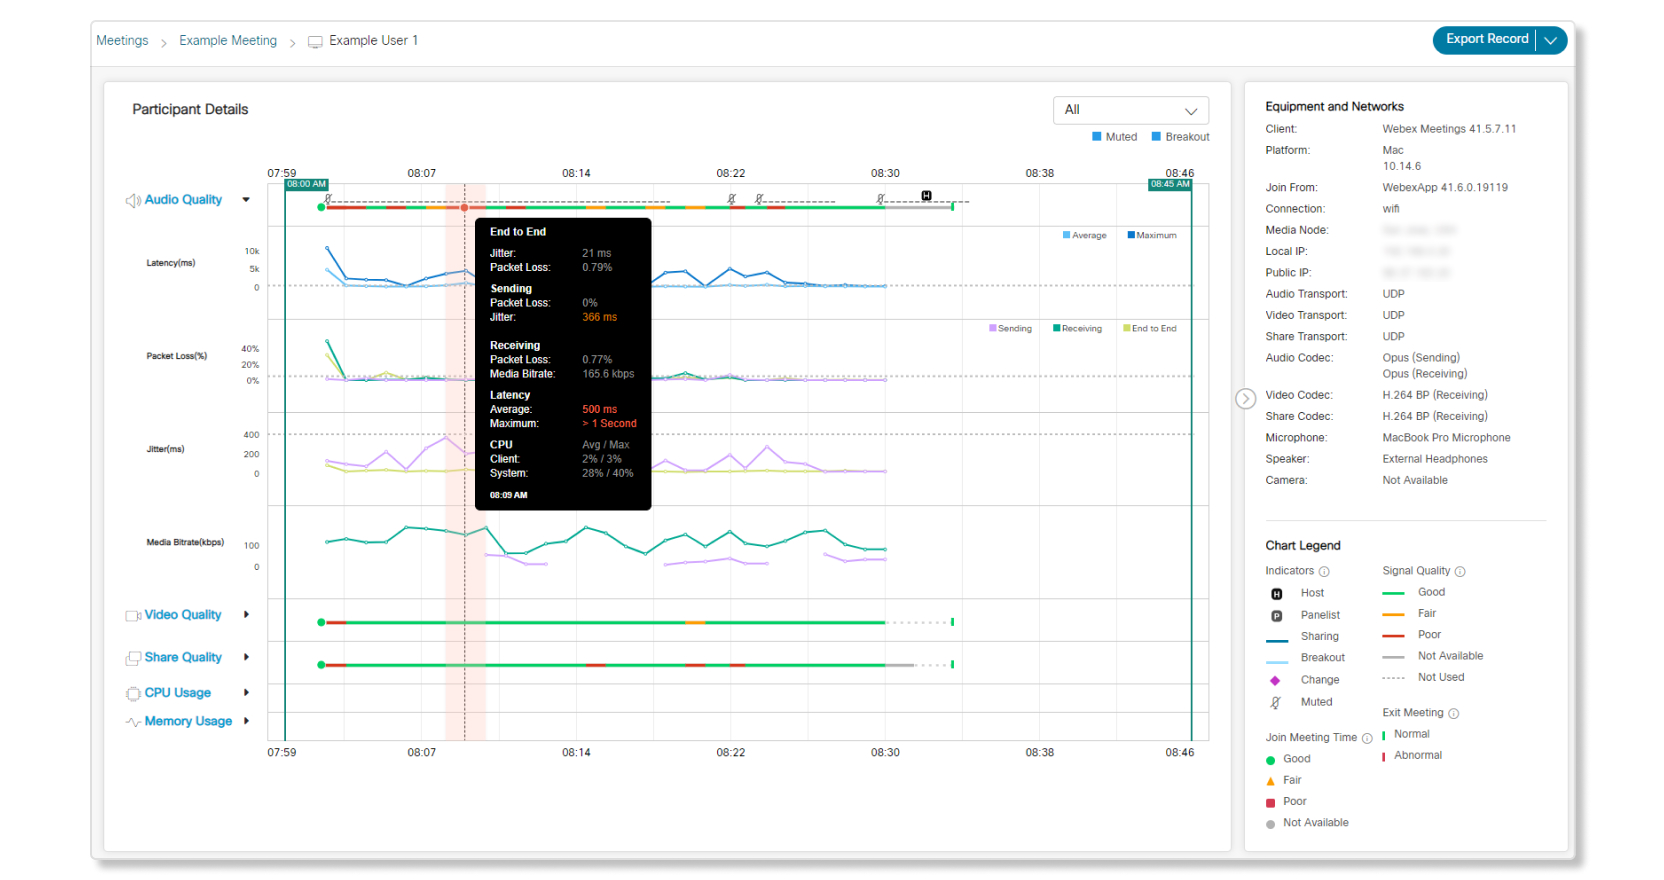
These are the minimum Webex Meetings versions required in order to see troubleshooting data from users who join through thin clients and mobile devices. If the devices don't meet these requirements, then only packet loss and latency data are available.
|
Device |
Minimum Webex Meetings Version |
|---|---|
|
Mobile Devices |
39.11 |
|
Thin Clients |
40.1 |

