- Home
- /
- Article

 In this article
Integrate Cisco Meraki with Troubleshooting so you can see full path visibility of users across the Meraki platform to isolate issues with greater clarity.
Overview
You can only see Meraki data for meetings that are hosted in your organization. If users join external meetings, then Meraki troubleshooting data for those external meetings won't be shown. Meraki data is kept up to a maximum of seven days in Troubleshooting.
Data is shown in five-minute intervals. The thresholds for good and poor data are:
- Good (green)—SNR >= 20db or RSSI >= -80dBm or Average wireless latency <= 200ms
- Poor (red)—SNR < 20db or RSSI < -80dBm or Average wireless latency > 200ms
Limitations
Meraki troubleshooting data is only available:
- Up to a maximum of seven days. When viewing troubleshooting data for meetings beyond the previous seven days, the Meraki data line will be greyed out.
- For the desktop version of Webex App and Cisco Room series devices. The mobile version of Webex App isn't supported.
- For devices that are online. The Meraki data line won't show for devices that are offline.
Install and activate Meraki
Before you begin
To view Meraki network path data in Troubleshooting, you must complete the following prerequisites:
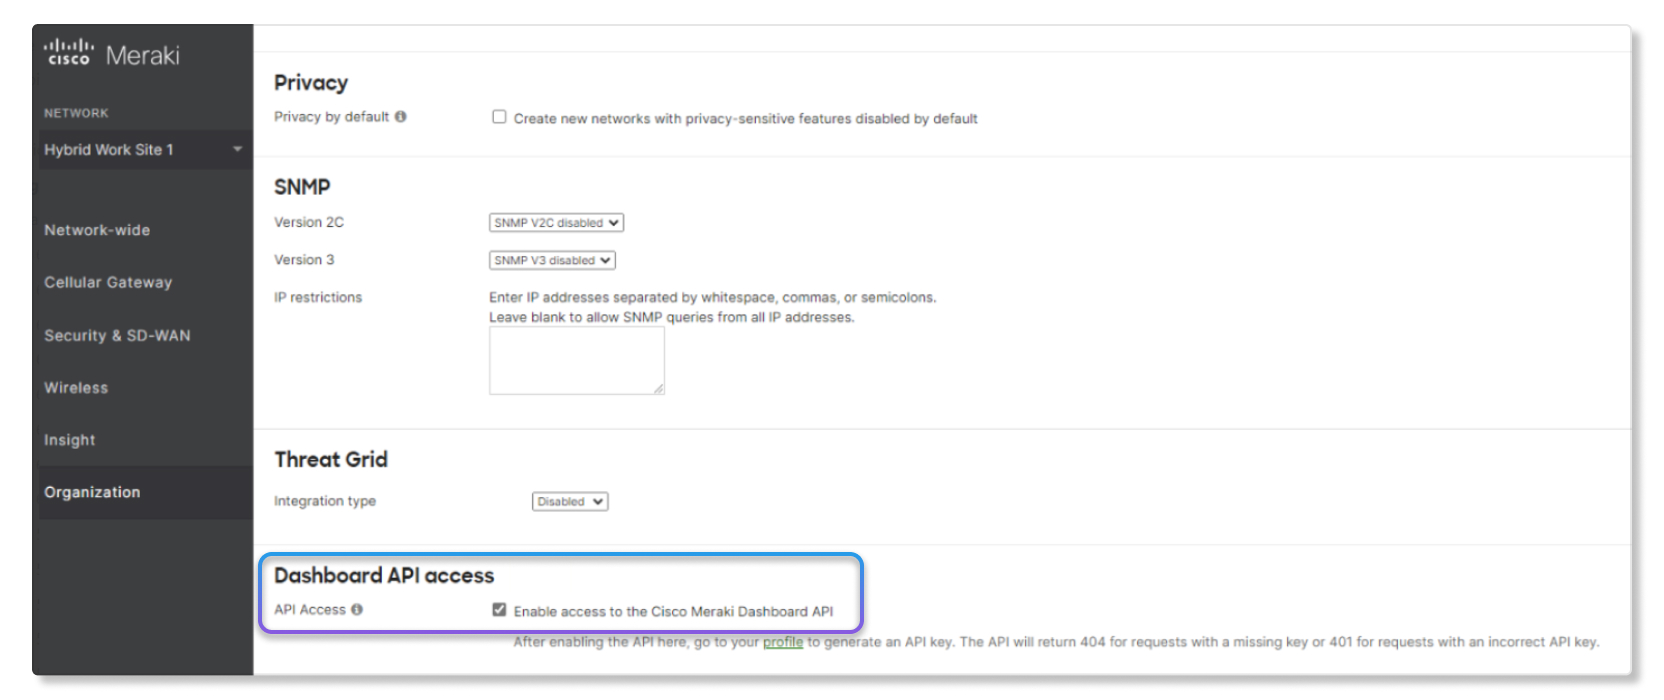
- Create an API key in the Meraki dashboard to use in Control Hub. To create an API
key:
- In the Meraki dashboard, go to Organization >
Dashboard API access, check the Enable access to
the Cisco Meraki Dashboard API check box, then click Save
Changes.
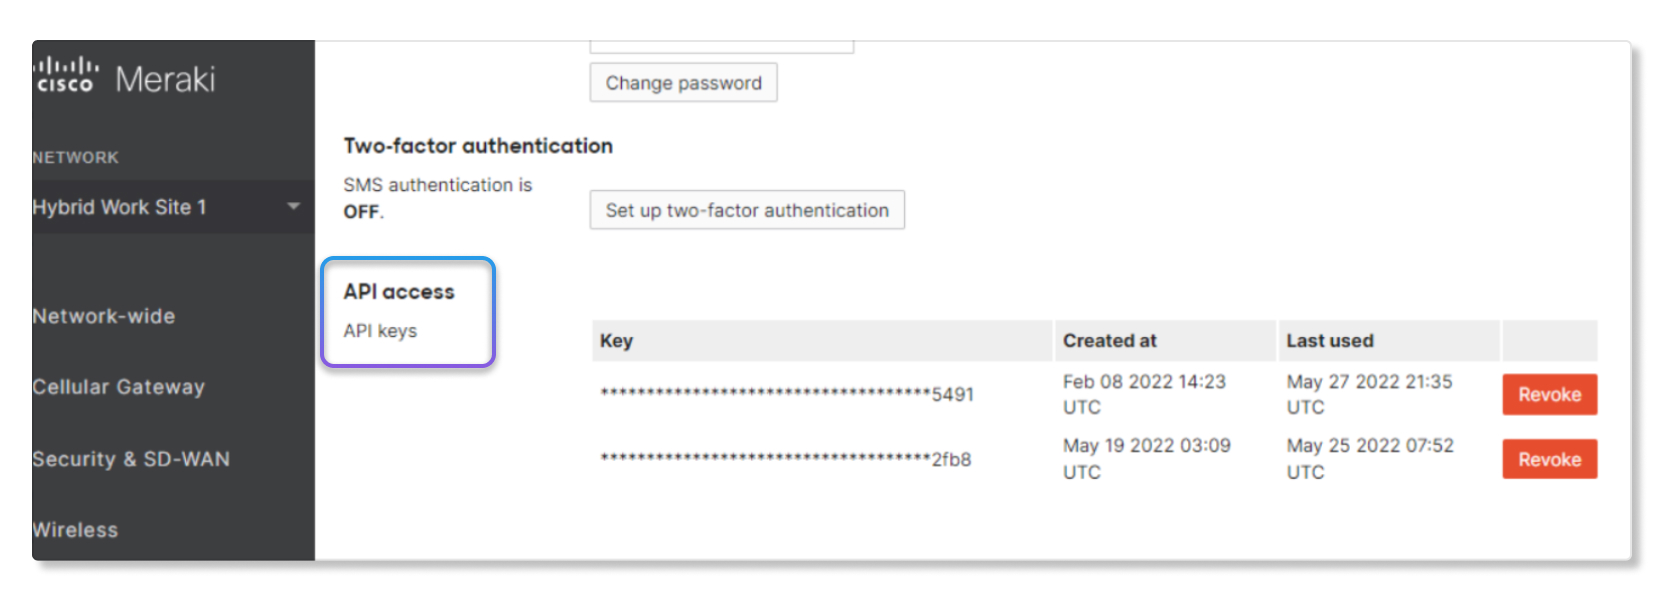
- Go to My Profile > API access and
create an API key. Once you've created an API key, you can go to Control Hub and
complete the setup.
- In the Meraki dashboard, go to Organization >
Dashboard API access, check the Enable access to
the Cisco Meraki Dashboard API check box, then click Save
Changes.
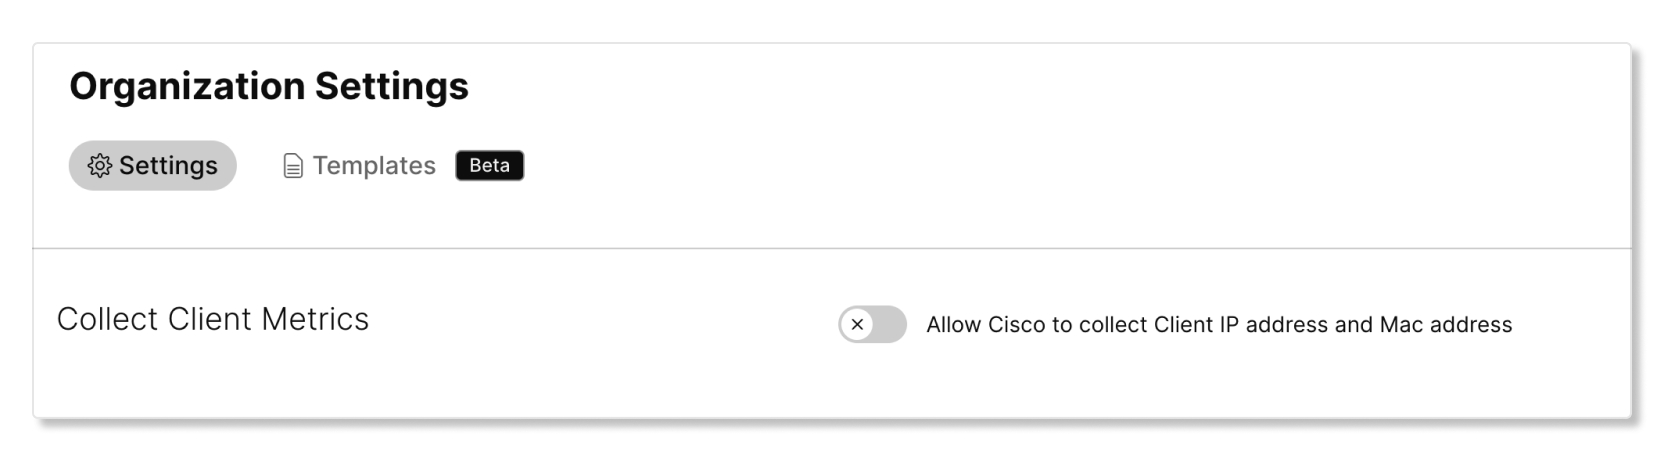
- Allow Cisco to collect Client IP address and MAC address. To allow Cisco to collect
these addresses:
-
In Control Hub, go to and toggle Allow Cisco to collect IP address and Mac address to on.

If your organization or a specific meeting site isn't using Webex Suite meeting platform, then reach out to your Customer Success Manager (CSM) and ask to enableEnableSendClientKeyInfofor that meeting site. Here's how to check if your meeting site is using Webex Suite meeting platform.
-
| 1 |
Sign in to Control Hub and go to . |
| 2 |
Toggle the Allow Meraki API access switch to on. 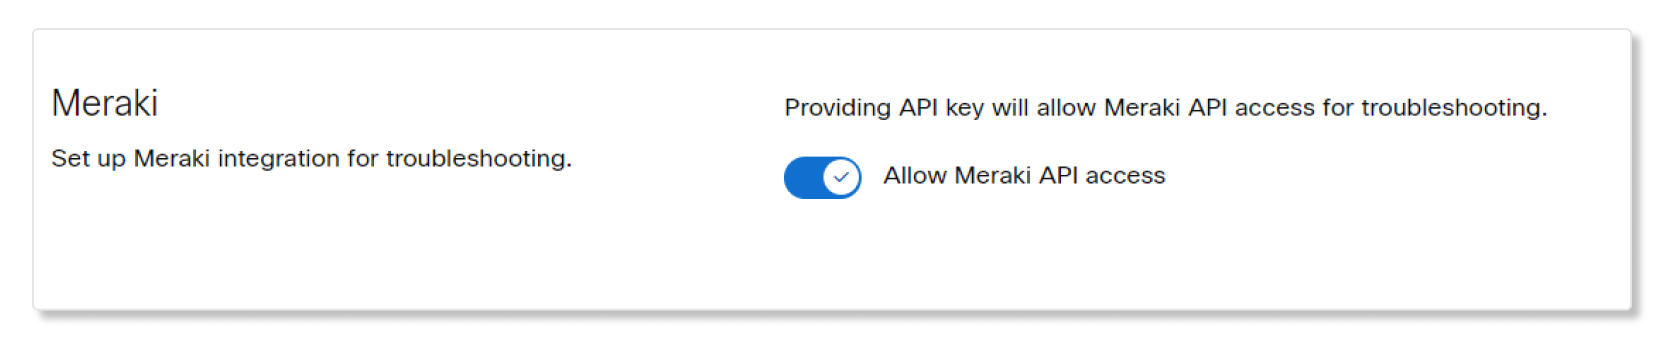
|
| 3 |
Enter the API key that you created in the Meraki dashboard. |
| 4 |
Click Activate. 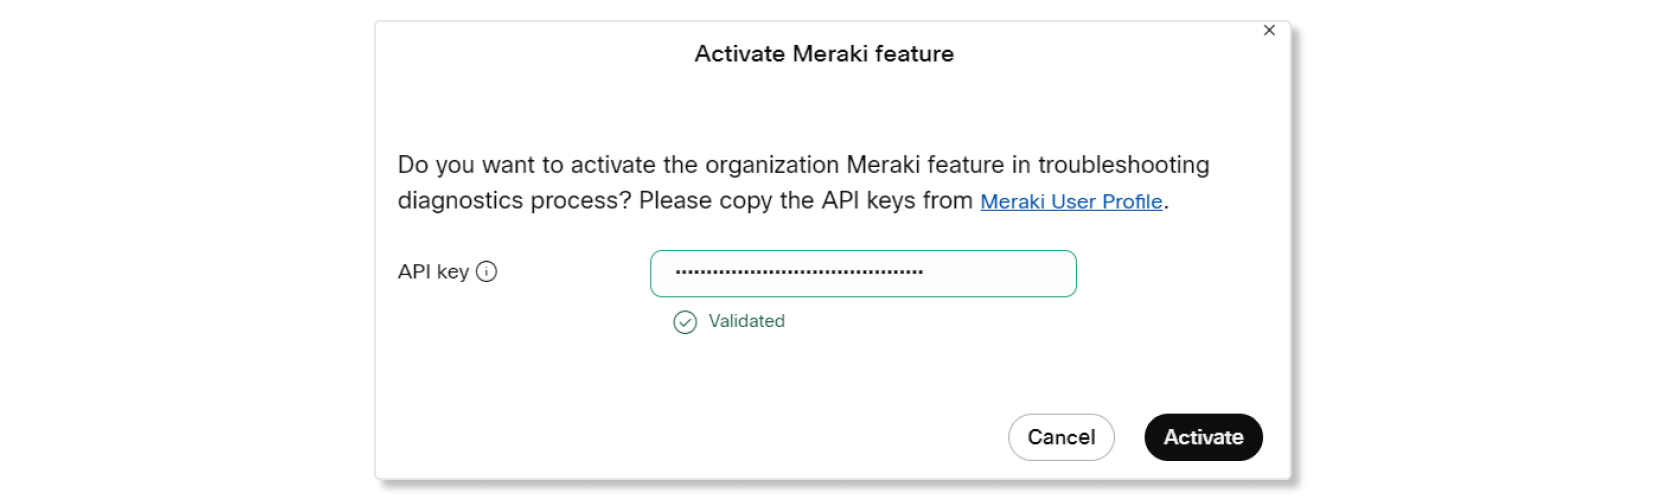
|
Meraki data troubleshooting charts
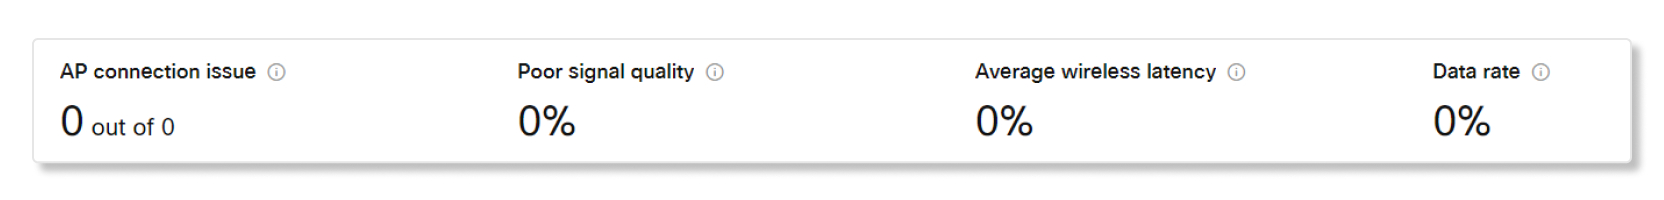
Key performance indicators (KPIs)
- AP connection issue—Number of failed connections to a Meraki access point (AP) during a meeting.
- Poor signal quality—Percentage of poor signal quality during a meeting. Signal quality is counted as poor if signal-to-noise ratio (SNR) is < 20db or received signal strength indicator (RSSI) is < 80dBm.
- Average wireless latency—Average percentage of poor wireless latency during a meeting.
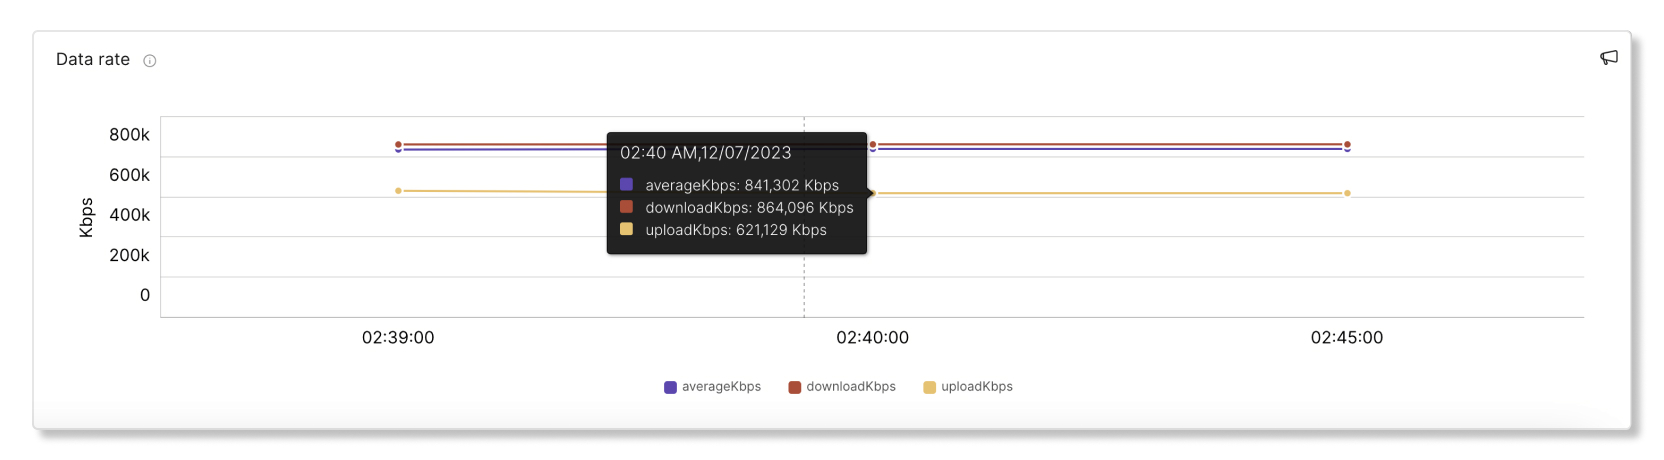
- Data rate—Percentage of poor data rate during a meeting.
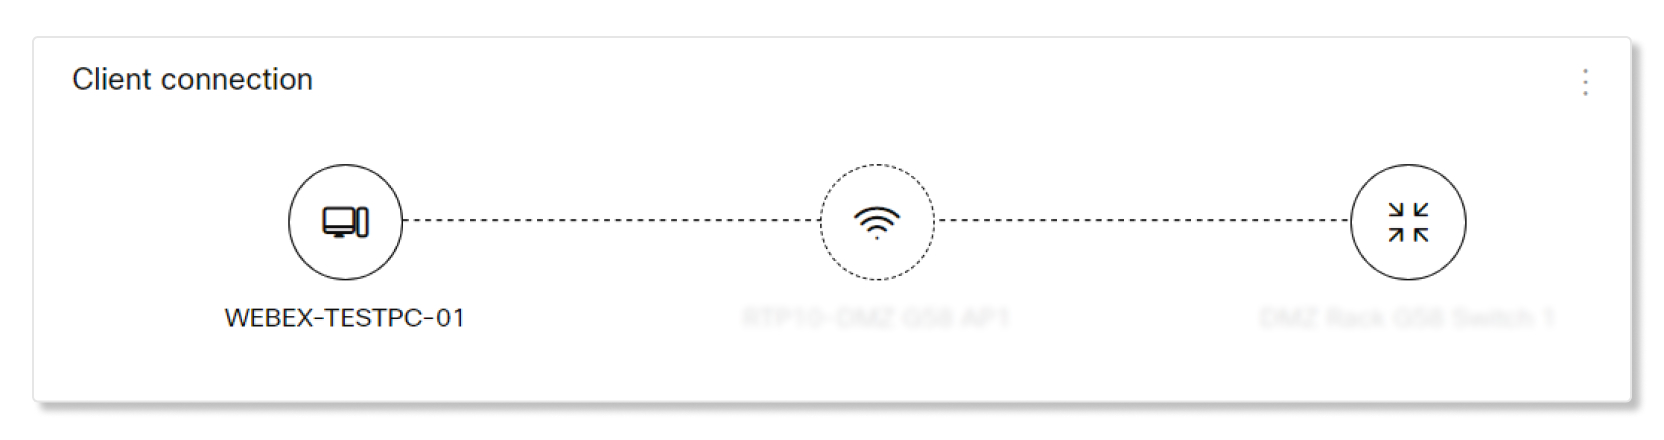
Client connection
This chart shows details about the connection between the client, AP, and switch.
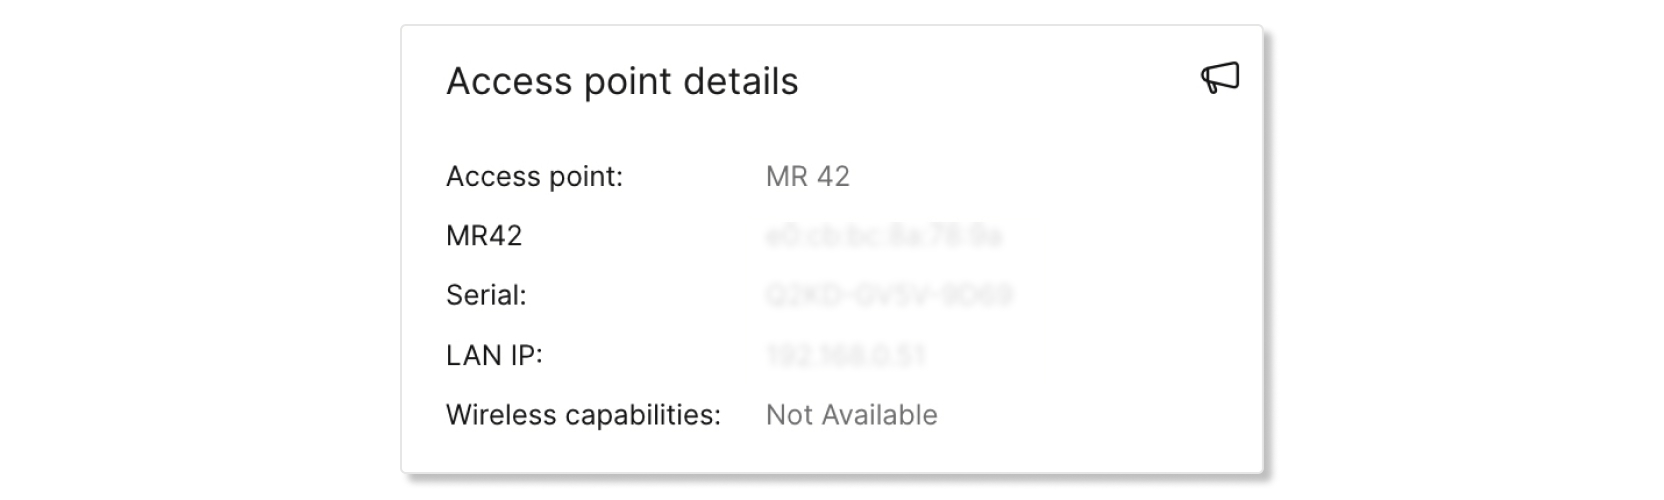
Access point details
This table provides information about the access point that a client connected to. Available details are:
- Access Point—Name of the AP.
- AP Model—Key and mac address of the AP.
- Serial—Serial number of the AP.
- LAN IP—LAN IP associated with the AP.
- Wireless capabilities—Type of wireless connections that the AP supports.
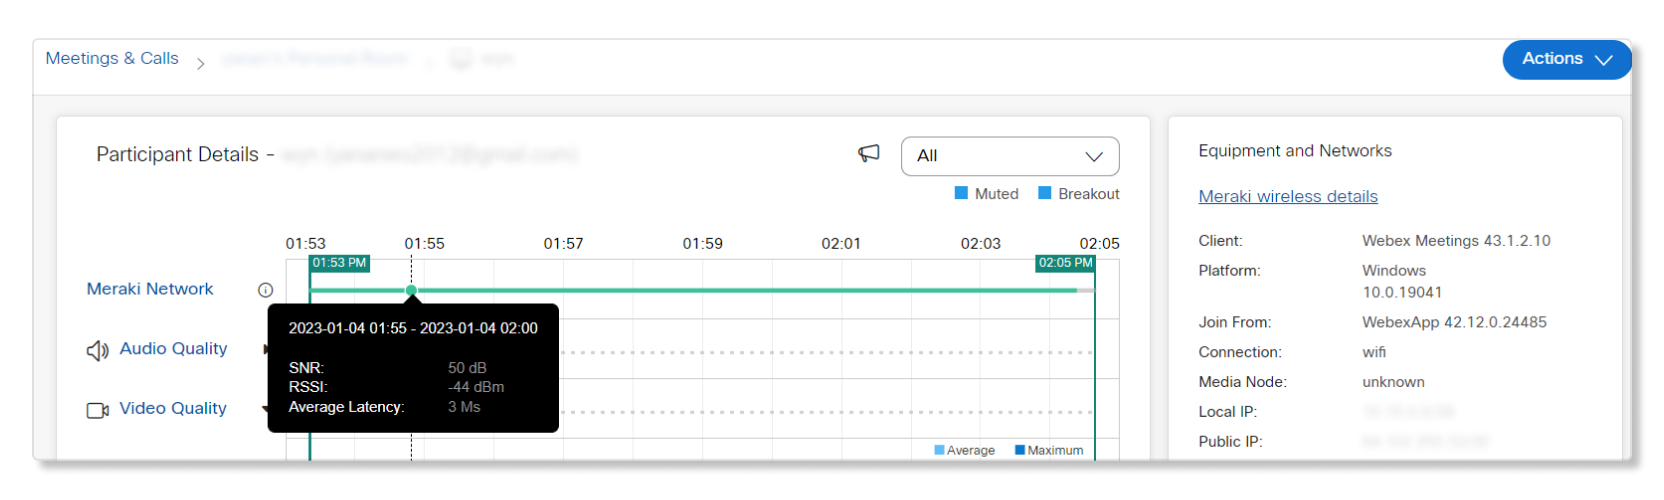
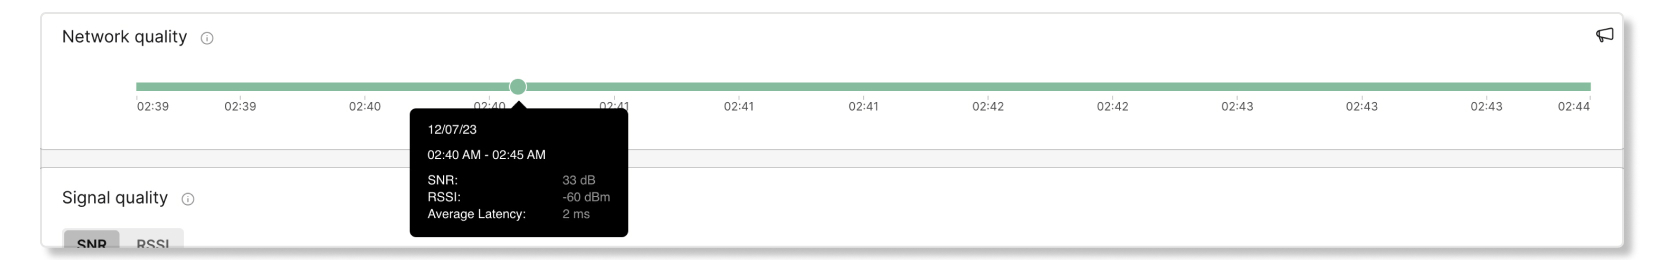
Network quality
This graph shows the signal quality and wireless latency of the client on the Meraki network in five-minute intervals. You can hover over a spot in the line to see more details about the quality.
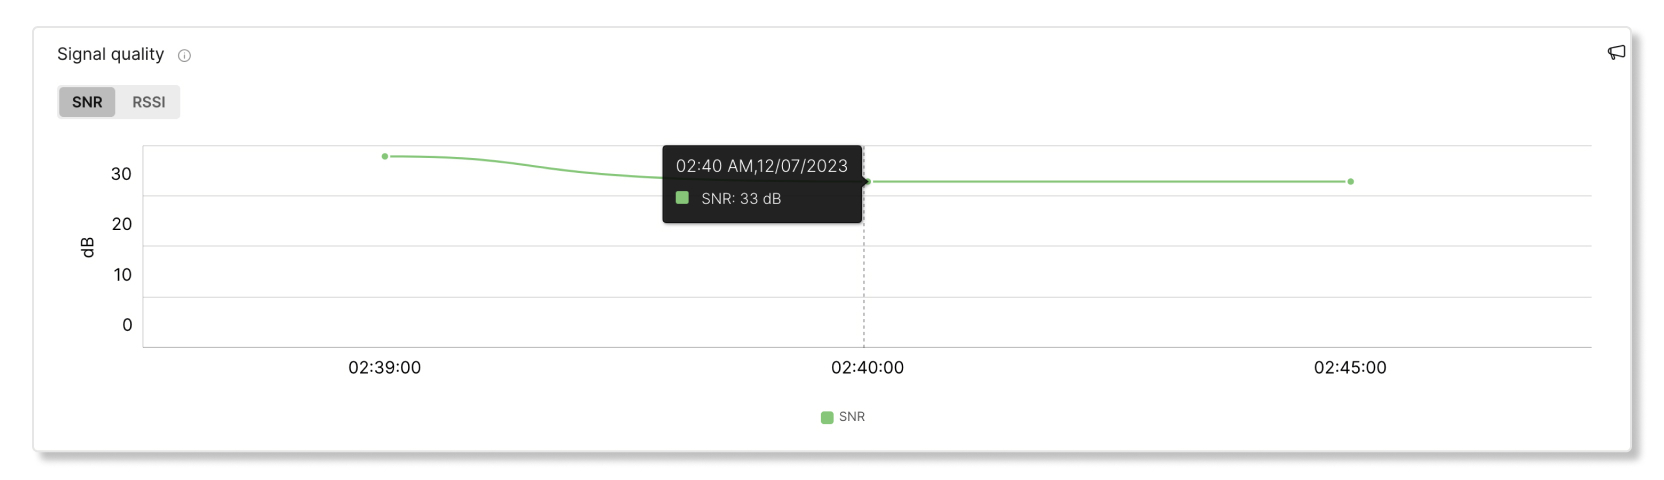
Signal quality
This graph shows the average SNR and RSSI for clients connected to the AP in five-minute intervals. If signal quality is poor, performance will likely be worse (i.e. more latency and slower data rates). The cause of poor signal strength can come from changes in the physical environment, RF configuration, or a far distance from the AP.
This graph only captures
wireless network data. |
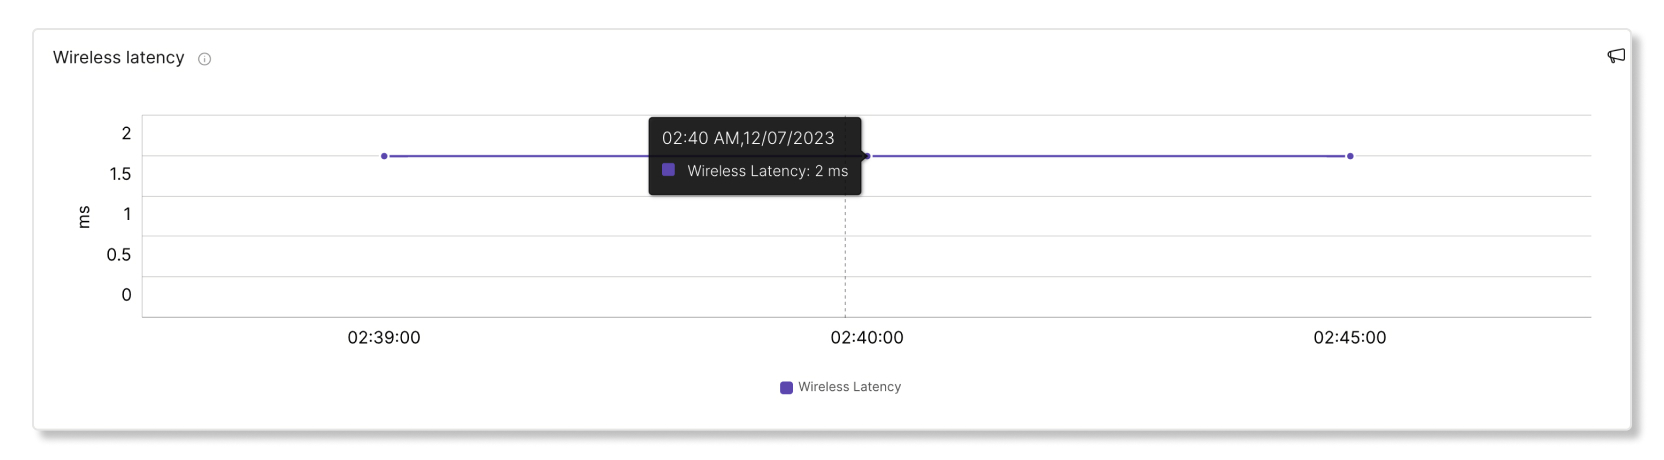
Wireless latency
This graph shows the wireless latency of the client in five-minute intervals. A connection with high latency can cause slowness during meetings. The cause of high latency can come from poor signal quality, interference, or high load on the AP.
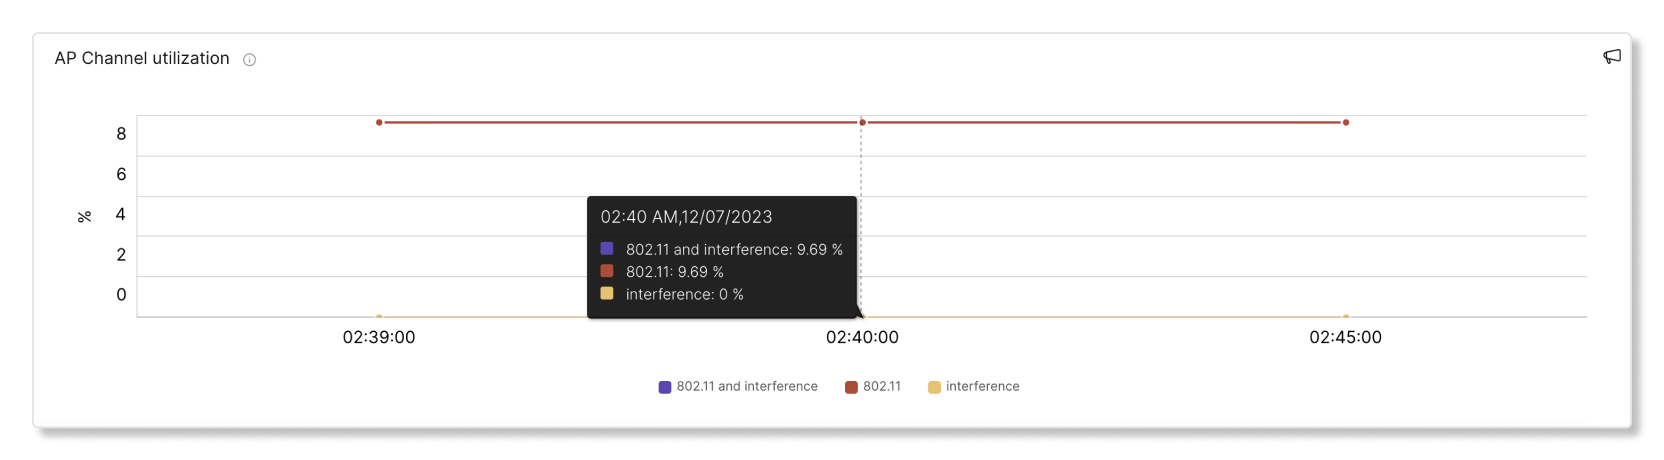
AP Channel utilization
This graph shows the percentage of channels that were utilized by clients in ten-minute intervals. A high percentage of channel utilizations can cause higher than average latency. High channel utilization can also come from interference created by things like microwaves, bluetooth, and interference from neighboring APs.
This graph only
captures wireless network data. |
AP # of clients
This graph shows how many clients were connected to a specific access point (AP) in five-minute intervals. If an AP has a high number of clients connected to it, it can contribute to higher than average latency.

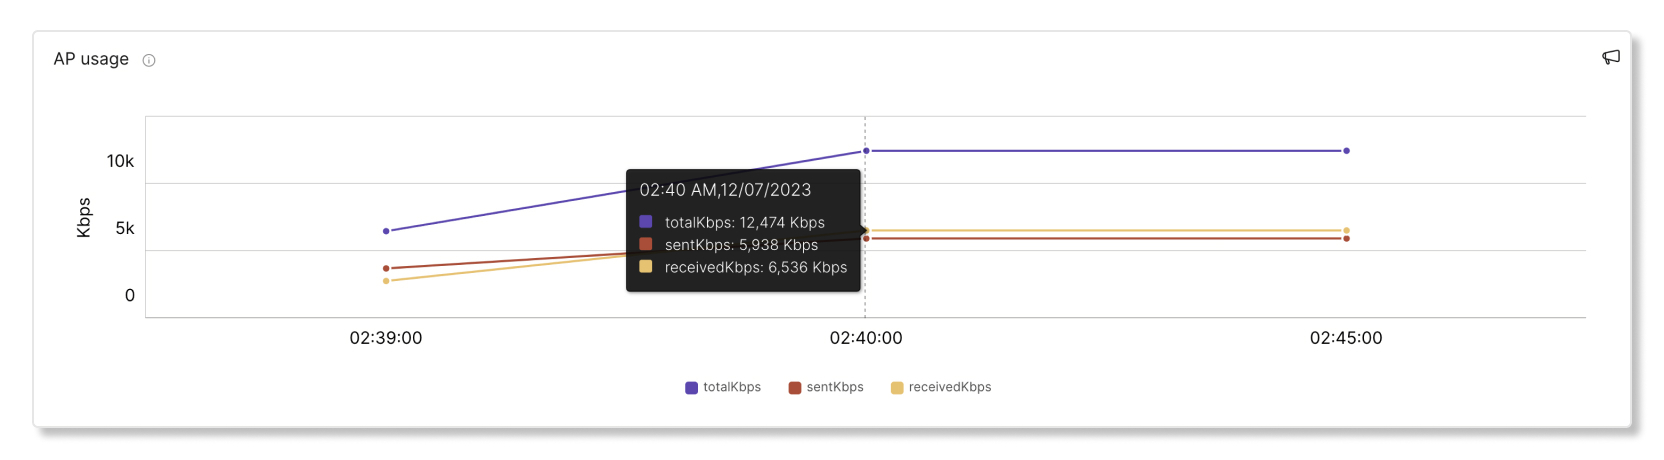
AP usage
This graph shows how many clients connected to a specific AP in five-minute intervals. If an AP has a high number of clients connected to it, it can contribute to higher than average latency.
This graph only captures wireless network data. |
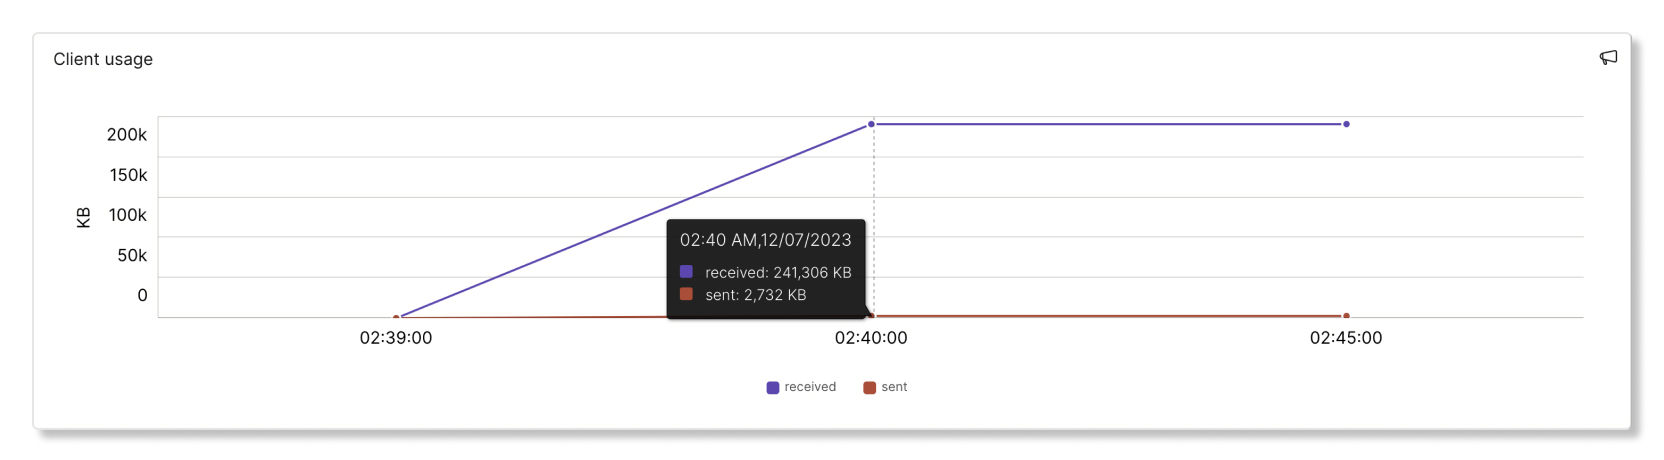
Client usage
This graph shows the received and sent data from a client in five-minute intervals.
Data Rate
This graph shows data rates used as a percentage of the maximum data rate that this client supports. A connection with low data rates will feel consistently sluggish. Poor data rates can occur due to poor signal quality, or client device or AP capability limitations.
This graph
only captures wireless network data. |