- Home
- /
- Article

Thanks for your feedback.

Integrate ThousandEyes with Troubleshooting in Control Hub
 In this article
 Feedback?
Integrate ThousandEyes with Troubleshooting so you can see full path visibility of users across the network to isolate issues with greater clarity.
Overview
Required Webex version to view ThousandEyes data
Control Hub Troubleshooting integration with ThousandEyes endpoint automated session testing (AST) requires the Webex App desktop version 42.7 and later.
ThousandEyes AST supports both the desktop version of Webex Meetings app and Webex App. However, the integration for Troubleshooting only shows the network path for users who join through the desktop version of Webex App.
ThousandEyes for Webex Meetings
ThousandEyes has Webex-specific Cloud Agents deployed at the front door of several Webex data centers responsible for serving customer traffic. These agents are available for general use by all ThousandEyes customers and are a tool to better monitor and troubleshoot your Webex performance. For more information about the key value of these agents, see the Webex Monitoring solution page.
See this article for best practices on how to set up tests with Webex Cloud Agents for Webex Meetings.
ThousandEyes for Webex Calling
Webex Calling customers can troubleshoot media quality issues for Webex Calling in Control Hub. However, with ThousandEyes integration, you can cross launch into the ThousandEyes application for even more details and further analysis of the network. Minute-by-minute data is collected. Per minute collection is recommended, given calls are generally shorter on Webex Calling.
When ThousandEyes metrics are available, for media calls, the cross-launch link and copy link are available in Control Hub. When the calling session has no media, the ThousandEyes link is not provided.
Limitations
- ThousandEyes for Webex Calling only supports calls on Webex App desktop, PhoneOS 3.2.1 and later, and Board, Desk, and Room Series devices.
- ThousandEyes data isn't applicable for all Webex Calling calls. If the call is established within the same network, it might be considered an ICE optimized call that doesn't pass through the Webex Calling cloud. Consequently, the ThousandEyes path won't be visible in this scenario.
- Tests indicated 100% packet loss when VPN was used, even though the actual calls weren't affected. This issue will be resolved in the next Endpoint Agent Client release. For more information, see ThousandEyes Documentation release notes.
ThousandEyes for Board, Desk, and Room Series devices
If you want to view ThousandEyes data for Cisco collaboration devices, read this article on how to set up the ThousandEyes Agent integration with those devices.
ThousandEyes for Cisco IP Phones
If you want to view ThousandEyes data for Cisco IP Phones, read this article on how to set up the ThousandEyes integration with those phones.
Keep in mind that:
- Meetings on the phone only show under . Meetings won't show under Live Meetings.
- ICE-optimized calls won't show network path.
How ThousandEyes work in Troubleshooting
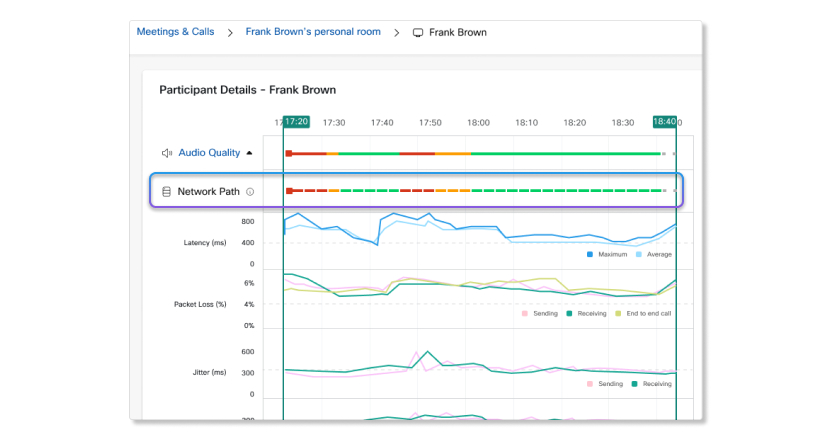
Network path provides the total round-trip loss, latency from the client to each hop, and any delays from one hop to the next
When a user with a ThousandEyes endpoint agent installed on their machine joins a meeting through the Webex App or with a Cisco collaboration device, a Network Path line will be visible under Audio Quality in their participant details page. This line indicates the network path quality of audio data between the user’s client and the audio media node. In general, audio and video data travel the same path, and serviced by the same media node, so you can get a good sense of what the user's video quality is like, too. The network path quality is displayed as dotted lines. Each dotted line is based on the intervals set in the automated session test.
Loss (round-trip) reported by ThousandEyes in the Network Path is the loss percentage prior to application error recovery. A high packet loss prior to error recovery may not necessarily indicate a poor user experience because the application may have recovered some packet loss during retransmission. Webex App performs packet recovery to enhance the user's experience during poor network connections.
The loss (round-trip) won't match the packet loss value under the Audio Quality since the latter value is measured after error recovery. Audio Quality packet loss is a better indicator to the actual user experience.
ThousandEyes AST starts capturing network path data as soon as the meeting starts. However, there could be a delay of up to five minutes before that data populates in Troubleshooting. When viewing a live meeting, refresh the page after five minutes if data hasn't populated yet.
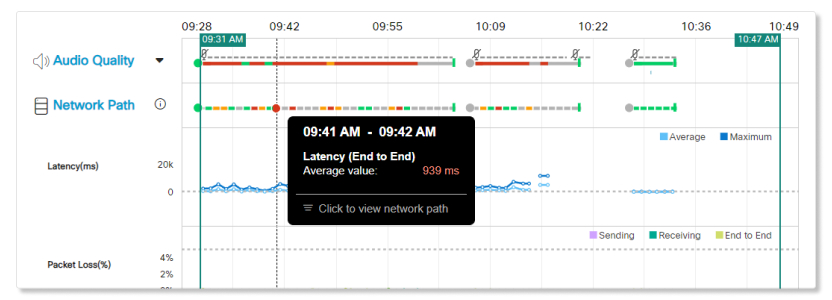
You can hover over a dotted line to see the user's latency (round-trip) average value during that interval. The color changes depending on the threshold that the value met. Thresholds are calculated as:
- Poor (red)—Latency > 400ms or Loss (round-trip) > 5%
- Good (good)—Latency < 300ms or Loss (round-trip) < 3%
- Fair (yellow)—Neither of the above.
- Unknown (grey)—Data isn't available from ThousandEyes to Control Hub. You may still be able to retrieve the metric from the ThousandEyes dashboard directly.
Click on the pop-up window to view in-depth information about the path route that the hop took to each node.
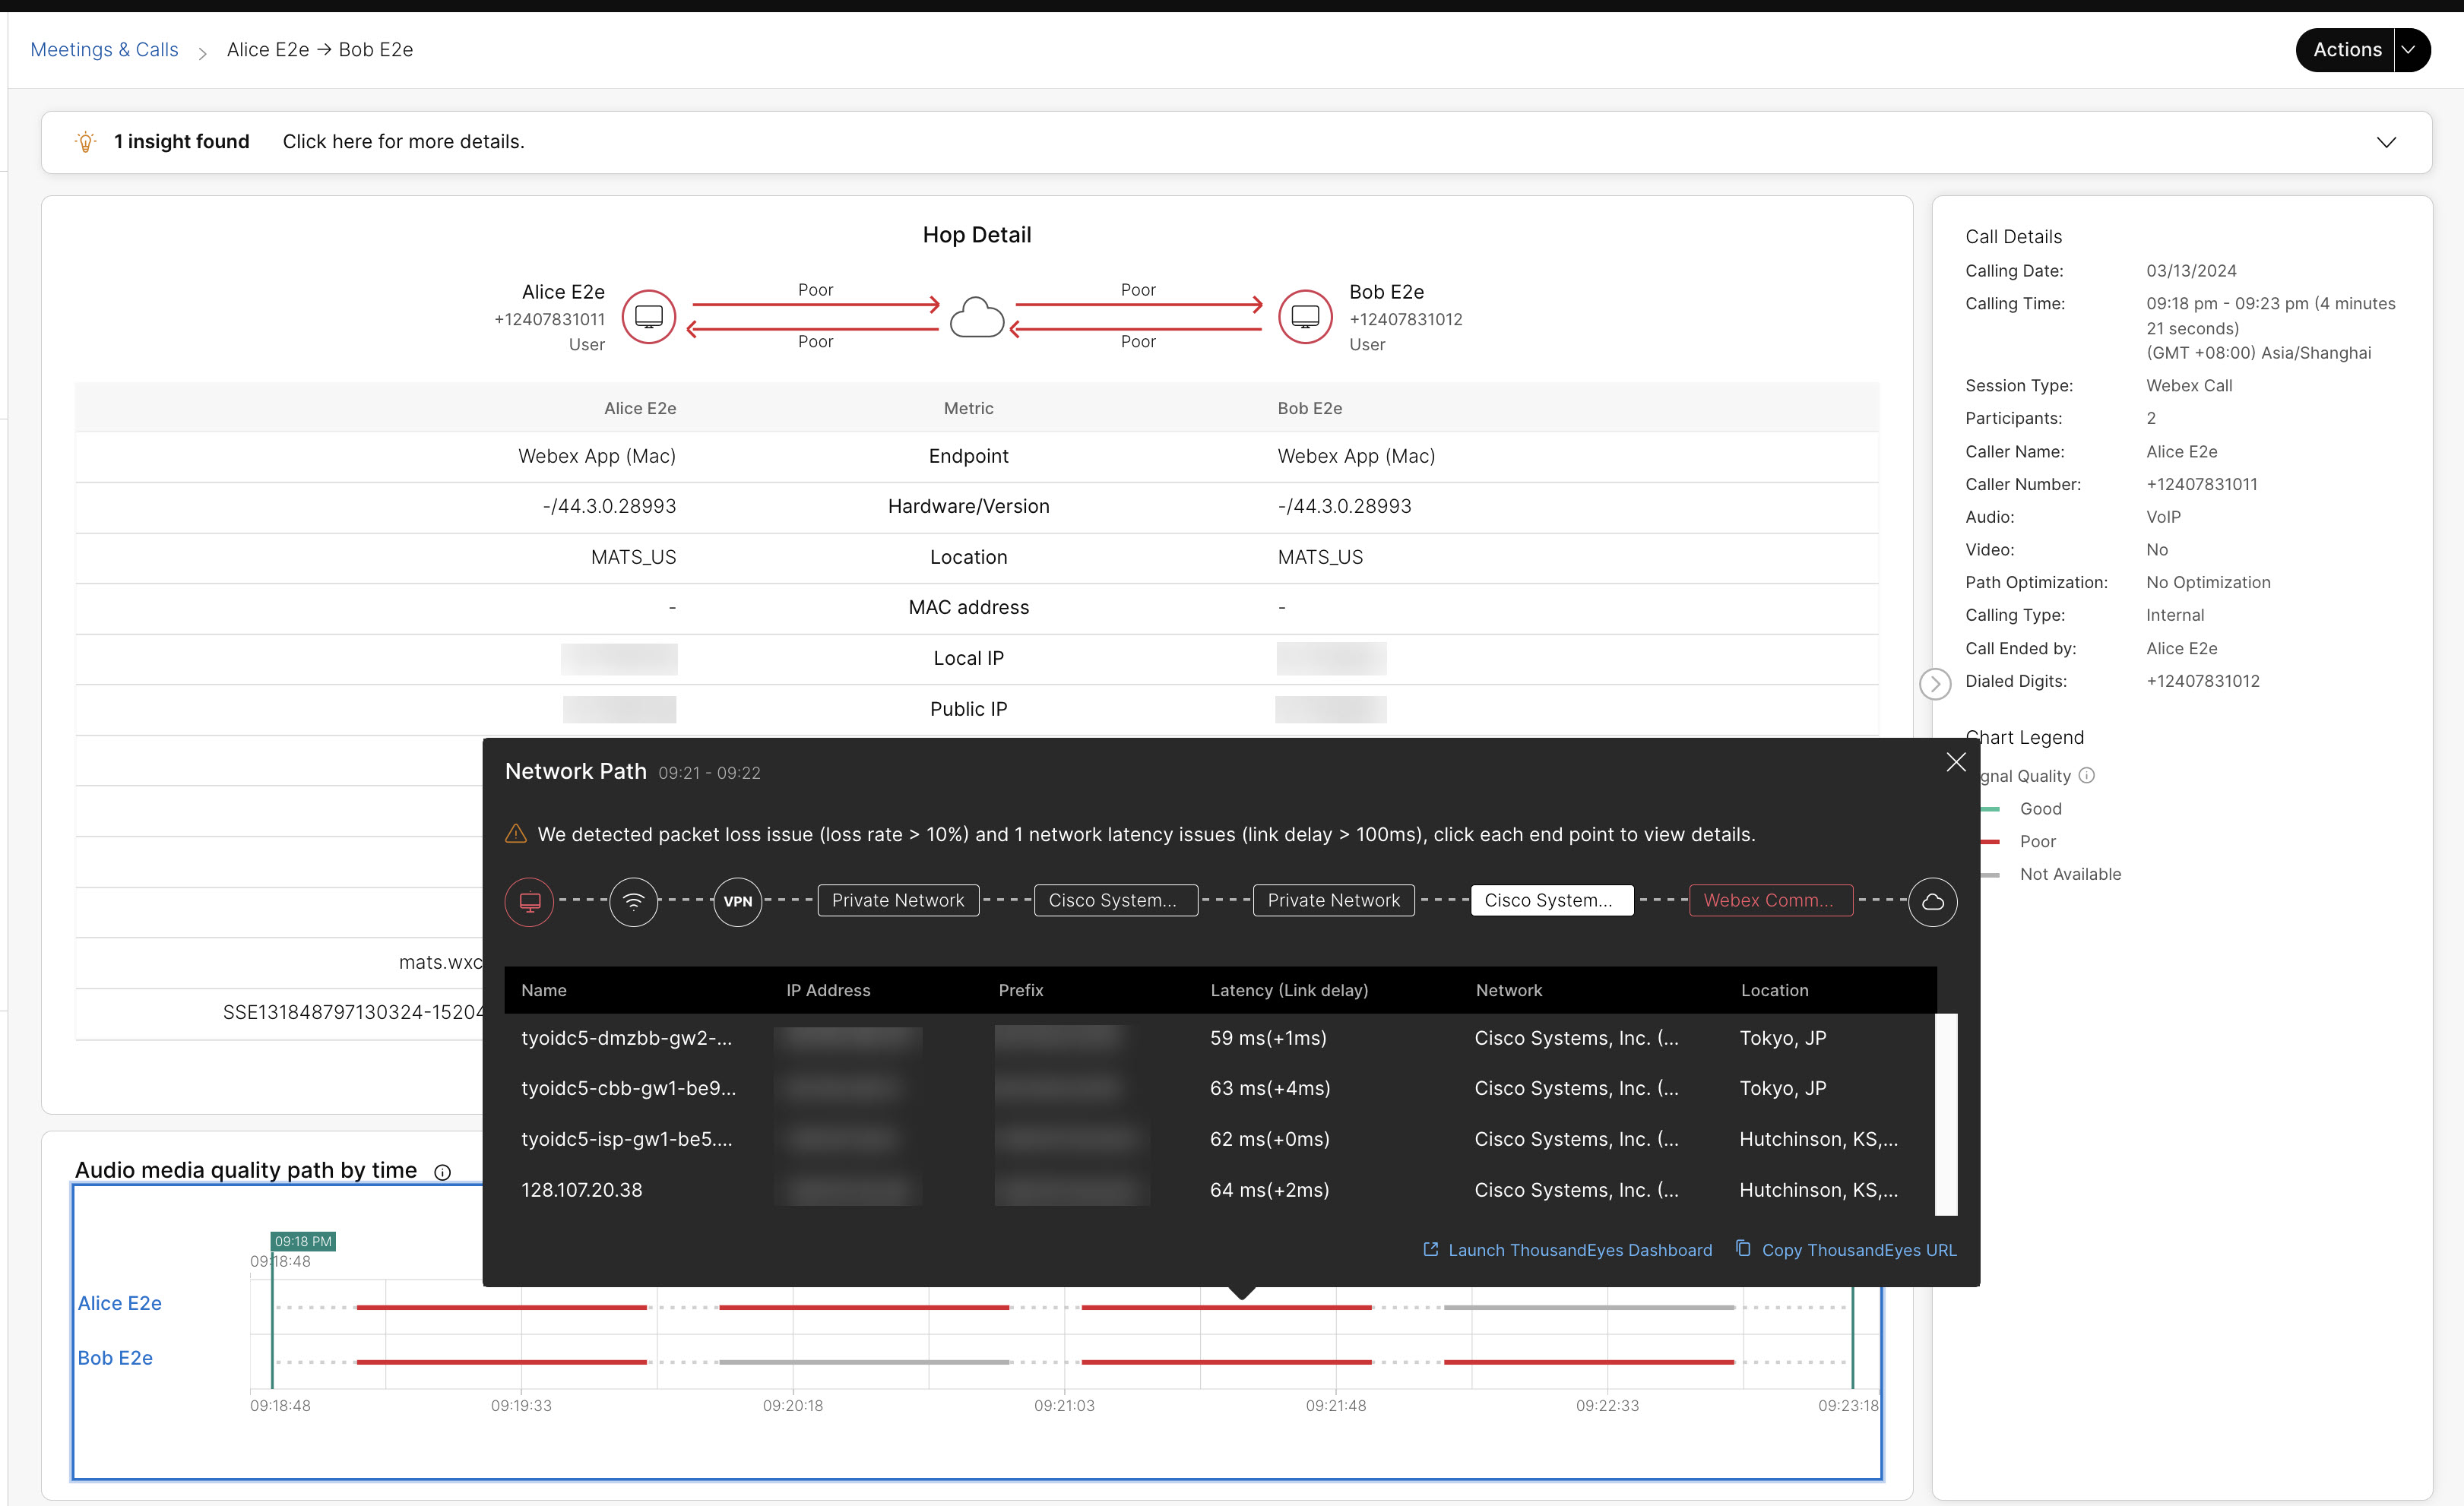
Network path route shows granular details for each node
The network path route shows the details for each node that the hop connected to. The latency column shows the latency from the client's machine to the next hop. Link delays are shown in the brackets, which is the latency from the last hop to the current hop.
User machine node details
This node shows details of the user machine's network.
| Name | Description |
|---|---|
| Name | Name of the user's machine. |
| IP Address | IP address of the user's machine. |
| Private IPv4 | Private IPv4 address of the user's machine. |
| Loss (round-trip) | Sending packet loss of the user's machine. |
| Latency | End-to-end latency of the user's machine. |
| Jitter | Sending jitter of the user's machine. |
| Location | Location of the user's machine. If the machine connected to a VPN, then it'll show the VPN location instead. |
Connection type node details
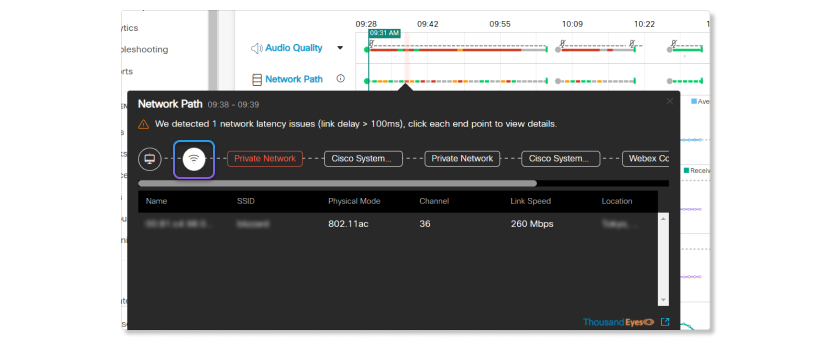
This node shows details about the connection type for the user's machine.
| Name | Description |
|---|---|
| Name | Name of the network connection. |
| SSID | Service set identifier of the network. |
| Physical Mode | Type of physical mode the network is using. |
| Channel | Channel that the network is using. |
| Link Speed | Bandwidth speed that the network is using. |
| Location | Location of the user's machine. If the machine connected to a VPN, then it'll show the VPN location instead. |
VPN node details
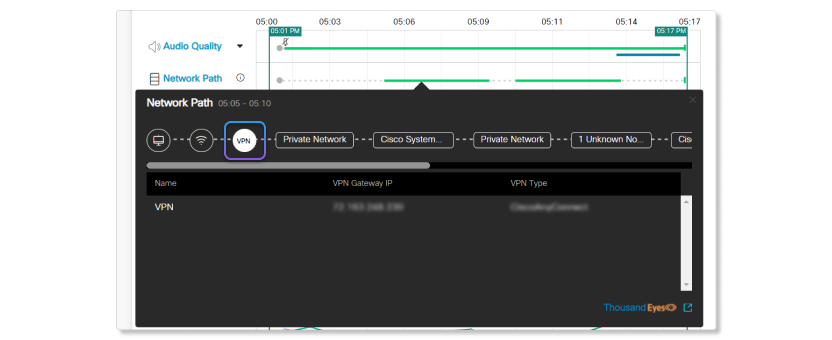
If the user's machine connected to a VPN, then you can see the details of the VPN used.
| Name | Description |
|---|---|
| Name | Name of the VPN. |
| VPN Gateway IP | Gateway IP that the VPN connected to. |
| VPN Type | Type of VPN used. |
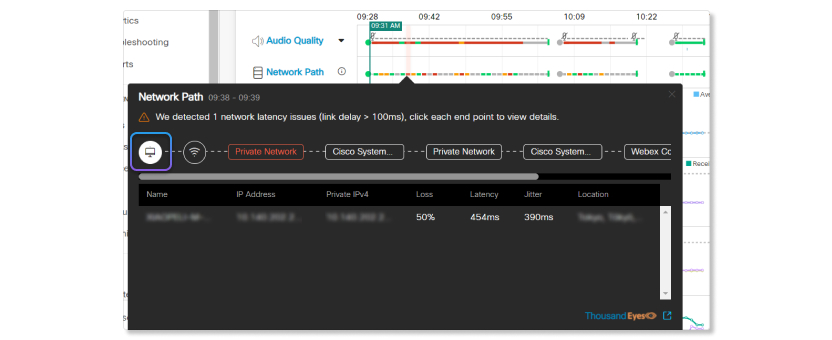
Network node details
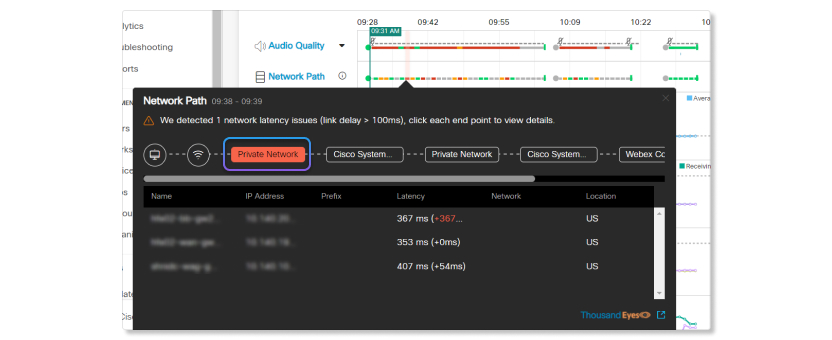
This node shows the details for all the hops made during the interval. A node will be highlighted as red if there's one hop in the node with more than 100ms latency.
| Name | Description |
|---|---|
| Name | Name of the hop. |
| IP Address | IP address of the hop. |
| Prefix | Prefix for the IP address of the hop. |
| Latency (Link Delay) | Number out of the brackets is the latency from the user's machine to this hop. Number outside of the brackets is the latency from the last hop to this hop. |
| Network | Network of the hop. |
| Location | Location of the hop. |
Install and activate ThousandEyes
Before you begin
In order to view ThousandEyes network path data in Troubleshooting, you must:
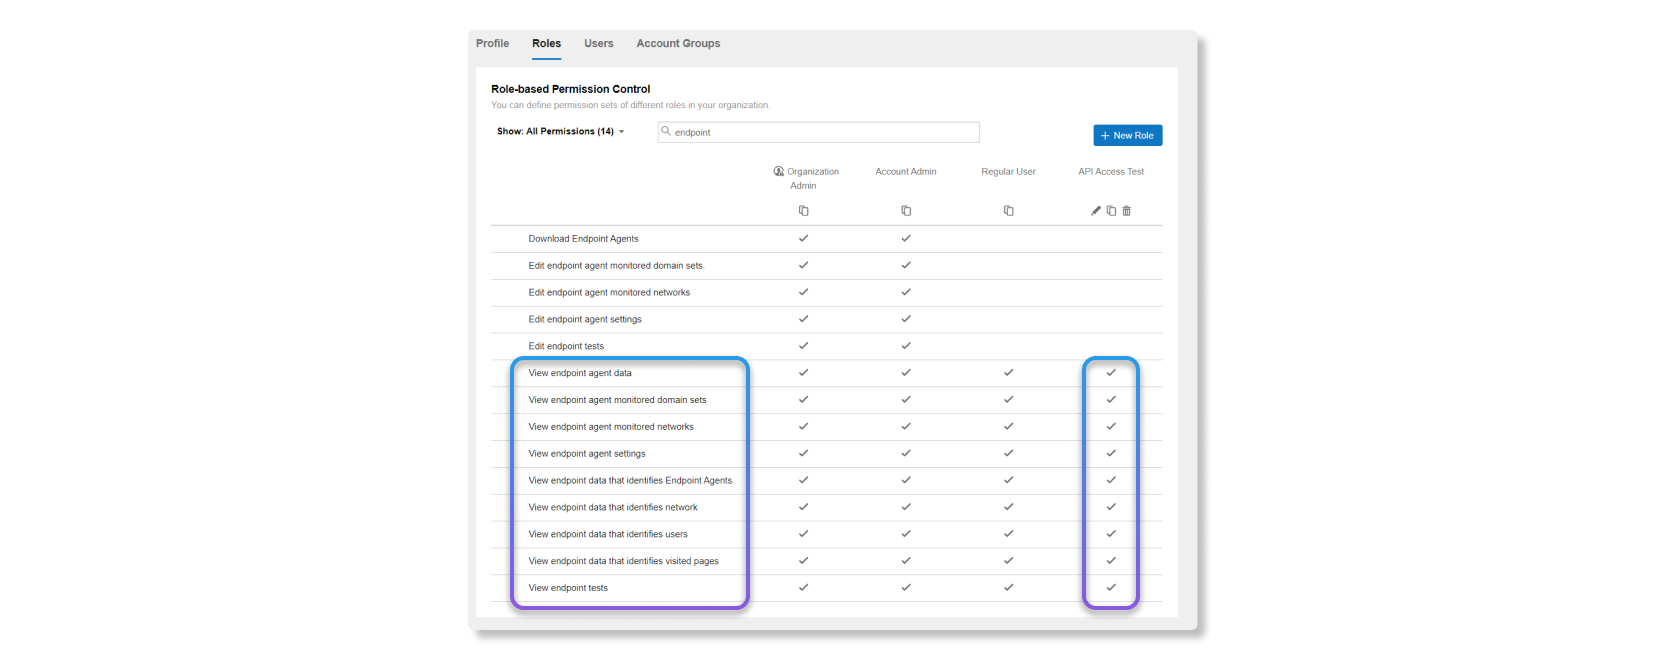
- Assign users to an account group in ThousandEyes.
- When assigning users to an account group, make sure that you have a role in ThousandEyes that allow you to
view endpoint agent data. Administrators with a role that doesn't have the correction
permissions won't be able to view ThousandEyes data. The minimum permissions required
to view ThousandEyes data are:
- View endpoint agent data
- View endpoint agent monitored domain sets
- View endpoint agent monitored networks
- View endpoint agent settings
- View endpoint data that identifies Endpoint Agents
- View endpoint data that identifies network
- View endpoint data that identifies users
- View endpoint data that identifies visited pages
- View endpoint tests
- When assigning users to an account group, make sure that you have a role in ThousandEyes that allow you to
view endpoint agent data. Administrators with a role that doesn't have the correction
permissions won't be able to view ThousandEyes data. The minimum permissions required
to view ThousandEyes data are:
-
Install endpoint agents on the machines that you
want to view ThousandEyes data for.
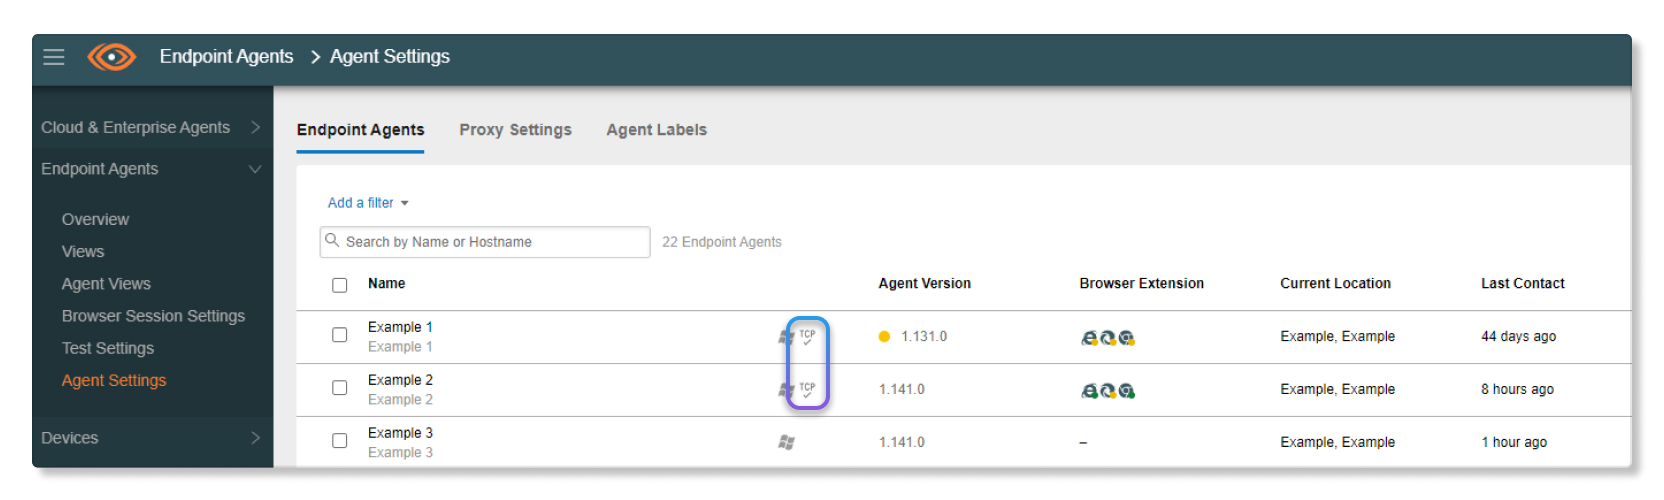
- To verify if a TCP driver was enabled on the endpoint agent that was installed on a
machine, go to . If TCP wasn't enabled, you can reference the Extended Network Tests Support for Windows on
how to enable the TCP driver post installation.
- To verify if a TCP driver was enabled on the endpoint agent that was installed on a
machine, go to . If TCP wasn't enabled, you can reference the Extended Network Tests Support for Windows on
how to enable the TCP driver post installation.
-
Create an automated session test for Webex and
select the agents to monitor. We recommend that you set up an AST the following way:
- Target—Webex
- Protocol—Auto detect with intervals as one minute.
- Agents—All agents
- Max No. of Agents—5000
- Create a token in ThousandEyes by going to the User API Tokens section in .
- Once you've completed all the installation steps in ThousandEyes, follow the upcoming steps to activate the ThousandEyes integration in Control Hub.
| 1 |
Sign in to Control Hub, go to Organization Settings, and scroll to the ThousandEyes section. |
| 2 |
Toggle the Allow ThousandEye API access switch to on. 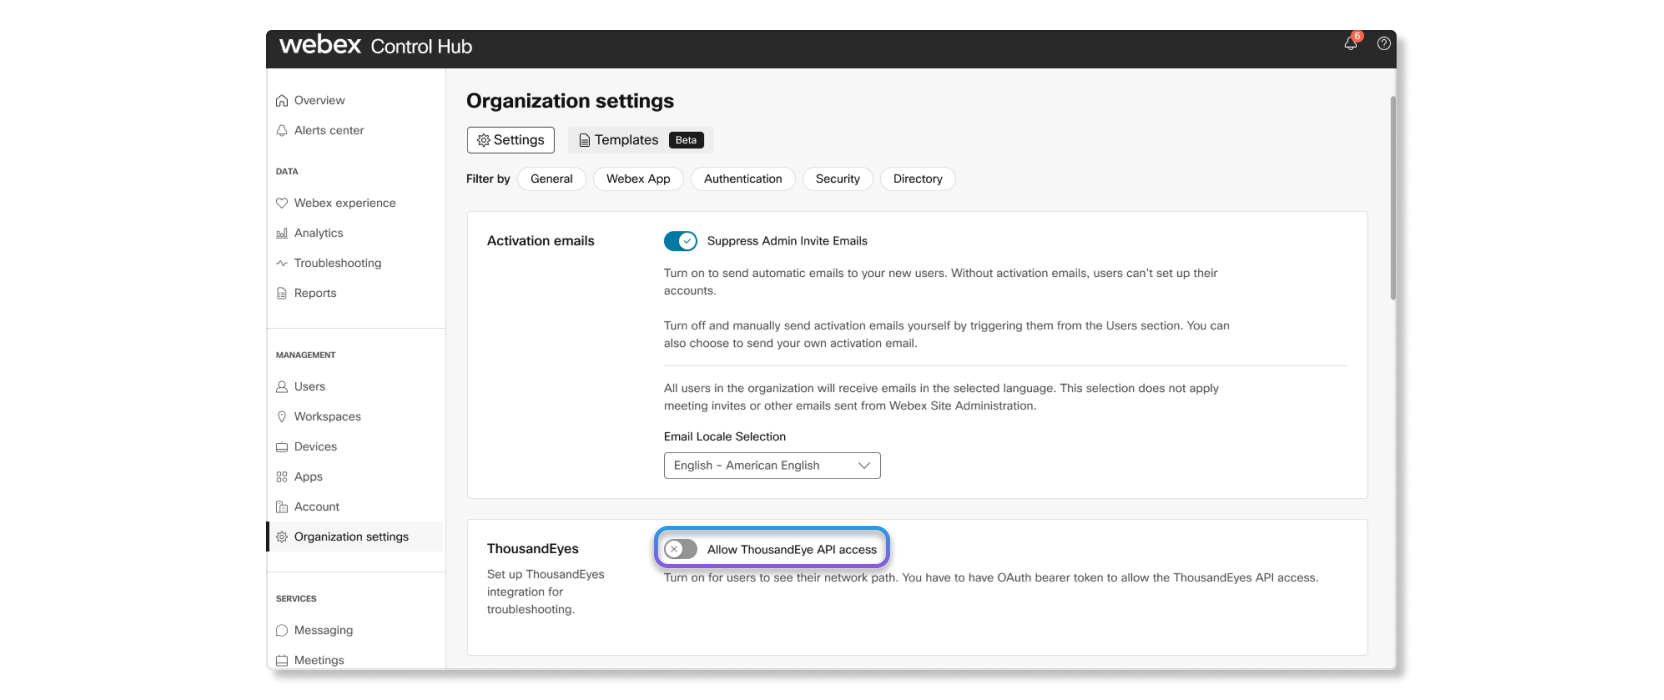
A pop-up window appears.
|
| 3 |
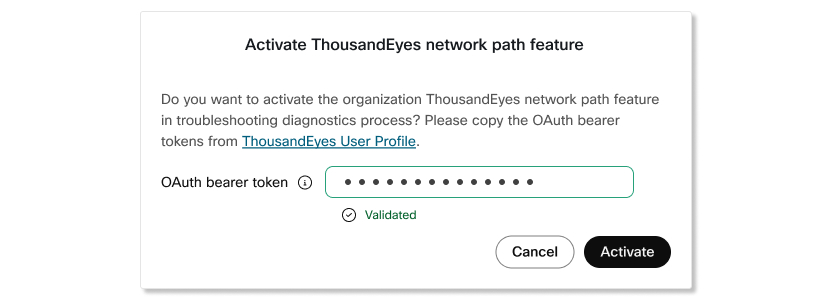
Paste the OAuth bearer token that you've copied from the ThousandEyes User API Tokens section. If the token is validated, then you can proceed to the next step. If the token isn't validated, an error will pop up. Make sure that the token matches the token that you copied in the ThousandEyes User API tokens section.
 |
| 4 |
Click Activate. |
What to do next
ThousandEyes endpoint agents will now monitor users whenever they join a meeting if they have endpoint agents installed on their machines.
Follow the best practices on how to set up tests with Webex Cloud Agents.
View ThousandEyes data in Troubleshooting
You can only view ThousandEyes data for users who have ThousandEyes endpoint agents installed on their machines.
| 1 |
Sign in to Control Hub and go to Troubleshooting. |
| 2 |
Search for a user and select a meeting or call. |
| 3 |
Click on the user's name. |
| 4 |
Hover over the dots in Network Path to view ThousandEyes network data. |
| 5 |
Click on the ThousandEyes icon to cross launch into the ThousandEyes dashboard to view more in-depth network data. |


