- Home
- /
- Article

Thanks for your feedback.

Dedicated Instance Analytics
 In this article
 Feedback?
Analytics in Control Hub allows the administrators to access interactive data visualizations that show important information, such as usage and adoption trends. Explore data as it automatically adapts to parameters that you specify in real time.
Dedicated Instance Analytics
The Dedicated Instance Analytics and visualization capabilities allows you to monitor the overall call quality and details of the end-point usage. The Dedicated Instance Analytics visualization and reports gives partners and customers insight into the setup, efficiency, and overall use of their calling devices. Partners and customers can use this insight and reports to drive their decisions.
As a full administrator, read-only administrator, or support administrator of an organization, you have access to various reports in Control Hub, depending on your deployment. You can use this information to evaluate how Dedicated Instance services and devices are being used in your organization and how often. You can use analytics to track and measure services in your cloud collaboration portfolio.
You can export these reports as a PDF, PNG, or CSV.
The Dedicated Instance Analytics displays the Overview cards of all the categories. The Dedicated Instance Analytics cards are categorised based on:
Service Experience
Service Experience
The Service Experience dashboard helps you to analyze the service quality distribution and traffic trends based on number of calls, location, or call duration.
The CMR must provide Severely Concealed Seconds (SCS) values. This is required for grading the quality of the calls.
The device details for this are collected from the Dedicated Instance and the call quality details are obtained from CDR.
Call Volume Status
Call Volume Status
| 1 |
From the customer view in Control Hub, go to . The Analytics Overview page appears. |
| 2 |
Go to Service Experience dashboard. |
| 3 |
Click the Call Volume Status card to view the information about call completion in terms of attempted, successful, failed, and dropped calls. On the page that appears, you can select various filters to visualize charts based on your selection. For more information, see Dedicated Instance Analytics Charts. |
Call Audio Quality
View Call Audio Quality
| 1 |
From the customer view in Control Hub, go to . The Dedicated Instance Overview page appears. |
| 2 |
Go to Service Experience dashboard. |
| 3 |
Click the Call Audio Quality card to view the information about call quality. On the page that appears, you can select various filters to visualize charts based on your selection. For more information, see Dedicated Instance Analytics Charts. |
Asset Usage
Asset Usage
The Asset Usage dashboard displays the charts for the endpoints and headsets usage in your organization.
The CDRs, CMRs, and device details for this are collected from the Dedicated Instance.
Calls that are not made using an endpoint are not shown or included in the asset usage charts. For example, trunk to trunk or conference bridge, and so on. Hence, Asset Usage charts do not show any data for SME type of Dedicated Instance clusters.
Call Count Trend
View the Details About Call Count Trend
| 1 |
From the customer view in Control Hub, go to . The Dedicated Instance Overview page appears. |
| 2 |
Go to Asset Usage dashboard. |
| 3 |
Click the Call Count Trend card to view the charts that are related to the endpoints from the selected Dedicated Instance cluster. On the page that appears, you can select various filters to visualize charts based on your selection. For more information, see Dedicated Instance Analytics Charts. |
Call Duration Trend
View the Details About Call Duration
| 1 |
From the customer view in Control Hub, go to . The Dedicated Instance Overview page appears. |
| 2 |
Go to Asset Usage dashboard. |
| 3 |
Click the Call Duration Trend card to view the charts that provide information about duration of calls where endpoints and headsets have been involved. On the page that appears, you can select various filters to visualize charts based on your selection. For more information, see Dedicated Instance Analytics Charts. |
Traffic Analysis
Traffic Analysis
The Traffic Analysis dashboard displays the charts related to Call Traffic Locations and Call Traffic Analysis.
The Call Traffic Locations displays the distribution of calls that are handled by assets, categorized based on Call Admission Control (CAC) location, whereas the Call Traffic Analysis displays the distribution of calls that are handled by assets, categorized based on different Call Types.
Call Traffic Locations
Call Traffic Locations
| 1 |
From the customer view in Control Hub, go to . The Dedicated Instance Overview page appears. |
| 2 |
Go to Traffic Analysis dashboard. |
| 3 |
Click the Call Traffic Locations card to view the information about call distribution based on Call Admission Control (CAC) location. On the page that appears, you can select various filters to visualize charts based on your selection. For more information, see Dedicated Instance Analytics Charts. |
Call Traffic Analysis
Call Traffic Analysis
| 1 |
From the customer view in Control Hub, go to . The Dedicated Instance Overview page appears. |
| 2 |
Go to Traffic Analysis dashboard. |
| 3 |
Click the Call Traffic Analysis card to view the information about call distribution analysis based on call types. The supported call types are P2P, ICT, SIP Trunk, Conference, MGCP, Voice Mail, Hunt Group, Webex Meeting, and Hybrid Calls. For a call to be classified as ICT type, the telemetry module must be installed on the trunk destination node. When a call is not recognized as any of the supported call types, it is marked as Not Classified. From the supported call types, Hunt, Webex, Conference, and Voicemail, requires you to enable PII. On the page that appears, you can select various filters to visualize charts based on your selection. For more information, see Dedicated Instance Analytics Charts. |
Capacity Analysis
Capacity Analysis
The Capacity Analysis dashboard displays the analytics charts related to Trunk Usage.
The Trunk Usage analytics chart displays information about Trunk Usage for top five trunks from all the Trunk types that are configured within a Call Manager.
Trunk Usage
Trunk Usage
| 1 |
From the customer view in Control Hub, go to . The Dedicated Instance Overview page appears. | ||||||||||||||||||||
| 2 |
Go to Capacity Analysis dashboard. | ||||||||||||||||||||
| 3 |
Click the Trunk Usage card to view the information about Trunk Usage for all the Trunk types configured within a Call Manager. On the page that appears, you can select various filters to visualize charts based on your selection. For more information, see Dedicated Instance Analytics Charts. The Trunk Usage also displays the Trunk Peak Utilization table as per the Call Count and Call Duration. You can select a trunk and click Set max con. calls to set maximum concurrent calls.
You can set max concurrent calls for a particular trunk and multiple trunks. To set max concurrent calls for a particular trunk, click the three dots that represent the option menu in the Actions allowed for that trunk. To set max concurrent calls for multiple trunks, select the trunks and click Set max con. calls to set the value for all the selected trunks. The following are a few of the use cases for setting max concurrent calls:
The Trunk Peak Utilization table displays the following details:
|

Reports and Charts
If you have a valid account and required credentials to Control Hub, then you can access the Analytics page through Site Administration.
-
The charts show data in Greenwich Mean Time (GMT).
-
If Dedicated Instance is upgraded from version X to version Y, then both versions are displayed in the Analytics charts. The latest data is shown under Dedicated Instance Version against the latest upgraded version. However, the calls that are counted against the previous version continues to show for the selected duration.
-
When the Cluster ID is changed, then the Analytics Cluster drop-down list shows the updated Cluster name from next day onwards. The detailed view charts in both service experience and asset usage Dedicated Instance Cluster chart shows the latest cluster name. The older cluster name continues to show and represent the previously processed call count.
-
Analytics now supports user filters.
-
You can use the user filters such as the User ID, URI, and Phone Number to filter the various charts in Analytics. If the Data Collection Agreement hasn't been accepted yet through any other service, clicking on these filters would provide you an option to review and accept the agreement.
-
This information is also available in downloaded data for the Service Experience and Asset Usage charts.
-
Analytics now supports Calling Number and Called Number charts as well.
-
The customer admin must change the required PII setings for user filter support as well as the charts representing Calling Number and Called Number.
-
For information about how to use Dedicated Instance Analytics Charts, see the following table:
|
Report |
Menu Navigation |
Description / Scenario |
|---|---|---|
| CAC Location Bandwidth |
|
Shows the distribution of calls that are handled by assets categorized based on Call Admission Control (CAC) location. Scenario: Your clusters are set up based on the geographical region and you want to get an idea of the amount of call traffic to and from your Northern office in relation to your Southern office. Select your Northern office in the CAC Location Bandwidth chart. |
| Call Audio Quality (CAQ) Distribution |
|
Displays a distribution of all the Successful, Dropped, and Failed calls that are Good, Acceptable, and Poor, i.e. Call Audio Quality (CAQ). For more information refer to Call Quality Grades, Table 1. Call Grading Explanation. Scenario: Your IT organization received several complaints of poor call quality from users in a given cluster and you want to get an idea of how widespread the problem is. You check the Call Audio Quality (CAQ) Distribution chart to see the number and percentage of poor calls in that cluster. |
| Call Classification |
|
Shows the distribution of calls based on call Classification. Calls are Classified as OnNet (Non-PSTN Calls), OffNet (PSTN Calls) and Internal (Intra Company Calls). Scenario: You just heard reports of a phone phishing scam, and you want to see if your off-net calls increased recently. You examine the Call Classification chart for changes in your off-net calls. |
| Call Count Trend |
Shows the trend for calls that are handled by assets, which are grouped by endpoint total and headset total. Scenario: Your organization recently introduced a new initiative to increase cold call sales and you want to see how the new initiative affects your phone usage over time. You check the Call Count Trend chart to see if calling increased over time. |
|
| Call Duration Trend |
Shows call duration (in minutes) over time. Scenario: Your IT organization is phasing in a new FAQ portal, and you want to see how each phase affects the amount of time your IT professionals spend dealing with calls. You check the Call Duration Trend chart to see if there is a decrease in the amount of time your associates spend on calls. |
|
| Call Failure Analysis |
Shows calls based on the Call Termination Cause Code for Failed or Dropped calls. Scenario: Your phone system operates with a high-degree of stability, but you want to monitor the system to ensure continued efficiency. You periodically check the Call Failure Analysis chart to monitor for any changes in call success rate. |
|
| Call Media Type |
|
Displays a distribution of all Successful, Dropped, and Failed calls based on the call media (audio/video) type. Scenario: Your organization is responding to new work-from-home policy due to a global pandemic. You want to ensure that your workers are making full use of your phone system’s capabilities, including video options. This report shows you the number of video calls that are made over a given timeframe. |
| Call Security Status |
|
Shows the calls that handled based on security status. Authenticated or encrypted calls are Secure. All other calls are Non-Secure. Scenario: You want to see the number of Non-Secure calls originating from your Southern cluster. Click Secure in the Call Security Status chart, then examine the number of calls for your Southern cluster in the Physical Location chart.
|
| Call Status Distribution |
|
Shows number and percentage of Attempted, Successful, Failed, and Dropped calls. Scenario: You want to get an idea of the success of attempted video calls at your Southern cluster so you click Video in the Call Media chart, then you click your Southern cluster in the Physical Location chart. You then examine the distribution of calls in the Call Status Distribution chart. |
| Call Status Trend (Call Volume Status) |
|
Shows how Successful, Failed, and Dropped calls trend over time. Scenario: You recently installed hardware updates and now you want to monitor your system’s performance. You examine a period of time that is two weeks before to two weeks after the update to see if there are noticeable trends. |
| CAQ Trend |
Shows how Good, Acceptable, and Poor calls trend over time. Scenario: Your organization has received periodic complaints of poor call quality. You believe that the cause is higher call volume on the days leading up to a national holiday. You use the CAQ Trend report to determine if call quality dips during pre-holiday periods. |
|
| Codec |
|
Shows the calls that are handled by call codec type. You can also see a visual breakdown of the various types of codecs used. Scenario: You want to see the codec type used in your Northern cluster. You select your Northern cluster in the Physical Location chart, and then you examine the Codec chart to see the number of H261 codecs used. |
| Device Pool |
|
Displays a trend of all Successful, Dropped, and Failed calls, made by endpoints in a device pool. Device pools provide a convenient way to define a set of common attributes that can be assigned to devices, such as IP Phones, instead of allocating individual attributes to individual phones. Shows the calls that are handled according to a logical grouping you’ve created. Scenario: You’ve created a logical grouping of devices called Group A, Group B, and Group C. Group C represents your conference room devices. You want to see if these devices decrease in demand after your business core hours. You select Group C in the Device Pool chart, then you examine the Distribution by Time chart to see if usage has drastic decrease, as expected. |
| Distribution by Asset |
|
Shows the calls that are handled using assets (endpoints and the headsets that are connected to the endpoints). Scenario: You want to see the number of video calls made using a headset over the past year. So, you select Last 12 Months for the time period, you select Video in the Call Media Type chart, and then you examine the Distribution by Asset chart to see the number and percentage of calls with a headset for the selected criteria. |
| Distribution by Time |
|
Shows calls handled at 4-hour time intervals throughout the day. Scenario: You want to investigate the video calling habits within your organization to see if there is time of day when your associates make or receive the most video calls. You select Video in the Call Media Type chart, then scan the Distribution by Time chart to see how video calls are distributed. |
| Endpoint Media Capability |
|
Shows the calls that are handled based on the endpoint’s ability to make and receive Video or Audio calls. Scenario: You want to know the number of video calls that are handled from a pool of endpoints that have video calling capability. You hover over Video in the Endpoint Media Capability chart to see the number of calls handled by video-capable endpoints. You then hover over Video in the Call Media Type chart to see the number of actual video calls handled. |
| Endpoint Series |
|
Shows calls handled by endpoint type over time. Scenario: Your Northern office recently purchased new DX type endpoints and you want to see the current use of the DX endpoints. You select your Northern cluster in the Physical Location chart, and then you go to the Endpoint Series chart to see how use of the DX Series gradually increases over time. You also check to ensure that use of the previous endpoint type gradually decreases over time. |
| Headsets by Model |
|
Shows calls handled by headset model over time. Scenario: Your organization is phasing in new headsets and you want to see the rate at which the new headsets are phasing in and the old headsets are phasing out over time. |
| Physical Location |
|
Shows calls based on location. Scenario: You want to see the headset model used at your Southern office over time. You select your Southern office in the Physical Location chart, and then you examine which headsets are in use in the Headsets by Model chart. |
| Unified CM Cluster |
|
Shows the calls that are handled according to Unified CM cluster. Scenario: Your organization has moved many devices to a new cluster, and you want to verify that the move was successful. You go to the Device Pool chart and select the devices that were moved. You then examine the Unified CM Cluster chart to ensure that the devices are now in the new cluster.
|
| Unified CM Version |
|
Displays a distribution of all the Successful, Dropped, and Failed calls grouped by Unified CM Cluster. Scenario: You want to see the Unified CM version your Northern office is using. You select your Northern office in the Physical Location chart. Then, you examine the Unified CM Version chart to verify that your Northern office is using the correct Unified CM version. |
|
Call Traffic Locations Distribution Call Traffic Locations |
|
Shows the call traffic distribution for the top five locations. Scenario: Your clusters are set up based on the geographical region and you want to analyse the amount of call traffic to and from your Northern office in relation to your Southern office. Select your Northern office in the CAC Location chart. |
| Call Direction |
|
Displays a distribution of all incoming and outgoing calls for all Successful, Dropped, and Failed calls. Scenario: You want to see the total number of calls that are placed or received from your office in a particular physical location. Then, you examine the Call Direction chart to verify the total incoming and outgoing calls for that location. |
|
Call Distribution By Time |
|
Displays a trend of all Successful, Dropped, and Failed calls made at different time intervals in a day. Scenario: Your organization is planning to expand their services to new locations or analyse the cause for low volume call types. This report shows you the number of calls that are made over a given timeframe for a selected location or a particular call type. |
|
Call Traffic Analysis Distribution Call Traffic Analysis |
|
Displays the distribution of calls and call trend based on the volume of traffic that is received for the top five call types. Scenario: Your organization wants to analyse the cause for low volume call types and identify the most preferred call type. This report shows you the number of calls and call trend based on the volume of traffic that is received for the top five call types. |
|
Call Status |
|
Displays a distribution of all Successful, Dropped, and Failed calls. Scenario: Your organization wants to identify the reason behind the calls that failed, are not successful and dropped most of the time. This report shows you the number of calls that are made and received in a network for all the call types based on the Successful, Dropped, and Failed status. |
| Over-the-Top (OTT) Calls |
|
Displays a distribution of all Successful, Dropped, and Failed OTT calls, also known as Mobile and Remote Access (MRA) calls for the following:
Scenario: You want to analyse and identify the type of call traffic between particular endpoints such as between MRA to Non-MRA. Select MRA to Non-MRA in the MRA calls chart. |
| Call Admission Control (CAC) Location |
|
Displays a distribution of all the Successful, Dropped, and Failed calls by location, also known as Call Admission Control (CAC) Locations. Scenario: Your clusters are set up based on the geographical region and you want to analyse the type of call traffic to and from your Northern office in relation to your Southern office. Select your Northern office in the CAC Location chart. |
|
Trunk Usage Distribution |
|
Displays a distribution of Trunk usage for top five Trunks that are configured within a call manager. Scenario: Your organization wants to analyze the capacity usage and identify the trunks that are utilizing the maximum capacity. Select the Trunk in the Trunk Usage Distribution chart. |
|
Trunk Type Distribution |
|
Displays a distribution of Trunk Type for top five Trunks that are configured within a call manager. Scenario: Your organization wants to analyze the capacity usage and identify the trunks that are utilizing the maximum capacity. Select the Trunk type in the Trunk Type Distribution chart. |
|
Trunk Type Trend |
|
Displays the trend of Trunk usage distribution across all the Trunk Types that are configured within the call manager. Scenario: Your organization is planning to increase the overall capacity and wants to identify the trunks that are processing the maximum calls. Select the Trunk Type Trend chart. |
|
Trunk Usage Trend |
|
Displays the Trunk usage trend for top five Trunks that are configured within a call manager. Scenario: Your organization wants to identify the trunks that are utilizing the least capacity and shut them to reduce the overall capacity usage. Select the Trunk Usage Trend chart. |
| Field Title | Description |
|---|---|
| Endpoints call count | Number of calls in which at least one endpoint is involved. Endpoints call count also include the calls that are initiated from Jabber and Webex Teams. |
| Total call minutes | Total duration of all the calls (minutes) that are made using the assets. |
| Total Number of Endpoints in Calls | Total count of endpoints that participate in the calls. One endpoint could participate in multiple calls. |
| Headsets call count | Number of times during which at least one headset is involved in a call. |
| Headset call minutes | Total duration of all the calls (minutes) that are made using headsets. |
| Total Number of Headsets in Calls | Number of times headsets participate in calls. |
| Total Classified Call Count | Total number of calls from all the locations and category. |
| On-net Call Count | Total number of On-net calls. On-net calls are non-PSTN calls. |
| Off-net Call Count | Total number of Off-net calls. Off-net calls are PSTN calls. |
| Internal Call Count | Total number of calls made within the organization. Internal calls are intra company calls. |
|
OTT Calls |
Total number of successful, dropped, and failed OTT calls. Also known as Mobile and Remote Access (MRA) calls. |
|
Total Call Count On Trunks |
Total number of calls recorded on Trunks |
|
Session Initiation Protocol (SIP) Calls |
Total number of calls from SIP trunk |
|
Media Gateway Control Protocol (MGCP) Calls |
Total number of calls from MGCP trunk |
|
Inter Cluster (ICT) Calls |
Total number of calls from ICT trunk |
|
Peer-to-peer (P2P) calls |
Total number of calls from P2P trunk |
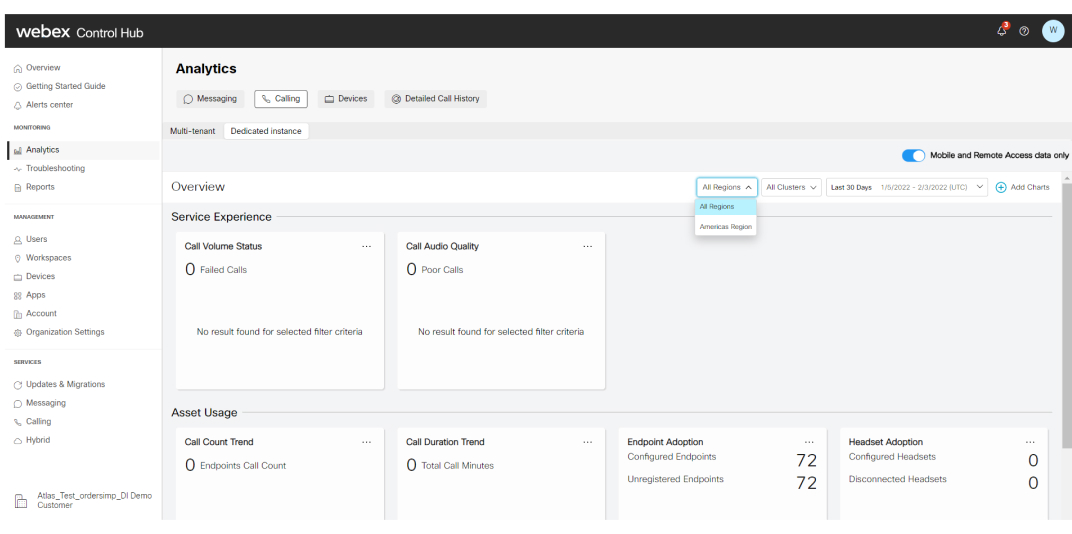
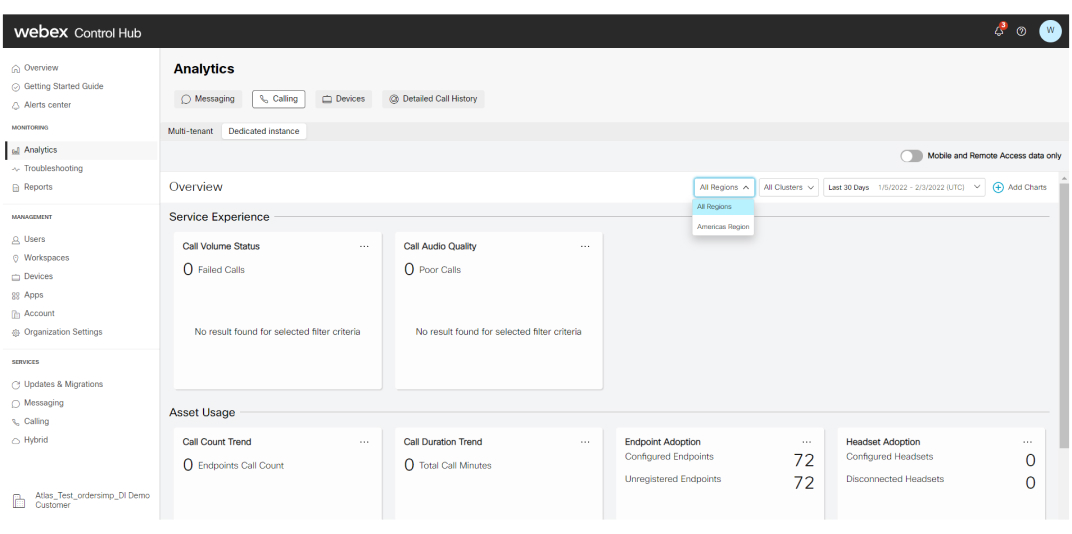
View Analytics
Run Analytics
| 1 |
From the customer's view in Control Hub, go to . The Dedicated Instance Overview page appears. You can select Multi-tenant to look into multi-tenant analytics visualization. Based on the services that have been enabled, you can select Messaging, Calling, Devices, and Detailed Call History from the Analytics menu for specific Analytics visualization. The partners can see the analytics of their customers from the Cisco Webex Partner Hub:
|
| 2 |
The Dedicated Instance Overview page displays the cards related to Service Experience, Asset Usage, Traffic Analysis, and Capacity Analysis . |
| 3 |
(Optional) To view the analytics for MRA data, enable the MRA data only toggle.
 |
| 4 |
(Optional) Select a region from the region selection drop-down list. The default setting is All Regions. Region represents the geographical location of the datacenters configured during Dedicated Instance Activation. |
| 5 |
(Optional) Select a cluster from the cluster selection drop-down list. The default setting is All Clusters. |
| 6 |
To filter the data in the charts based on the time period, click the drop-down list in the top right. 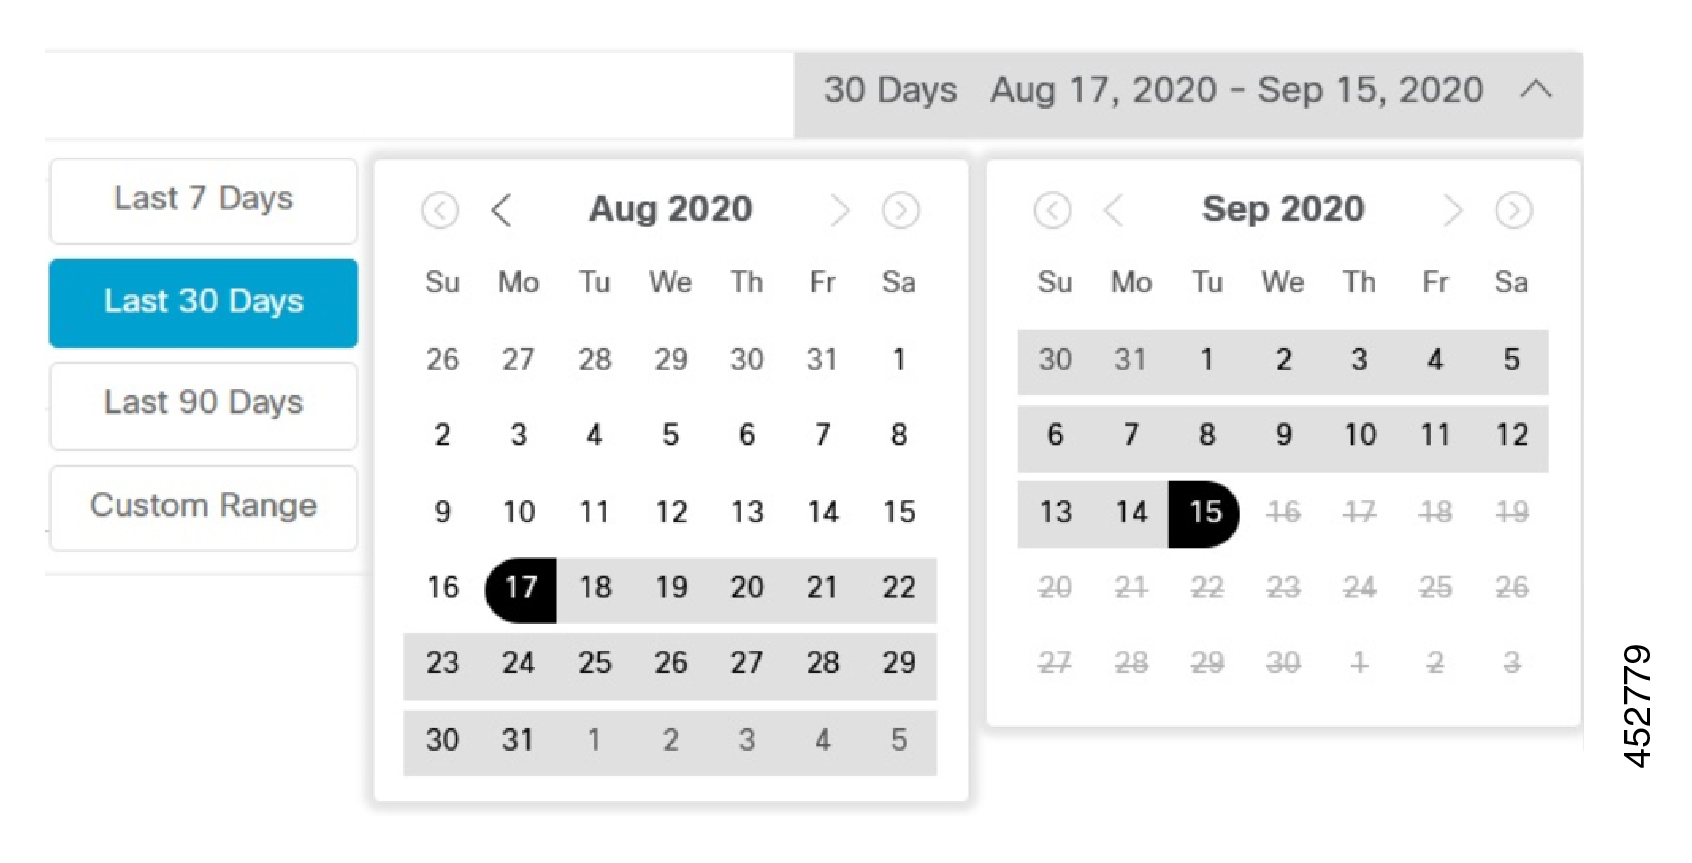 Supported time ranges are yesterday, last 7 days, last 30 days, last 90 days, and last 12 months. You can view the charts for the period you have selected. The default time range is Last 30 Days. If you select from Yesterday the drop-down list, the UP and DOWN trends are based on the data that is compared with the two days prior with the previous day. Similarly, if you select Last 7 Days, then the % UP or DOWN trend is calculated based on the comparison between data for the past 7 days with the data for the previous fortnight. |
| 7 |
The Dedicated Instance Analytics Overview page allows you to add additional charts using the Click the Add Charts option on the top right and select the chart that you want to add from the available charts. You can also remove a card. Click the three dots to the top right corner of a card and select Remove Card. 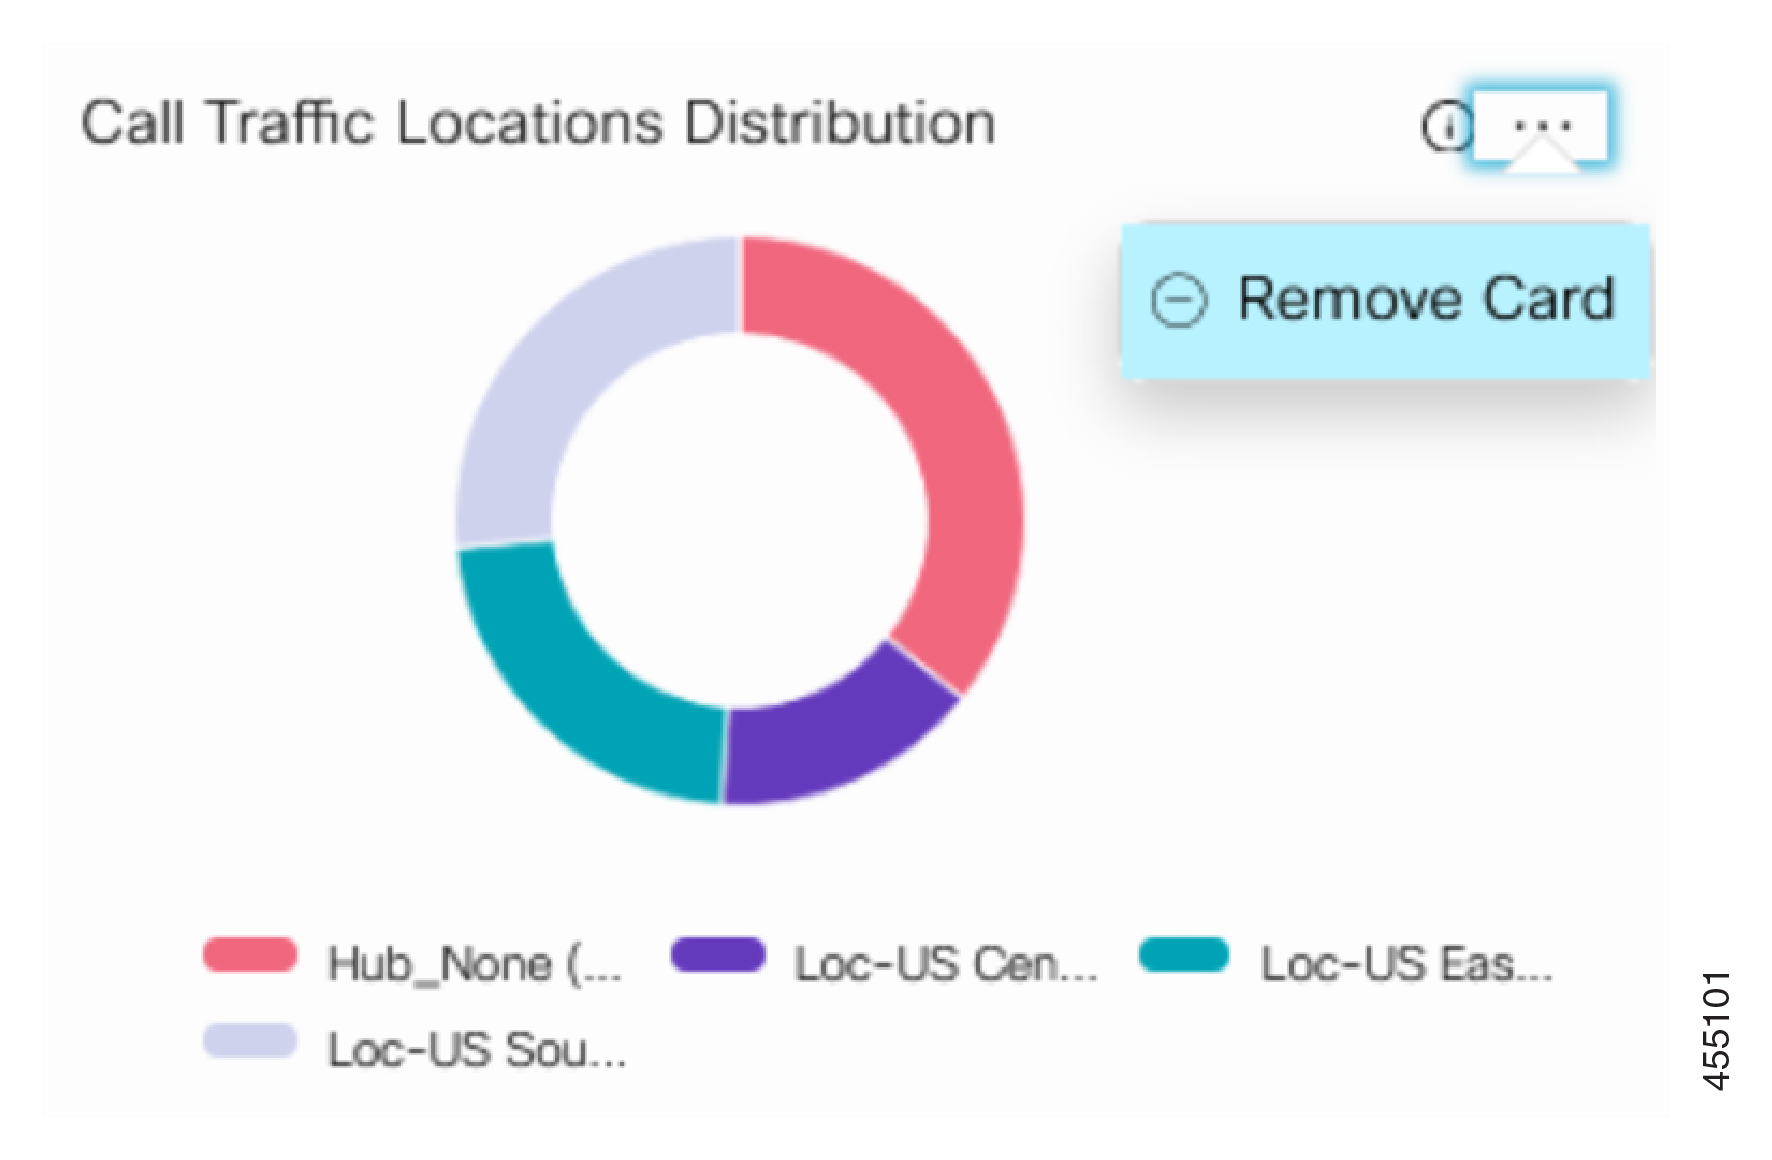 |
 against a Customer Name represents that the customer is entitled to Dedicated Instance service.
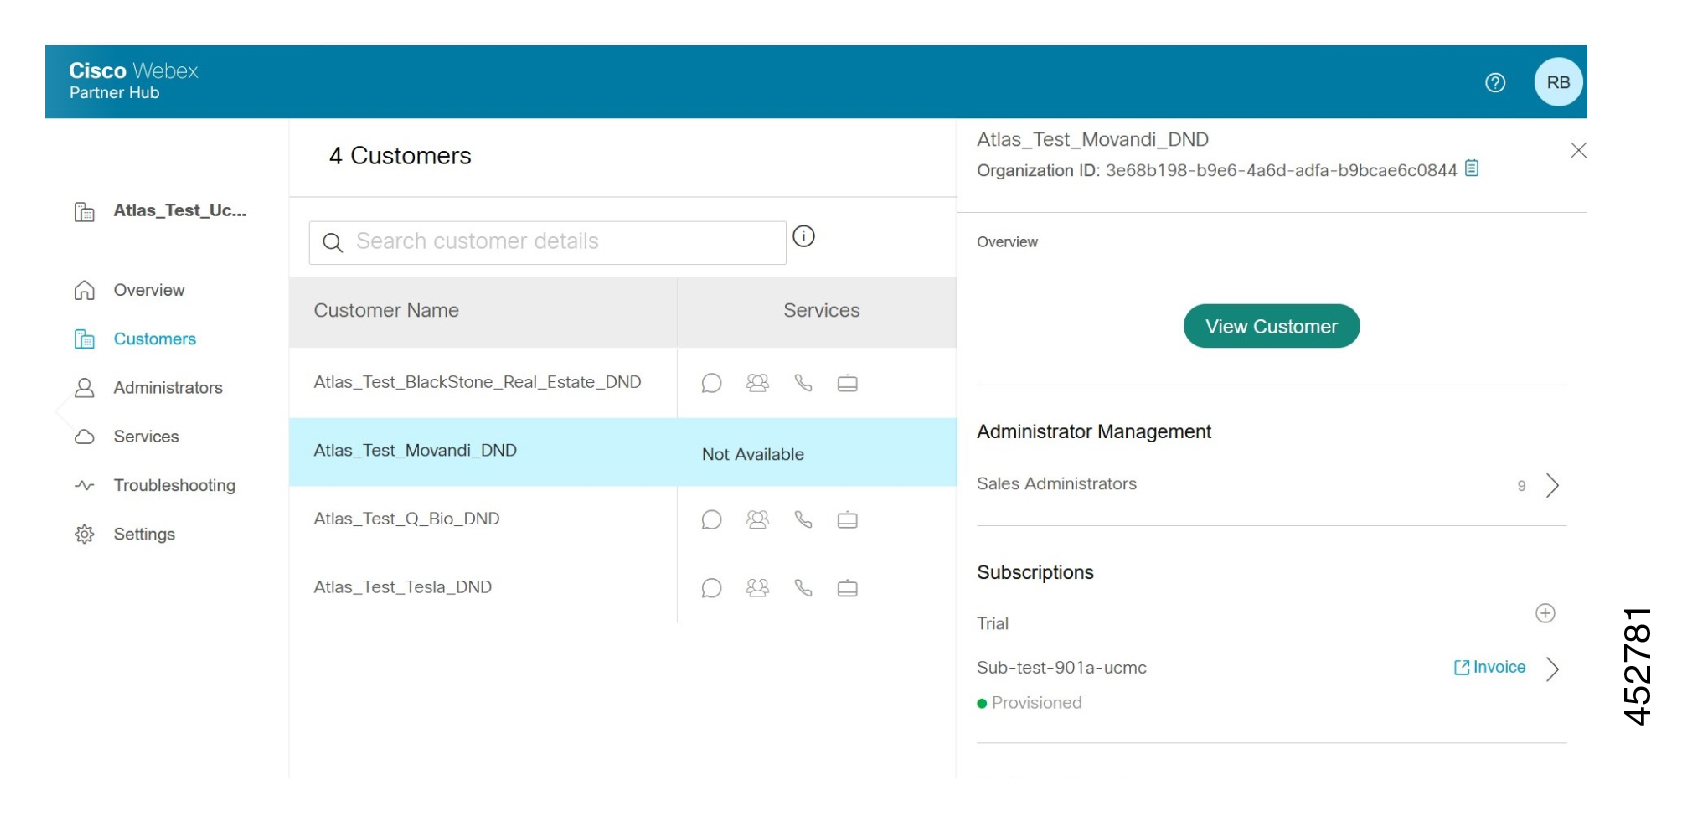
 option.
Download Analytics
Download Analytics
You can export the data that is displayed in the charts into an Excel file using the Download button.
You must wait until the Excel report is downloaded, else the download fails.
Troubleshooting Analytics
Troubleshooting Analytics
|
Issue |
Resolution |
|---|---|
|
Dedicated Instance tab doesn't appear after Control Hub sign-in. |
The role, scope, or entitlement that's assigned to you could be incorrect or insufficient. Contact Cisco TAC support. |
|
When you click the Dedicated Instance tab, 403 Forbidden message is displayed. |
|
|
Analytics page is not loading for incognito mode in Chrome. |
Go to and select Allow all cookies. For other browsers, enable cookies using the relevant menu options. |
|
Charts are not loading on the Analytics UI. |
|
|
In the Analytics UI, some of the charts don't have any data. |
|
|
Charts on the Analytics UI do not display data. |
Check if the telemetry service is stopped. |
|
Charts on the Analytics UI display incorrect data. |
Contact Cisco TAC support. |
|
Call Failure Analysis chart in the Service Experience category doesn't show any failure data. |
Check if CDR Log Calls with Zero Duration Flag in the Dedicated Instance service parameters have been enabled for all Dedicated Instance nodes. If it is not enabled for all nodes, ensure that you enable it. |
|
Enable PII settings |
To enable PII settings:
|


