- Home
- /
- Article

Thanks for your feedback.

 In this article
 Feedback?
As a supervisor, review your agents and queues. View realtime data and review any historical data for agents and queues.
Sign in to Webex App
| 1 |
Open Webex, or download the app. |
| 2 |
Click Sign in, enter your email address, and then click Next. Follow the steps for your organizations sign in. |
Monitor all agents
Your administrator sets you up with agents in queues. Monitor all the agents and review their information in real time.
| 1 |
Click Customer Assist
Agent information displays including: name, state, state duration, Queue, Contact status, and Time in contact duration. When an agent is on an outbound call, an Outgoing call |
| 2 |
Choose how you want to view the agents:
|
 , click
  icon appears after Contact status.
Monitor an agent on a call
Listen in to a conversation between an agent and a customer in real time.
| 1 |
Click Customer Assist
|
| 2 |
Click an agent in the list, then click Monitor The agent hears a notification tone when you join their call. 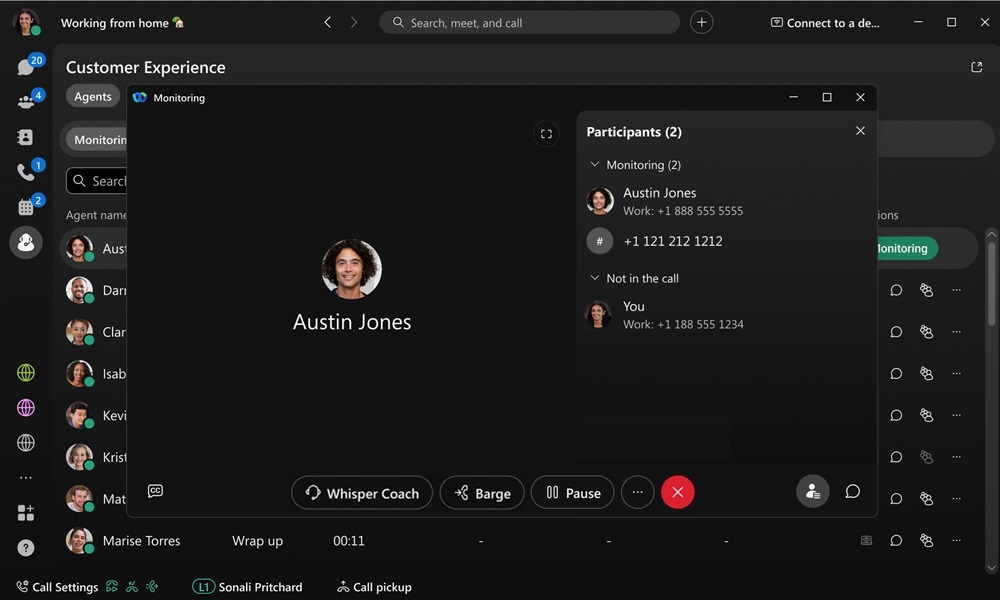
|
| 3 |
(Optional) Click Whisper Coach
|
| 4 |
(Optional) Click Barge
|
| 5 |
Click |
 .
. to talk only to the agent. You can then click
  to return to monitoring the call or click
 to join the call.
 to end monitoring.
Send a message to an agent
Chat with an agent, you can send and receive messages directly with them.
| 1 |
Click Customer Assist
|
| 2 |
Click an agent in the list, then click Chat Your space with the agent opens. |
 .
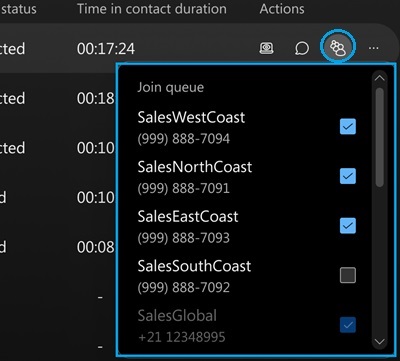
.Manage agents in queues
Agents are assigned to queues and you can choose to join or unjoin the agents to queues. When agents join queues and are available, they start to receive calls.
| 1 |
Click Customer Assist
|
| 2 |
Click an agent in the list, then click Join agent to queue
|
| 3 |
For each queue in the list, you can check the queue checkbox and the agent joins that queue. You can also uncheck a queue checkbox, to unjoin the agent from the queue. |
 .
.Change agent status
Choose whether your agents are available or unavailable to take calls in their queues.
| 1 |
Click Customer Assist
|
| 2 |
Click an agent in the list, then click 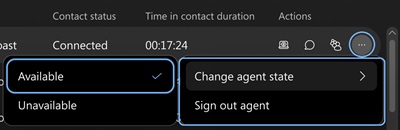
|
| 3 |
Click Change Agent state and then choose either Available or Unavailable. |
 .
.Sign out an agent
| 1 |
Click Customer Assist
|
| 2 |
Click an agent in the list, then click 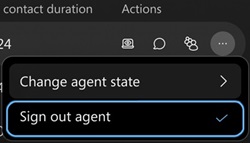
|
| 3 |
Click Sign out Agent. |
Generate reports
Generate a Customer Assist report for a specific date range, time range, and time zone. After you generate the report, you can download it from Reports.
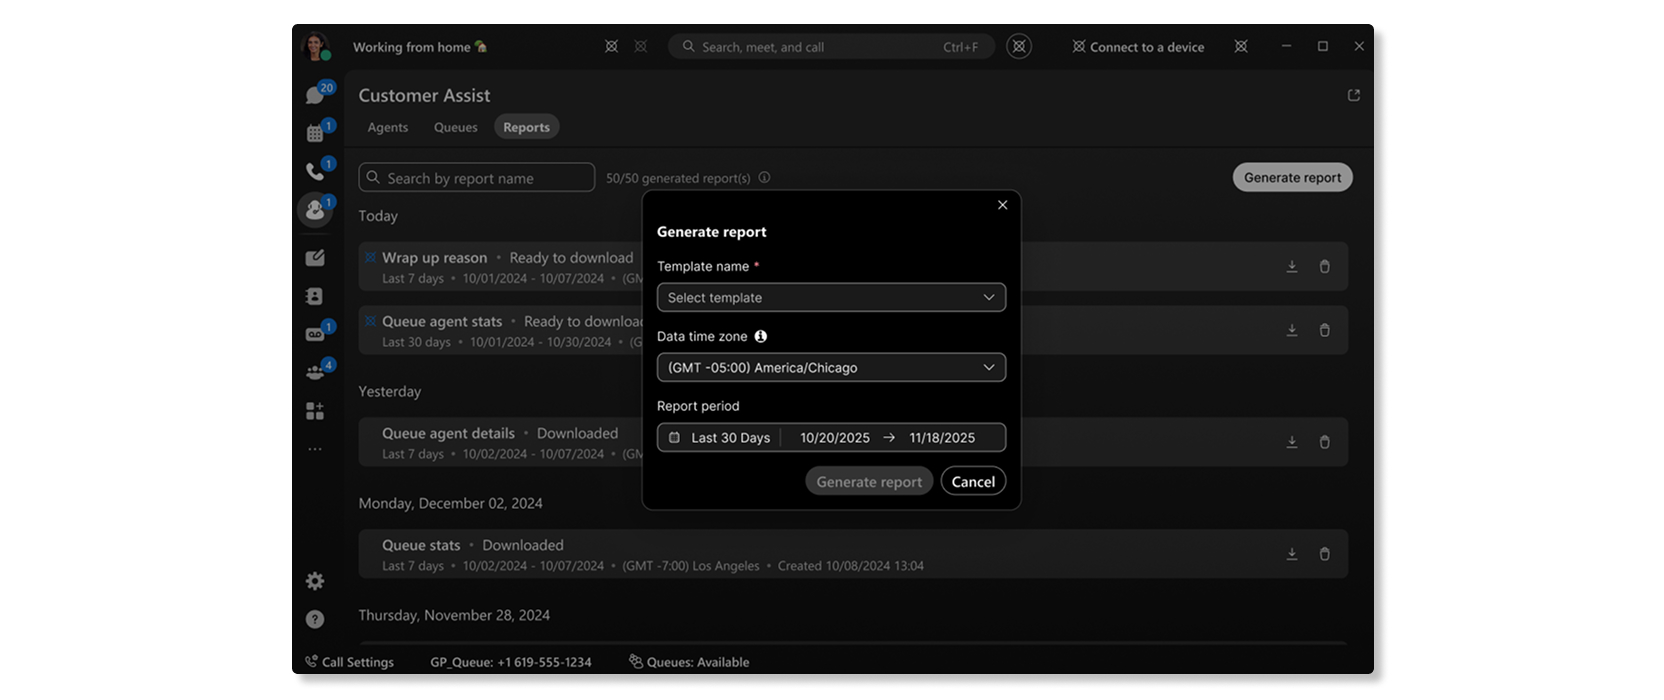
Before you begin
When generating reports in Webex App, note that:
-
Scheduling reports from Webex App isn't supported.
-
You can select data for Today when generating reports.
-
Wrap-up Reason and Queue Agent Activity Details are the two reports available to generate in Webex App.
-
Reports available to a supervisor may depend on the Customer Assist configuration and the report templates enabled for the organization.
-
You can select up to 92 days of data in the custom date range picker.
| 1 |
Select Customer Assist
|
| 2 |
Choose the report type. |
| 3 |
Choose the date range, time range, and time zone. |
| 4 |
Click Generate report. |
The report appears in Reports. When the report is ready, click Download to save it as a CSV file.
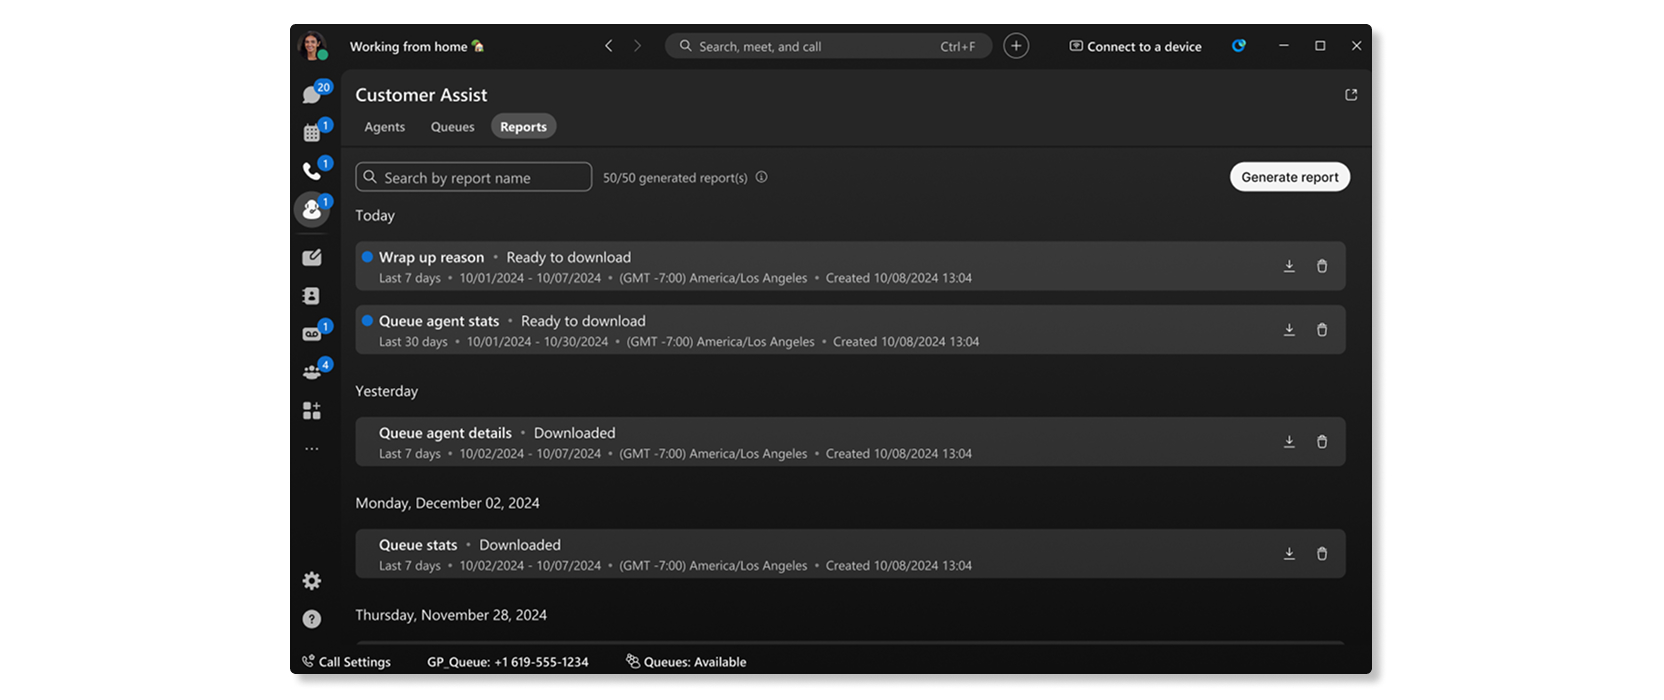
Download reports
After you generate a report, you can download the report as a CSV file.
| 1 |
Click Customer Assist
|
| 2 |
Click Download next to the report of your choosing. |
View agent statistics
Review the performance of your agents over a period of time. Analyze the available agent information such as connected counts, average handle time, average inbound connection time, average inbound hold time and many more.
| 1 |
Click Customer Assist
|
| 2 |
Choose a date range, or a time range to narrow your view. |
| 3 |
Choose a filter to view specific information. |
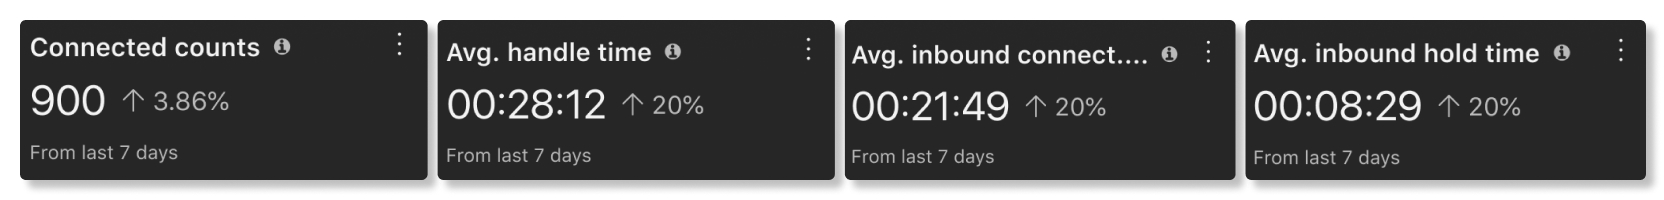
Agents statistics
KPIs
KPIs are available at the top of the page to show you details about how agents are handling calls. The KPIS available are:
- Connected counts—Number of connected calls answered by agents over the selected date range.
- Avg. handle time—Average amount of time that agents spent handling calls over the selected date range. Handle time includes talk time, hold time, and ring time.
- Avg. inbound connected time—Average amount of time that agents spent connected with calls over the selected date range.
- Avg. inbound hold time—Average amount of time that agents put an inbound call on hold over the selected date range.
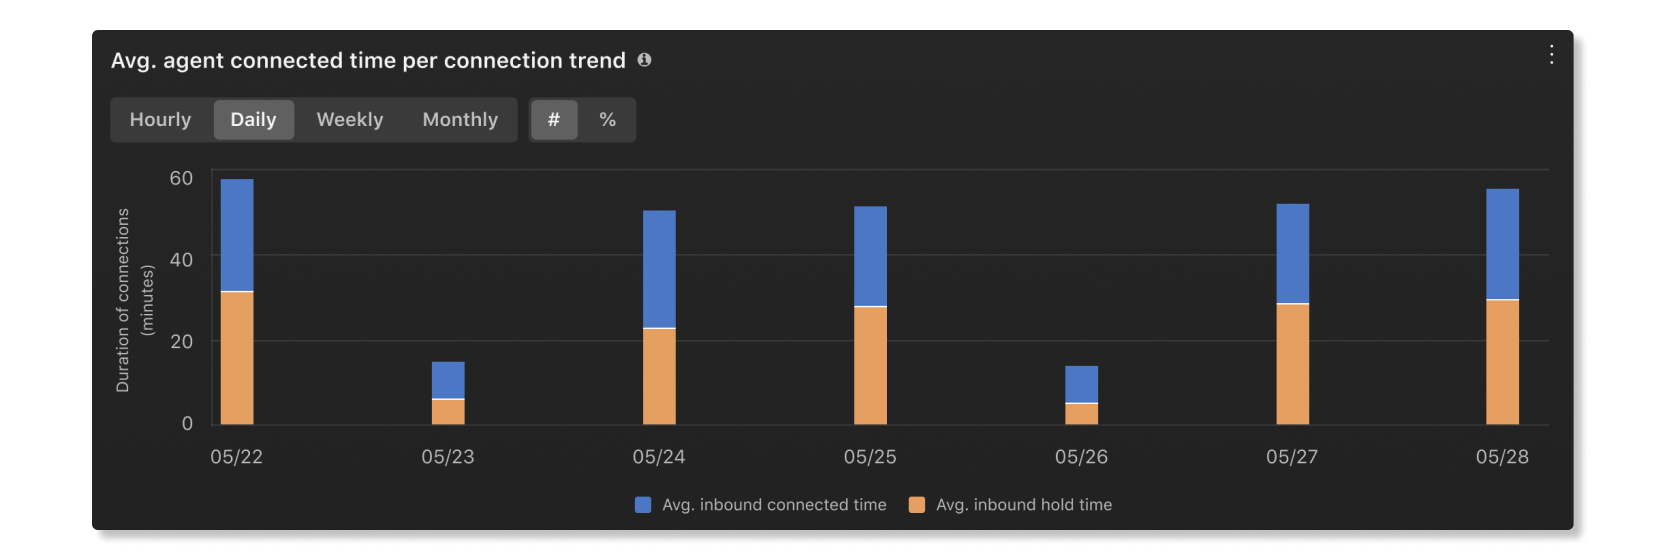
Avg. agent connected time per connection trend
This chart shows a trend of inbound status times of agents per connection over the selected date range. This chart helps you see if hold times are increasing over time because there aren't enough agents or if calls are getting answered in a timely manner.
Avg. inbound connected time by agents
This chart shows the agents with the longest average inbound connected times in ascending or descending order over the selected date range. You can use this chart to see if there are any outliers in how long calls can take.

Avg. inbound hold time by agents
This chart shows the agents with the longest average inbound hold times in ascending or descending order over the selected date range. You can use this chart to see if more agents are needed in a specific call queue if calls are getting put on hold for longer than average.

Queue agents
This table shows details of the agents that have been assigned to call queues in your organization. You can use this table to see which agent gets the most calls and information about their calling stats. The details available are:
- Agent name—Name of the agent.
- Queue name—Name of the call queue.
- Location—Location assigned to the call queue.
- Answered calls—Number of calls that the agent answered.
- Bounced calls—Number of calls that are presented to the agent but went unanswered.
- Abandoned calls—Number of calls where callers hung up or left a message before an agent became available.
- Other unanswered calls—Number of calls that had a status other than unanswered. For example, instances where the caller didn't make a key selection.
- Presented calls—Number of inbound calls to the agent that were distributed by the call queue.
- Total talk time—Total time that an agent spent actively talking on calls.
- Avg. inbound talk time—Average time that an agent spent actively talking on calls.
- Total hold time—Total time that an agent put calls on hold.
- Avg. inbound hold time—Average time that an agent put calls on hold.
- Total handle time—Total time an agent spends on a call from a queue. This is recorded when the agent ends or transfers the call. Handle time includes talk time, hold time, and ring time.
- Avg. handle time—Average time that an agent spent handling calls. Handle time includes talk time, hold time, and ring time.
- agentId—Unique identifier of the agent answering the call offered from the queue.
View Agent Wrap up
Review the performance of your agents when they apply wrap up reasons for their calls.
| 1 |
Click Customer Assist
|
| 2 |
Choose a date range or a time range to narrow your view. |
| 3 |
Choose a filter to view specific information. |
Agents wrap up
KPIs
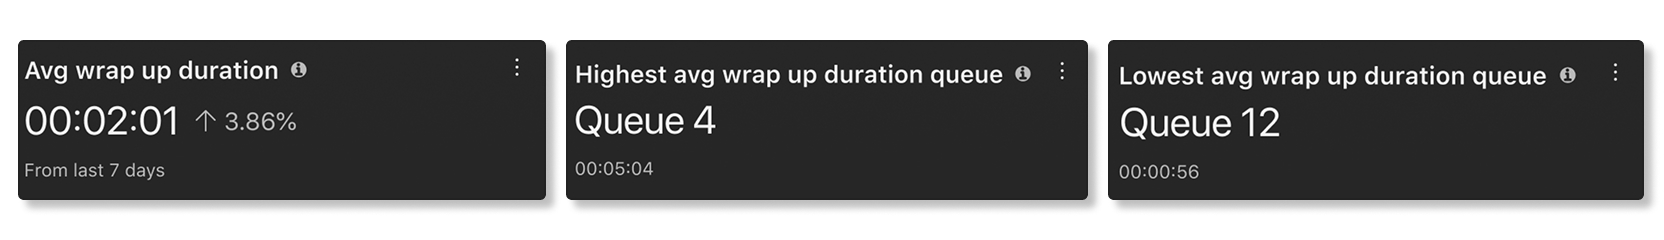
KPIs are available at the top of the page to show you statistics on how agents wrap up their calls. The KPIs available are:
- Avg wrap up duration—The average wrap up duration across all agents in the organization.
- Highest avg wrap up duration queue—The queue with agents who had the highest average wrap up duration over the date range selected.
- Lowest avg wrap up duration queue—The queue with agents who had the lowest average wrap up duration over the date range selected.
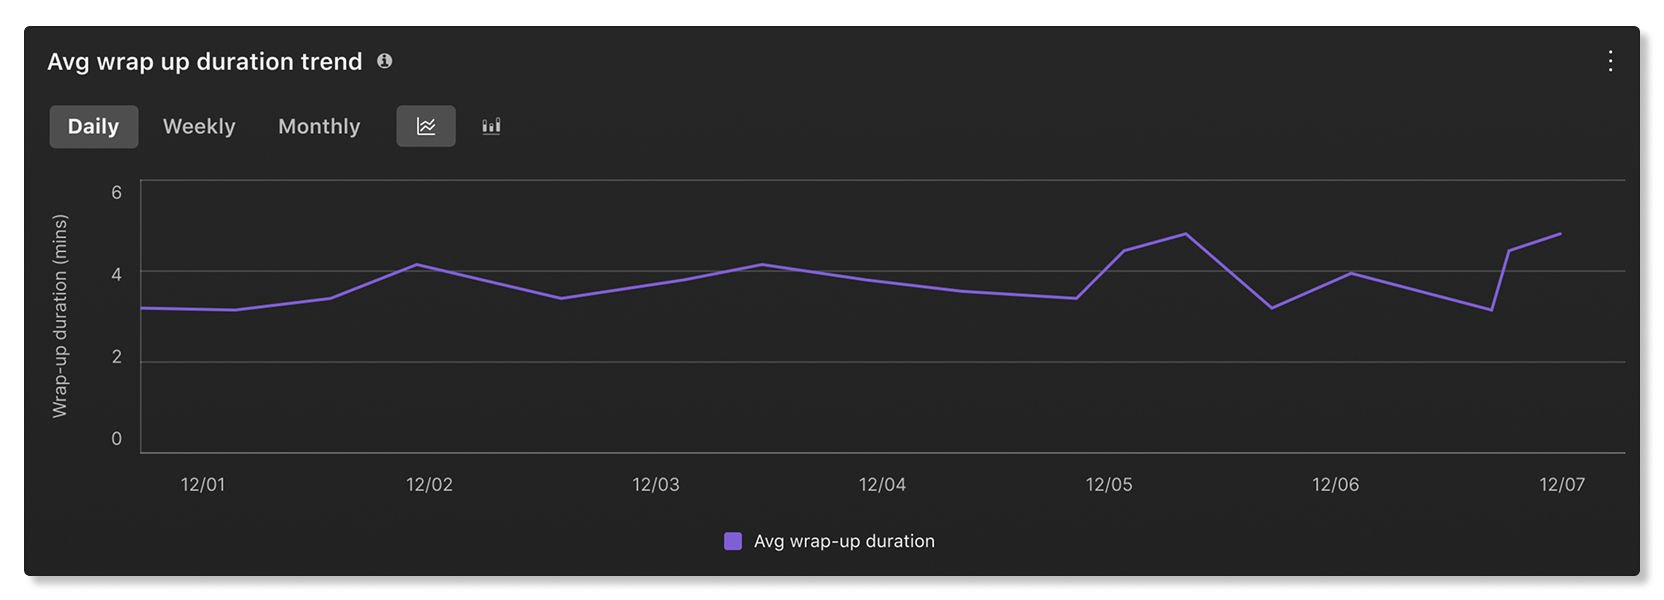
Avg wrap up duration trend
This chart shows the trend of average wrap up duration across all queues over the selected date range. You can use this information to see which days have a higher than average wrap up durations, and investigate those days to find out the reason why the average durations were higher.
Top/Bottom wrap up reasons used
This table shows the top or bottom wrap up reasons used and their corresponding average wrap up duration over the selected date range. You can use this information to see which wrap up reasons were the most used in your organization and if the duration is expected for your organization's service-level agreement.

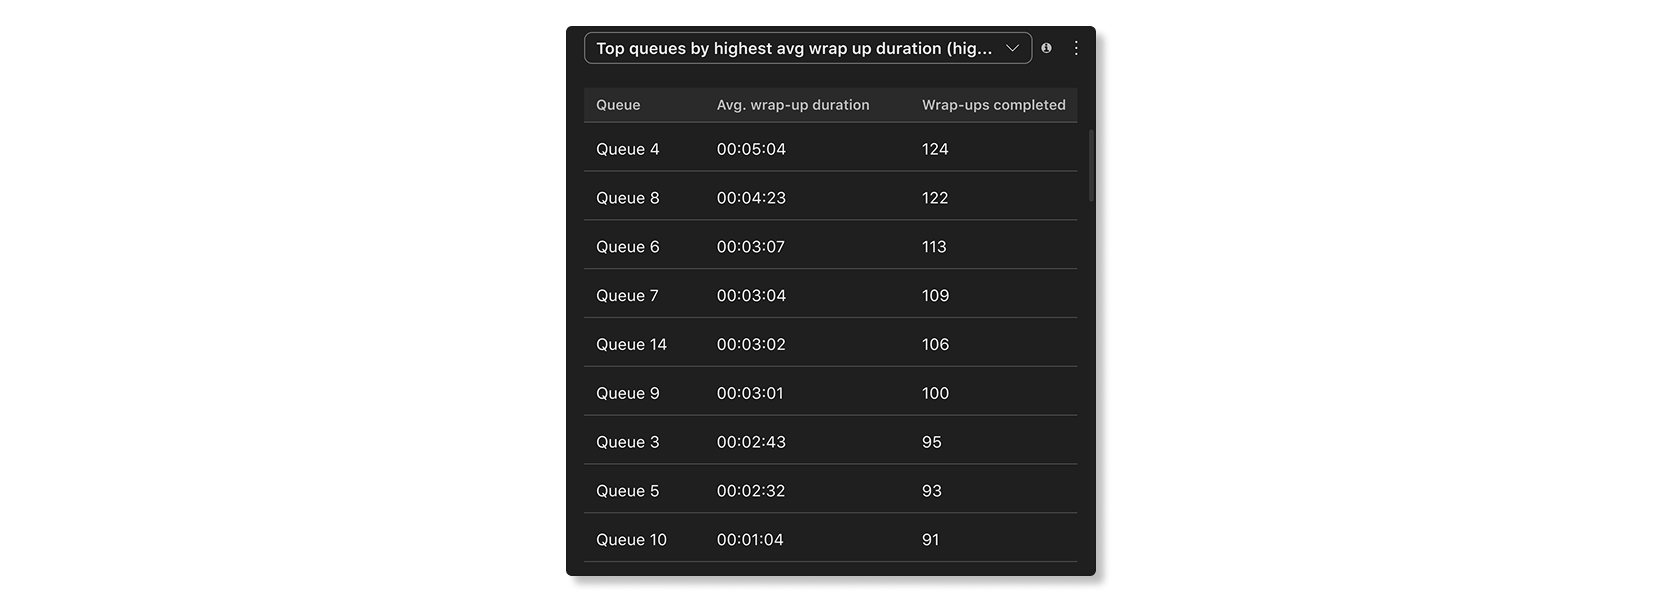
Top queues by highest/lowest avg wrap up duration
This table shows the top queues with the highest or lowest average wrap up duration and their corresponding wrap ups completed over the selected date range. You can use this information to gain insights on why certain queues take longer to complete their wrap ups than others.
Top agents by highest/lowest number of wrap ups completed
This table shows the top agents by number of wrap ups completed over the selected date range. and their corresponding average wrap up duration over the selected date range. You can use this information to see how well agents are performing in your organization.

Top agents by highest/lowest avg wrap up duration
This table shows the top agents with the highest or lowest wrap up duration and their corresponding wrap ups completed over the selected date range. You can use this information to help agents improve their wrap up times to provide a consistent customer service experience.

View call queues in real time
Review queues and see how they are progressing. Analyze the available information, such as the average wait time, number of calls in each queue and how many agents are available for answering call.
| 1 |
Click Customer Assist
Queue information displays including: queue name, contacts currently in queue, total agents, agents staffed, agents idle, and agents unavailable. 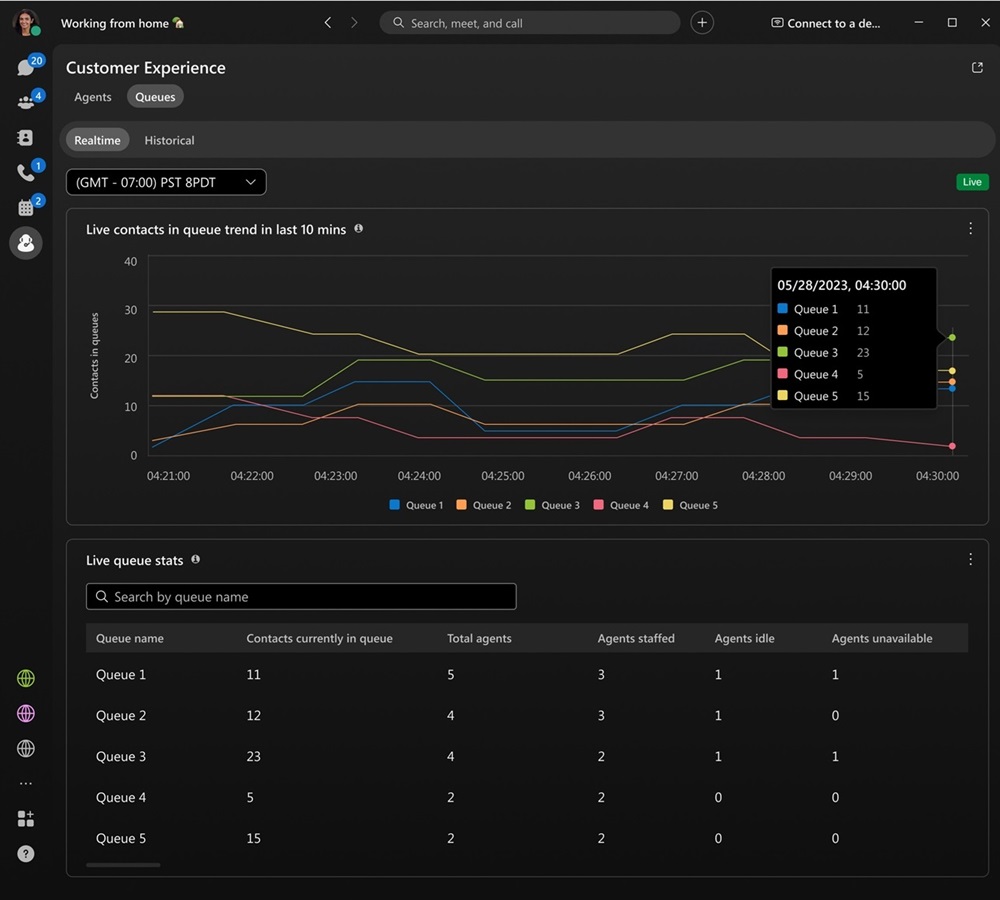
|
| 2 |
Choose how you want to view the queues:
|
Queue realtime
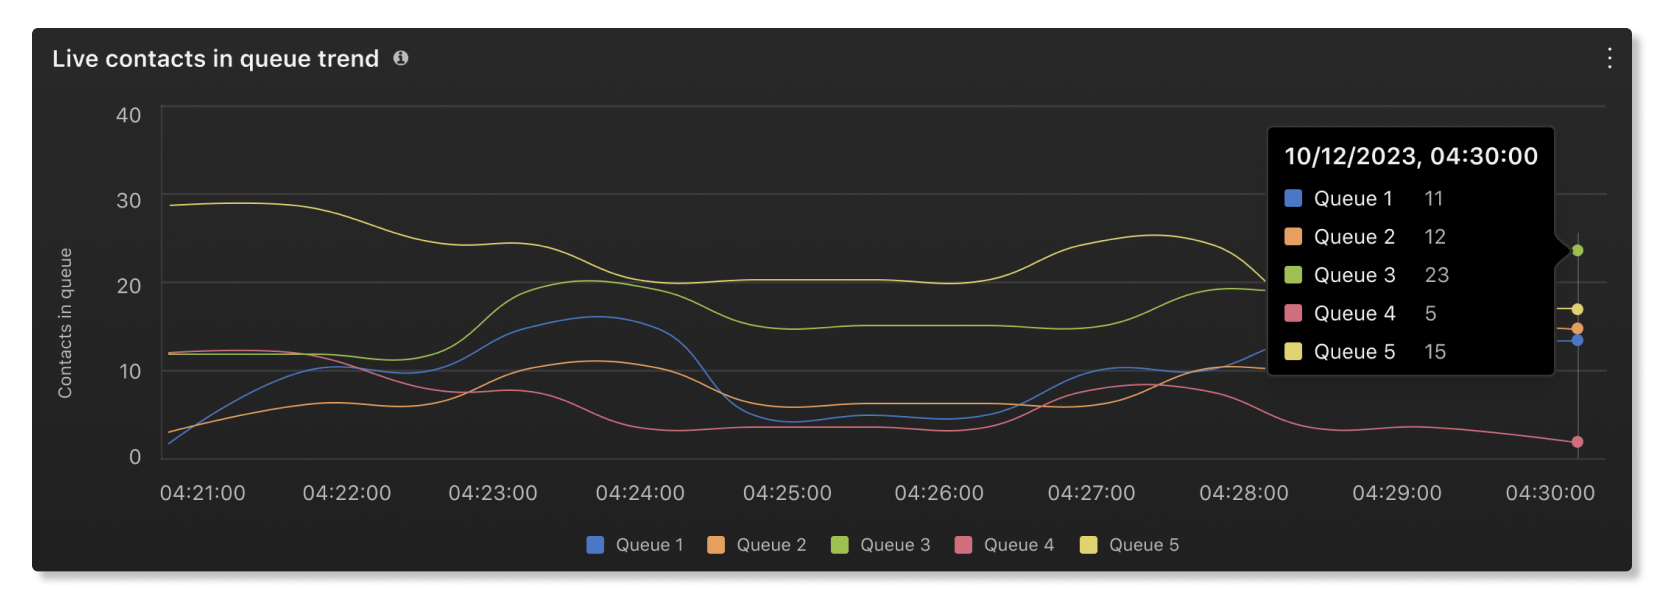
Live contacts in queue trend
This chart shows how many callers are currently waiting in a queue. You can use this chart to see when the peak calling times are so that you can adjust call queues or reassign agents as needed.
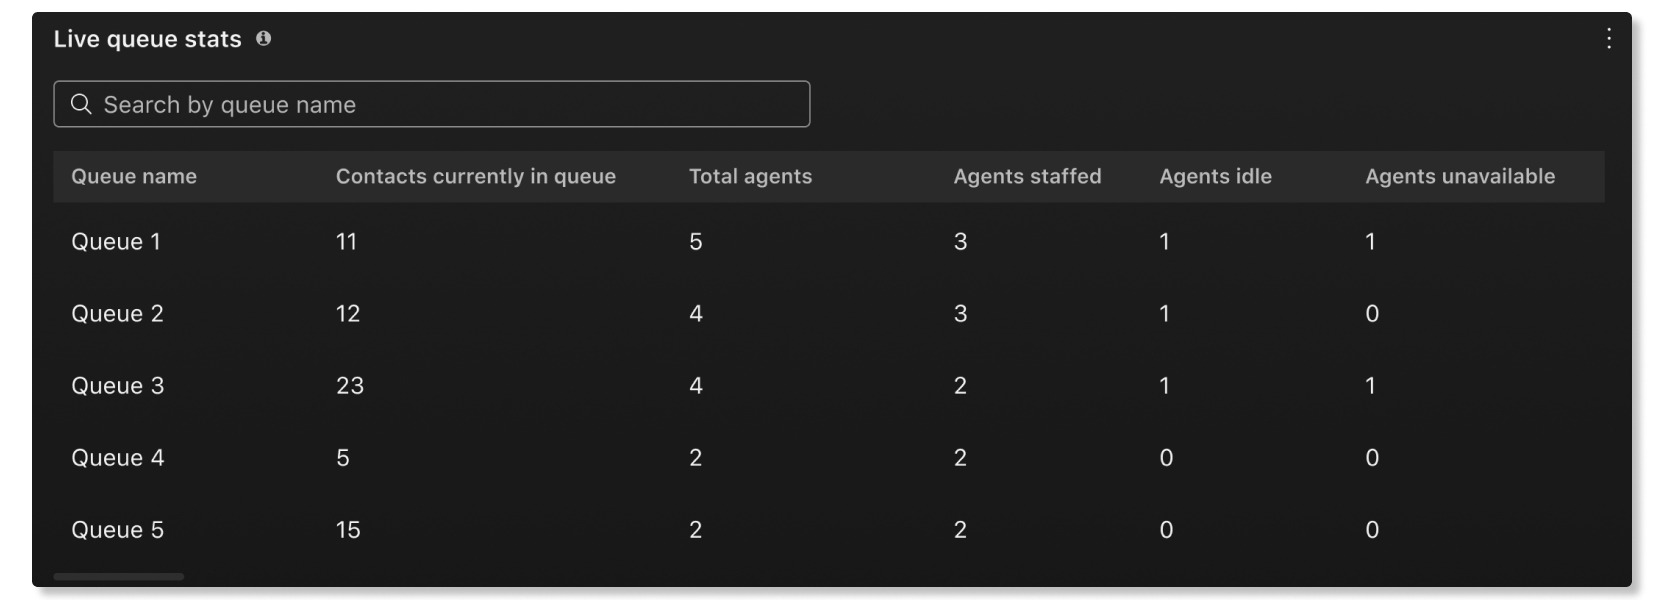
Live queue stats
This table shows details of agent statuses and the number of contacts waiting in queues. You can use this table to see if you need to adjust the number of agents in certain queues. The details available are:
- Queue name—Name assigned to the call queue.
- Contacts currently in queue—Number of callers that are waiting for an agent to be available.
- Total agents—Number of agents assigned to the queue.
- Agents staffed—Number of agents that have joined the queue.
- Agents idle—Number of agents that are available but not on a call.
- Agents unavailable—Number of agents that have set their status as "Unavailable" and aren't receiving calls.
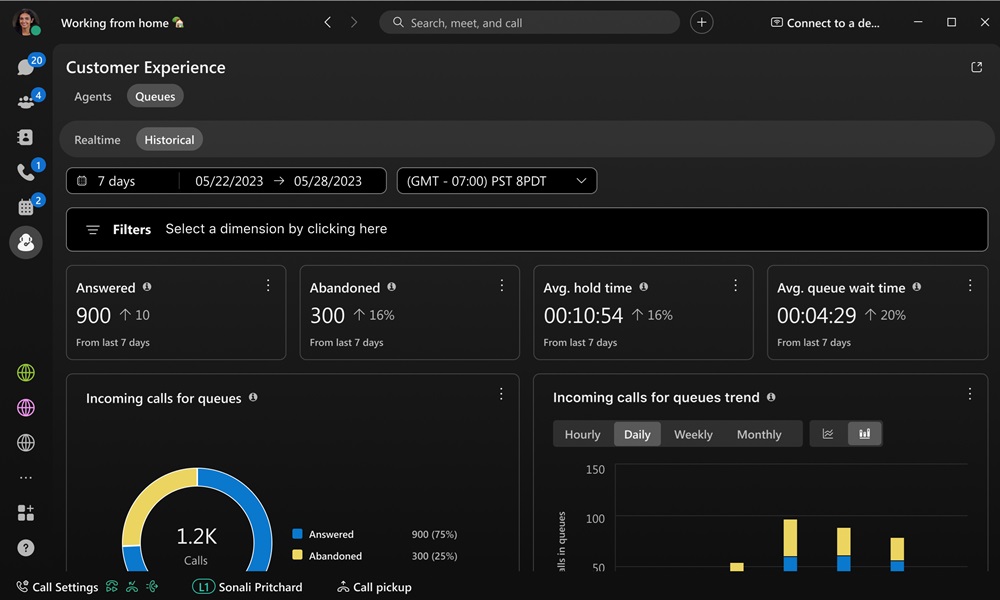
View historical data for queues
Review the performance of queues over a period of time. Analyze the available queue information, such as data for answered, abandoned, average hold time, average queue wait time, and much more.
| 1 |
Click Customer Assist
|
| 2 |
Choose a date range, or a time range to narrow your view. |
| 3 |
Choose a filter to view specific information. |
Queues historical
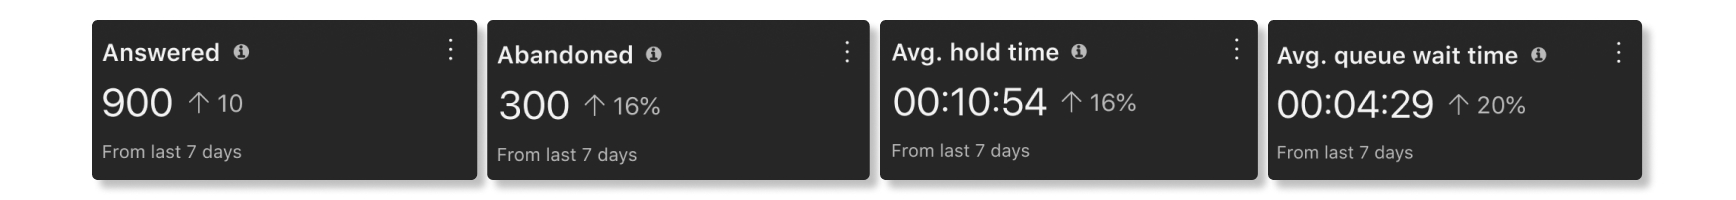
KPIs
KPIs are available at the top of the page to show you the high-level status of call queues. The KPIs available are:
- Answered—Number of calls that agents answered over the selected date range.
- Abandoned—Number of calls where the caller hung up or left a message before an agent became available over the selected date range.
- Avg. hold time—Average time that agents put callers on hold over the selected date rage.
- Avg. queue wait time—Average time that callers spent waiting for the next available agent to answer the call over the selected date range.
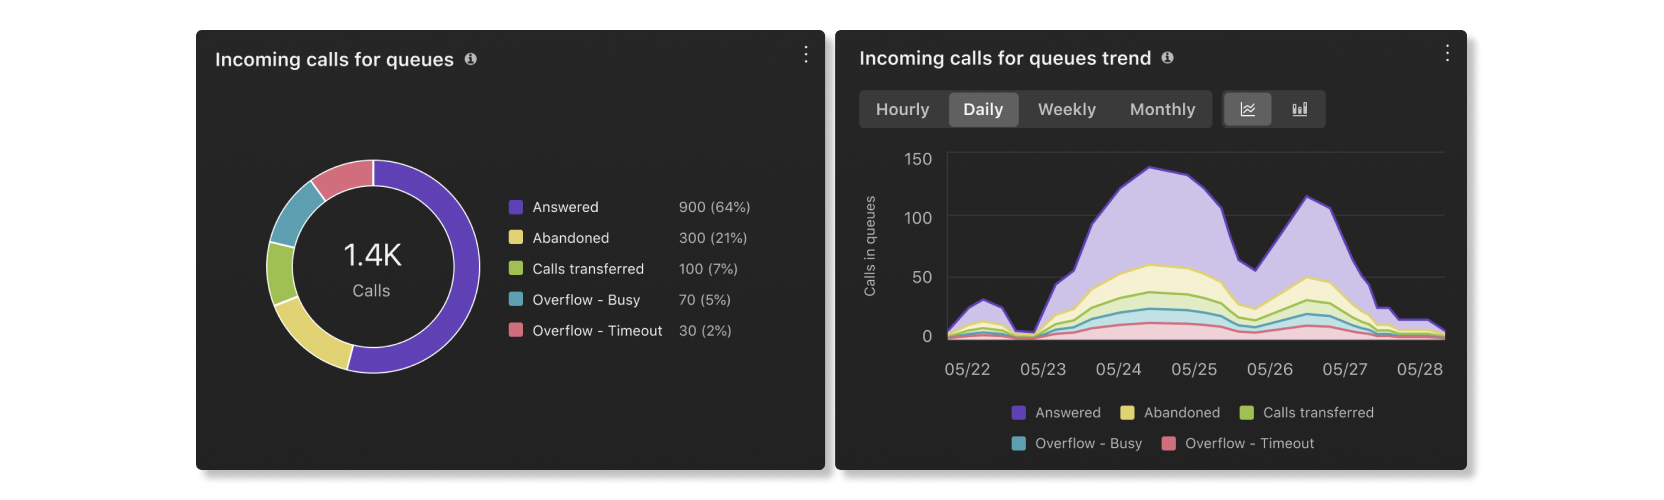
Incoming calls for queues and trend
These charts categorize incoming calls based on their statues. You can use this chart to get a general overview of how call queues are performing.
Avg. queue wait time per call
This chart shows the call queue with the longest average wait time per call by ascending or descending order over the selected date range. You can use this chart to see which call queue needs more agents assigned to it to help reduce the wait time.

Avg. queue hold time per call
This chart shows the call queue with the longest average hold time per call by ascending or descending order over the selected date range. You can use this chart to see when callers were put on hold for longer than average.

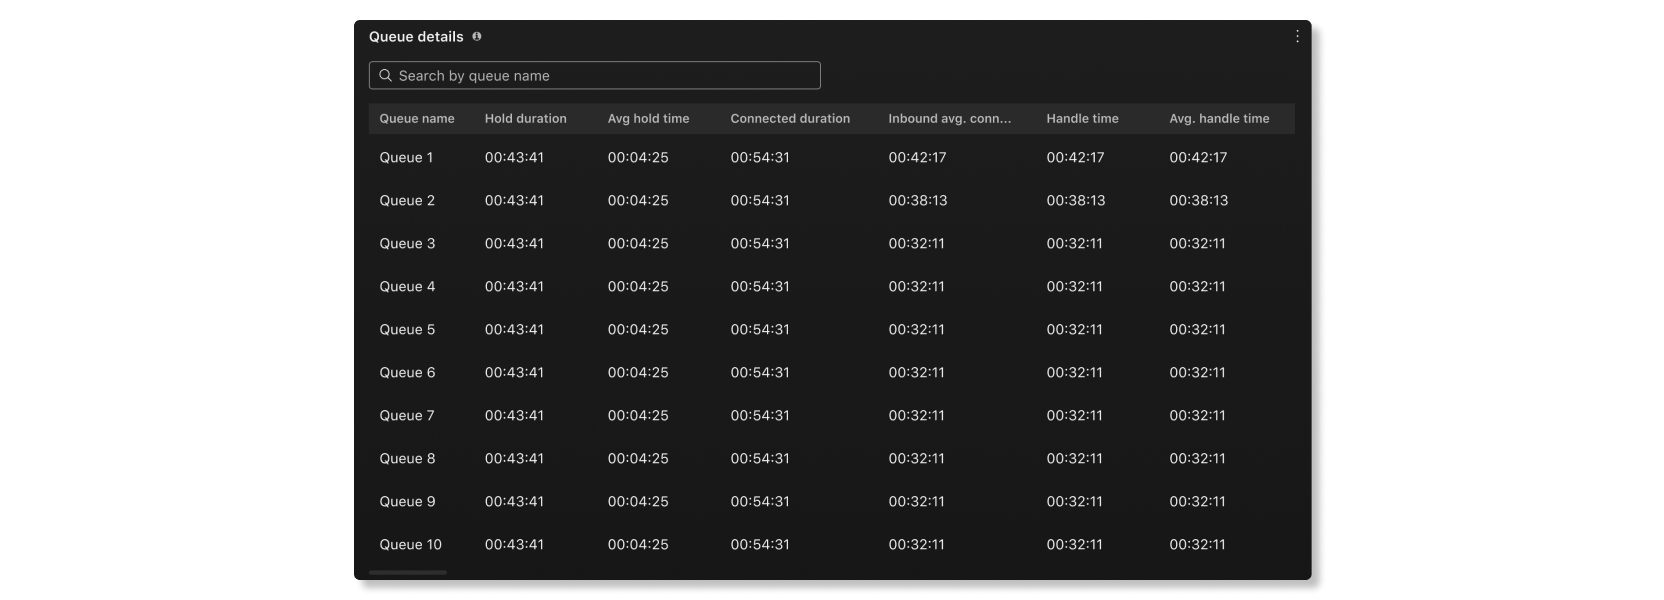
Queue details
This table shows details about call queues that have been set up in your organization. You can use this chart to see how agents in each call queue are performing. The details available are:
- Queue name—Name of the call queue.
- Hold duration—Amount of time that callers were put on hold.
- Avg hold time—Average amount of time per call that callers were put on hold.
- Connected duration—Amount of time that callers talked to agents.
- Inbound avg. connected duration—Average amount of time per call that callers talked to agents.
- Handle time—Amount of time that agents spent on a call from a queue. This is recorded when agents end or transfer the call. Handle time includes talk time, hold time, and ring time.
- Avg. handle time—Average amount of time that agents spent handling calls over the selected date range. Handle time includes talk time, hold time, and ring time.
- Queue time—Amount of time that callers spent waiting for the next available agent to answer the call.
- Avg. queue wait time—Average time that callers spent waiting for the next available agent to answer the call.
- Answered—Number of calls answered by agents.
- Abandoned—Number of calls where callers hung up or left a message before an agent became available.
- Total calls—Total number of incoming calls.